1311
In vivo validation of OVS-localized navigator for prospective frequency correction in MRSI1Hoglund Brain Imaging Center, University of Kansas Medical Center, Kansas City, KS, United States, 2Department of Neurology, University of Kansas Medical Center, Kansas City, KS, United States, 3Department of Molecular & Integrative Physiology, University of Kansas Medical Center, Kansas City, KS, United States
Synopsis
Data acquisition for MRS and MRSI requires a stable scanner frequency during the relatively long scan time. However, gradient heating and subject motion during the scan result in drifts of the scanner frequency. The effects of frequency drifts include reduced SNR, broad linewidth, and errors in spatial encoding and metabolite quantification. We had recently proposed a new navigator approach: outer volume suppression (OVS)-localized navigator, to prospectively correct frequency drifts without introducing SNR losses, overcoming the shortcomings of previous PRESS-localized navigator. The purpose of this study is to validate the OVS-localized navigator approach through the comparison with non-localized navigator and the quantitative evaluations of spectral quality and metabolite concentrations in 10 healthy subjects.
INTRODUCTION
Data acquisition for MRS and MRSI requires a stable scanner frequency during the relatively long scan time. However, gradient heating and subject motion during the scan result in drifts of the scanner frequency. The effects of frequency drifts include reduced SNR, broad linewidth, and errors in spatial encoding and metabolite quantification. 1-12 We had recently proposed a new navigator approach: outer volume suppression (OVS)-localized navigator, 13 to prospectively correct frequency drifts without introducing SNR losses, overcoming the shortcomings of previous PRESS-localized navigator. 5,10 The purpose of this study is to validate the OVS-localized navigator approach through the comparison with non-localized navigator 2,6,11 and the quantitative evaluations of spectral quality and metabolite concentrations in 10 healthy subjects.METHODS
All the experiments were performed on a Skyra 3T scanner (Siemens, Erlangen, Germany). In the first experiment, frequency tracking accuracy of OVS-localized navigator was compared to that of non-localized navigator with a 1° flip angle. For the comparison, these two navigators were integrated into a single-voxel MRS sequence. Un-suppressed water signals were acquired with the navigator signals. Frequency drifts detected by the navigators were compared to those measured by the un-suppressed water signals (Fig. 1). The frequency tracking accuracies were compared through MRS measurements on a phantom with gradient heating-induced frequency drifts by a preceding 30-min DWI experiment. The frequency tracking accuracies were also compared through MRS measurements on a healthy subject, who was instructed to rotate around 10° around the sagittal axis periodically during data acquisition. In the second experiment, in vivo spectral quality and metabolite concentrations were assessed with and without the frequency correction in 10 healthy subjects. Three 2-D MRSI scans were performed on each subject, including one MRSI scan before a 30-min DWI experiment without frequency corrections and the other two MRSI scans after the DWI experiment with and without the frequency correction. MRSI data were acquired using a semi-LASER sequence 14 (TE/TR = 35/1600 ms, FOV = 20×20 cm2, slice thickness = 2 cm, VOI = 8×8 cm2, and 16×16 phase encoding). OVS-localized navigator was acquired in all MRSI scans to monitor frequency drifts. Spectral quality and metabolite concentrations were quantified using LCModel, 15 and were compared between MRSI scans.RESULTS
Both OVS-localized navigator and non-localized navigator equally tracked the gradient heating-induced frequency drifts (RMSE = 0.1 Hz vs. 0.1 Hz) (Fig. 1a). However, in the presence of motion-induced frequency drifts (Fig. 1b), only OVS-localized navigator tracked the frequency drifts (RMSE = 0.5 Hz vs. 4.4 Hz). In MRSI experiments on humans (N = 10), frequency drifts were increased from 0.6 ± 0.3 Hz/min to 5.1 ± 0.3 Hz by the DWI experiment-induced gradient heating. The increased frequency drifts resulted in significantly increased linewidth from 5.6 ± 0.6 Hz to 12.0 ± 1.1 Hz. The frequency drifts also resulted in increased biases of creatine and myo-inositol concentrations, and increased CRLB of NAA, choline, myo-inositol, and glutamate+glutamine of the spectra (p < 0.05) (Fig. 2 and Table 1). With the frequency correction, frequency drifts were reduced to 0.1 ± 0.1 Hz/min. The linewidth of the spectra was reduced to 5.4 ± 0.5 Hz. Metabolite concentrations and CRLB showed no significant differences compared with those before the DWI experiment (Fig. 2 and Table 1).DISCUSSION
This study demonstrated that OVS-localized navigator could prospectively correct both gradient heating- and motion-induced frequency drifts. In particular, corrections for motion-induced frequency drifts required a VOI-localized navigator due to changes of spatial distribution of B0 inhomogeneity. However, OVS-localized navigator could only partially restore the spectral quality due to other effects of motion including changes of B0 inhomogeneity and positions. Additional adjustments are necessary to fully restore spectral quality through prospective motion correction and shim update. 16,17 This study also demonstrated that the degraded spectral quality and unreliable metabolite quantifications resulting from frequency drifts can be restored using OVS-localized navigator. The improved spectral linewidth might contribute to the significantly reduced biases and uncertainties in metabolite quantification. While we expected an improvement of the SNR with the frequency correction over that without correction, we did not observe such effect in the SNR obtained from LCModel. This discrepancy could be due to inaccurate basis sets in conjunction with distorted broad line shapes that could artificially reduce LCModel fit residuals. 15 In conclusion, OVS-localized navigator could provide an effective prospective frequency correction for enhanced in vivo spectral quality and accurate metabolite quantification without SNR losses.Acknowledgements
This study was partly supported by NIH (UL1TR000001, P20GM103418). The Hoglund Brain Imaging Center is supported by the NIH (S10RR029577) and the Hoglund Family Foundation.References
[1]. Foerster et al., MRM (54), 1261-7, 2005. [2] Henry et al., MRM (42), 636-42, 1999. [3]. Schmidt et al., MAGMA (10), 167-70, 2000. [4]. Helms et al., MRM (46), 395-400, 2001. [5]. Thiel et al., MRM (47), 1077-82, 2002. [6]. Ebel et al., MRM (53), 465-9, 2005. [7]. Zaitsev et al., NMR Biomed (23), 325-32, 2010. [8]. Keating et al., MRM (64), 672-79, 2010 [9]. Ernst et al., MRM (65), 13-7, 2011. [10]. Lange et al., JMRI (33), 748-54, 2011 [11]. Tal et al., MRM (70), 895-904, 2013. [12]. Near et al., MRM (73), 44-50, 2015. [13]. Lee et al., ISMRM, 5526, 2017. [14]. Scheenen et al., MRM (59), 1-6, 2008. [15]. Provencher, NMR Biomed (14), 260-64, 2001. [16]. Hess et al., NMR Biomed (25), 347-58, 2012. [17]. Bogner et al., Neuroimage (88), 22-31, 2014.Figures
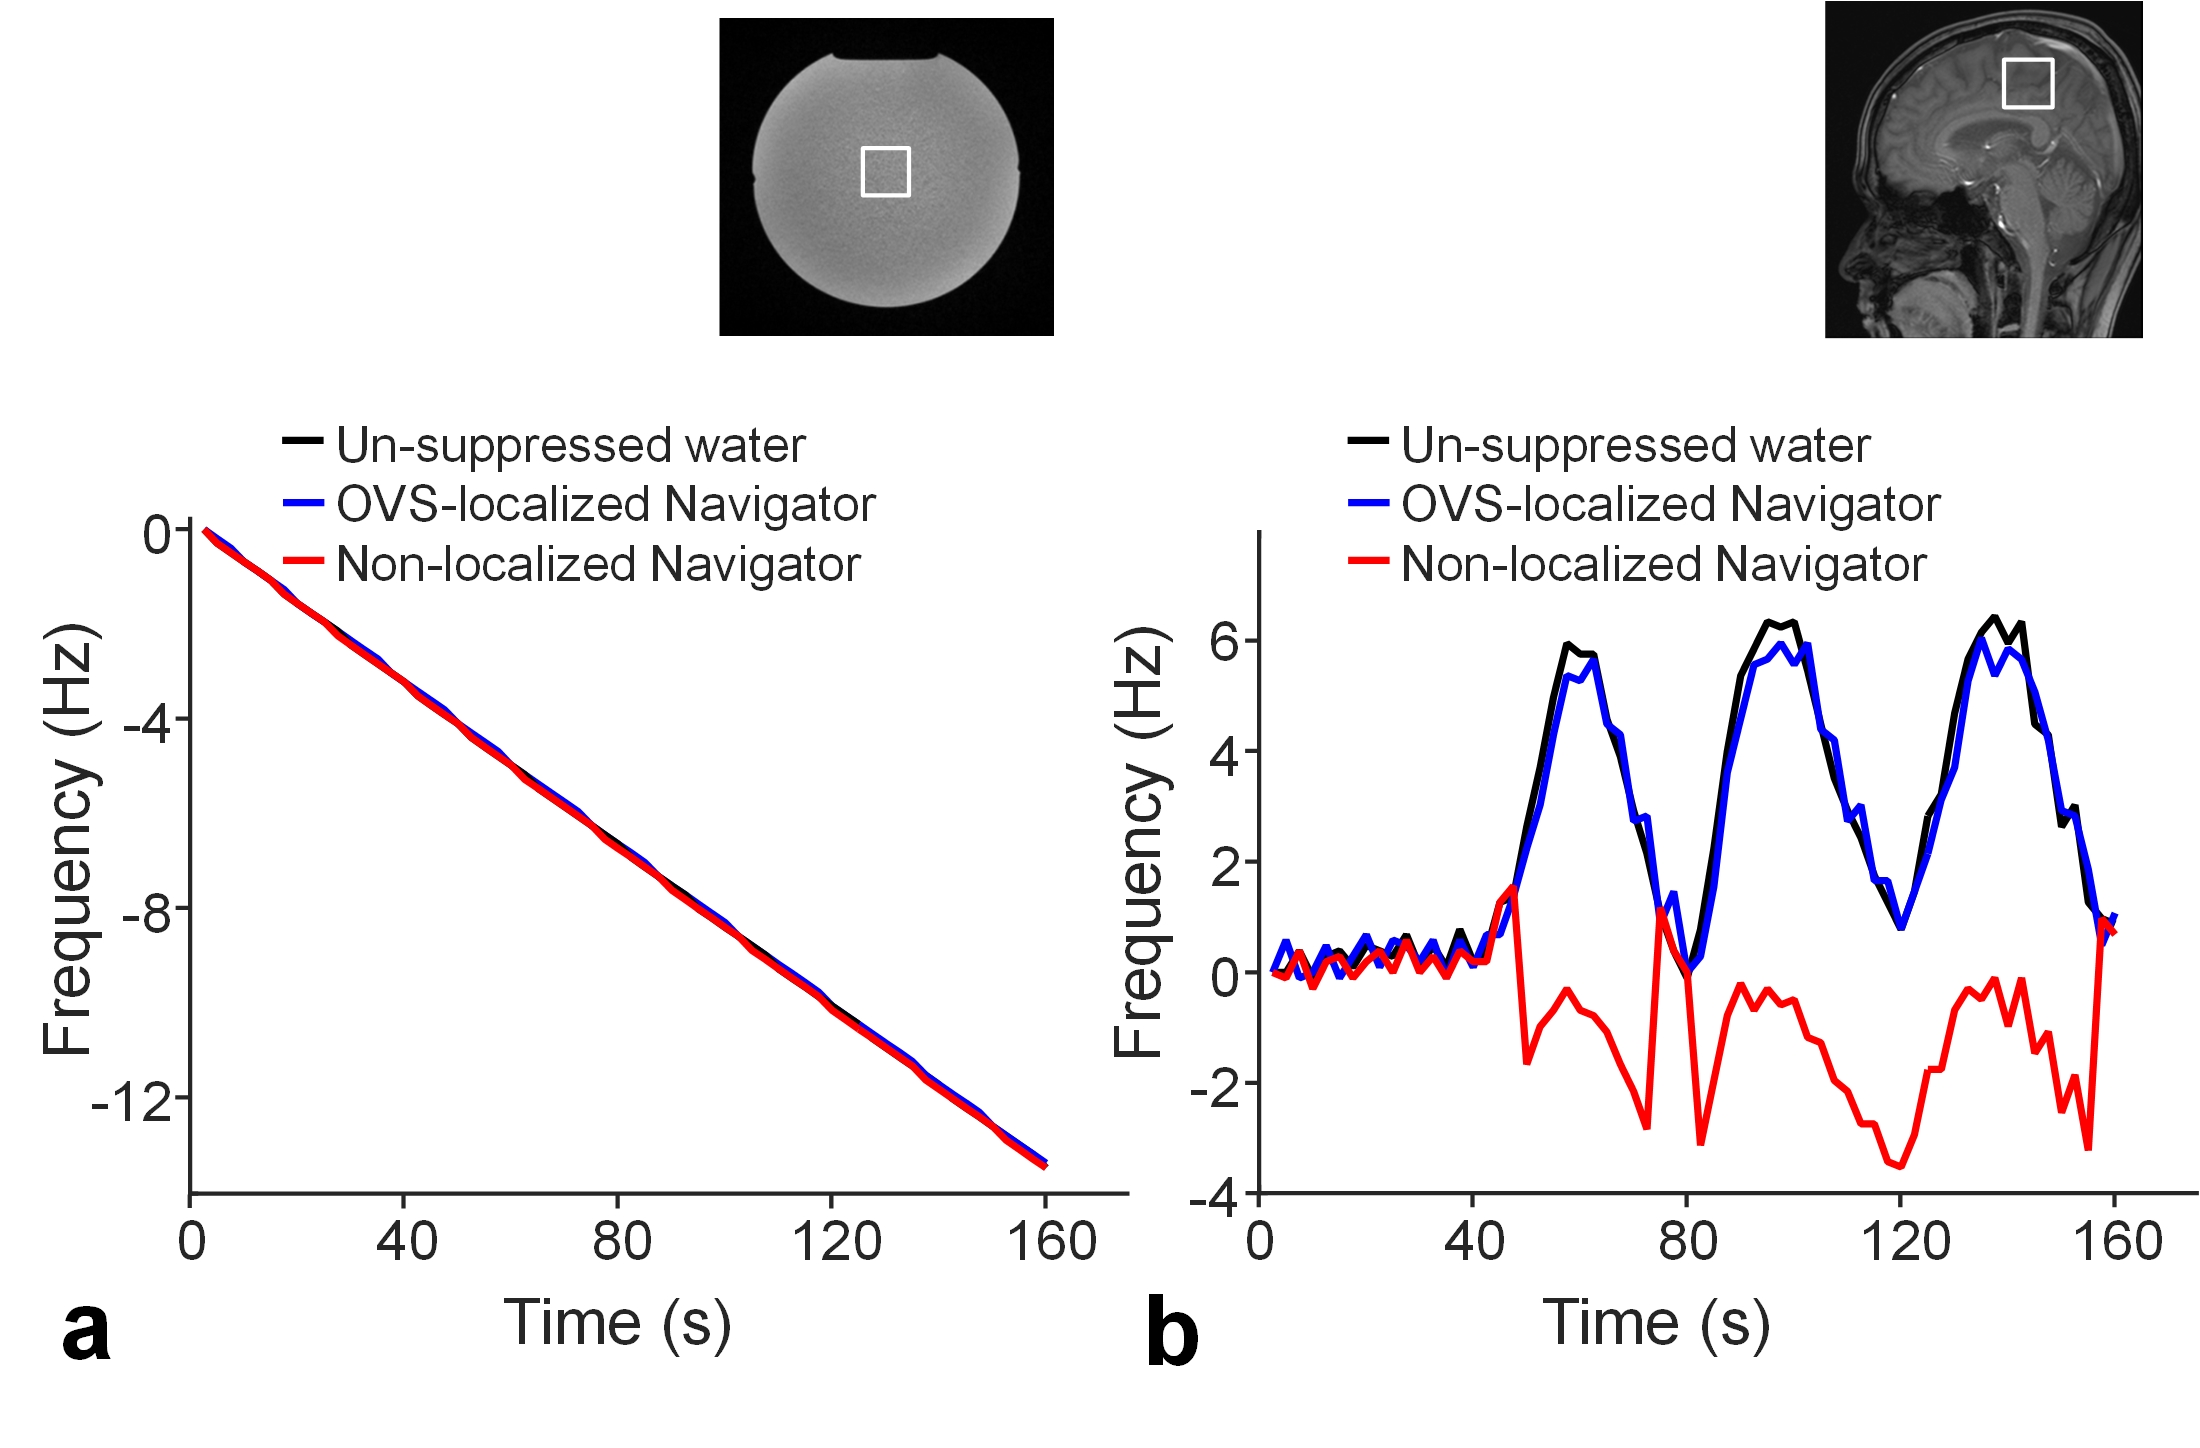
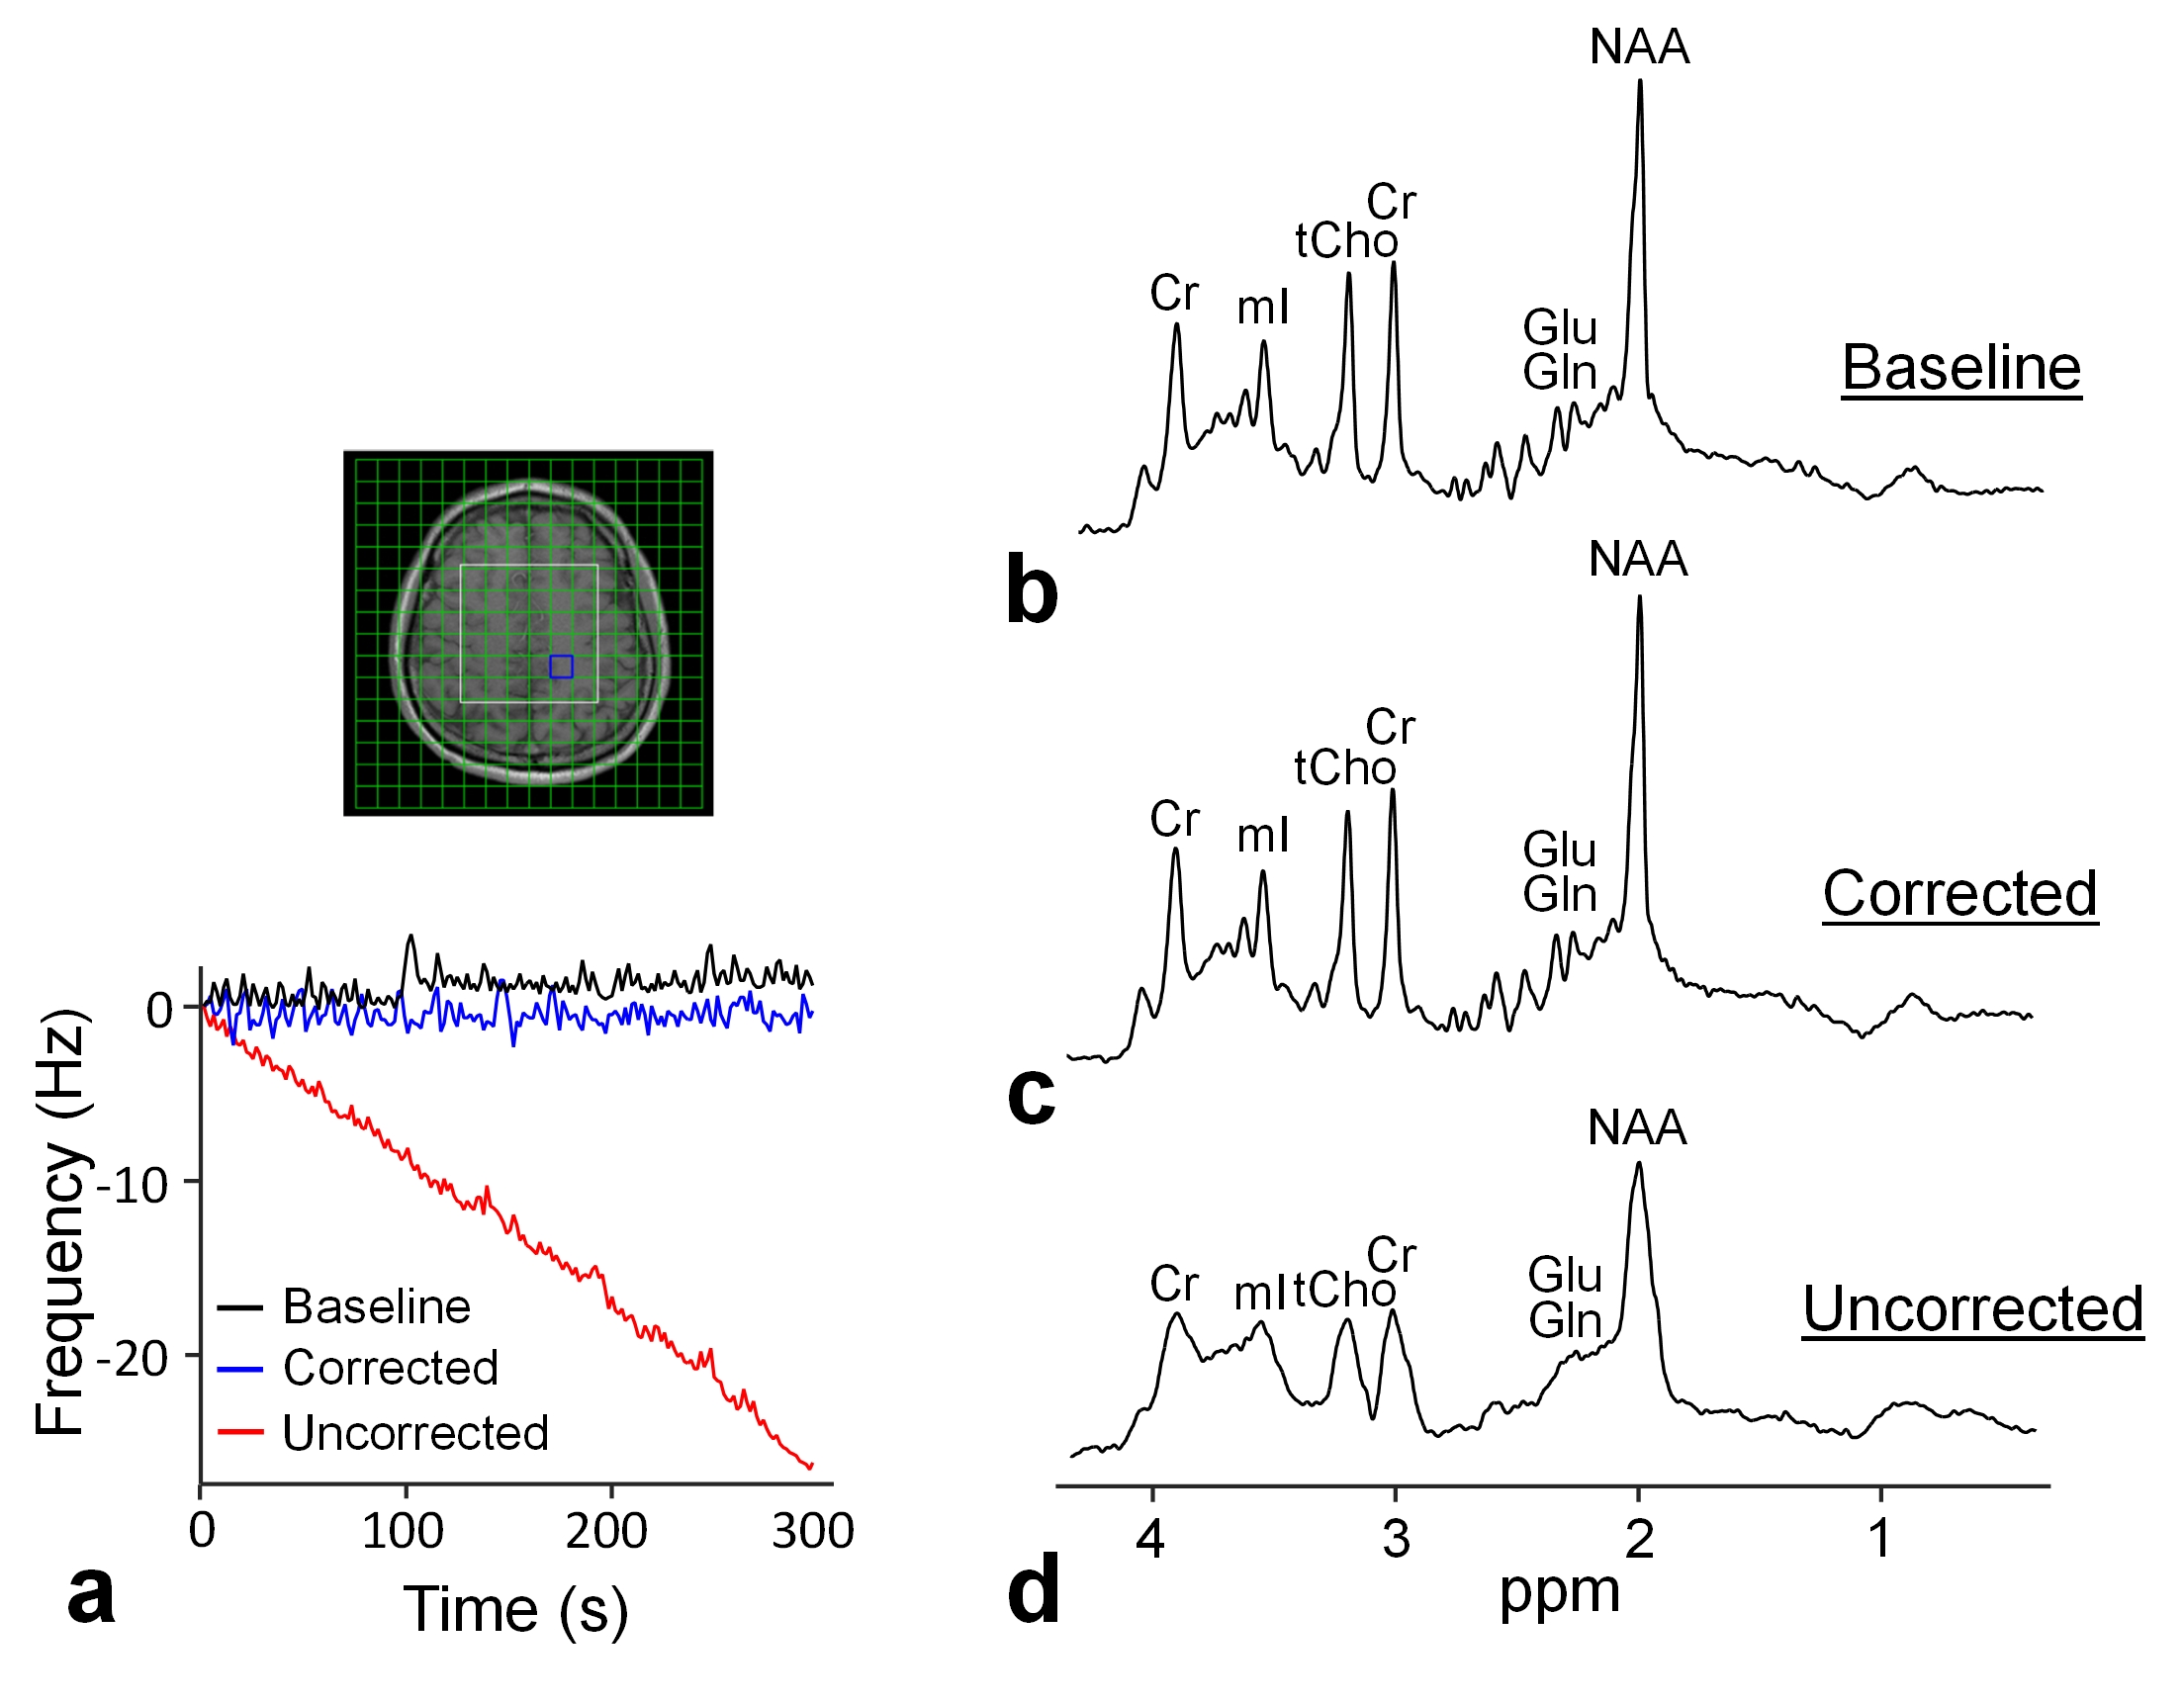
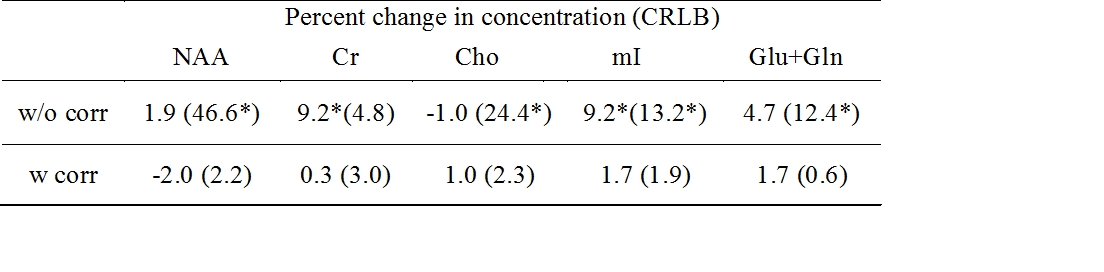
Table 1: Percentage changes in metabolite concentrations, and the Cramér-Rao lower bounds (CRLB) after the DWI experiment with and without the frequency correction. Percentage changes were computed in reference to the measurements before the DWI experiment. Significance level using the paired t-test; *, p < 0.05. Metabolite concentrations were evaluated using LCModel. 15