1309
Accelerated in vivo Phosphorus Magnetic Resonance Spectroscopic Imaging combining flyback-EPSI and Compressed Sensing1School of Biomedical Engineering, McMaster University, Hamilton, ON, Canada, 2Electrical and Computer Engineering, McMaster University, Hamilton, ON, Canada
Synopsis
Long acquisition time is still a major limitation in performing clinical 31P MRSI studies. To overcome this limitation we implemented and tested a pulse sequence that combines flyback EPSI readout and compressed sensing (CS). Our results, in human skeletal muscle, show the feasibility of performing 31P MRSI using this combined approach.
Introduction
Phosphorus MR spectroscopic imaging (31P-MRSI) is a non-invasive tool useful in evaluating high energy phosphate metabolism and mitochondrial function in skeletal muscle [1] and brain [2,3]. It’s utility is unquestionable, however very long acquisition times to compensate for the low intrinsic SNR constrain interest in regular usage. Attempts to overcome this limitation have focused on using parallel imaging [4], echo planar spectroscopic imaging (EPSI) [5], and a compressed sensing implementation on traditional phase encoding chemical shift imaging [6]. Furthermore, a combined scheme of these techniques has shown good results for hyperpolarized 13C-MRSI [7,8] and we reported the feasibility of applying a similar scheme to 31P MRSI [9]. In our current work, we implemented and tested this approach in healthy human calf muscles.Materials and Methods
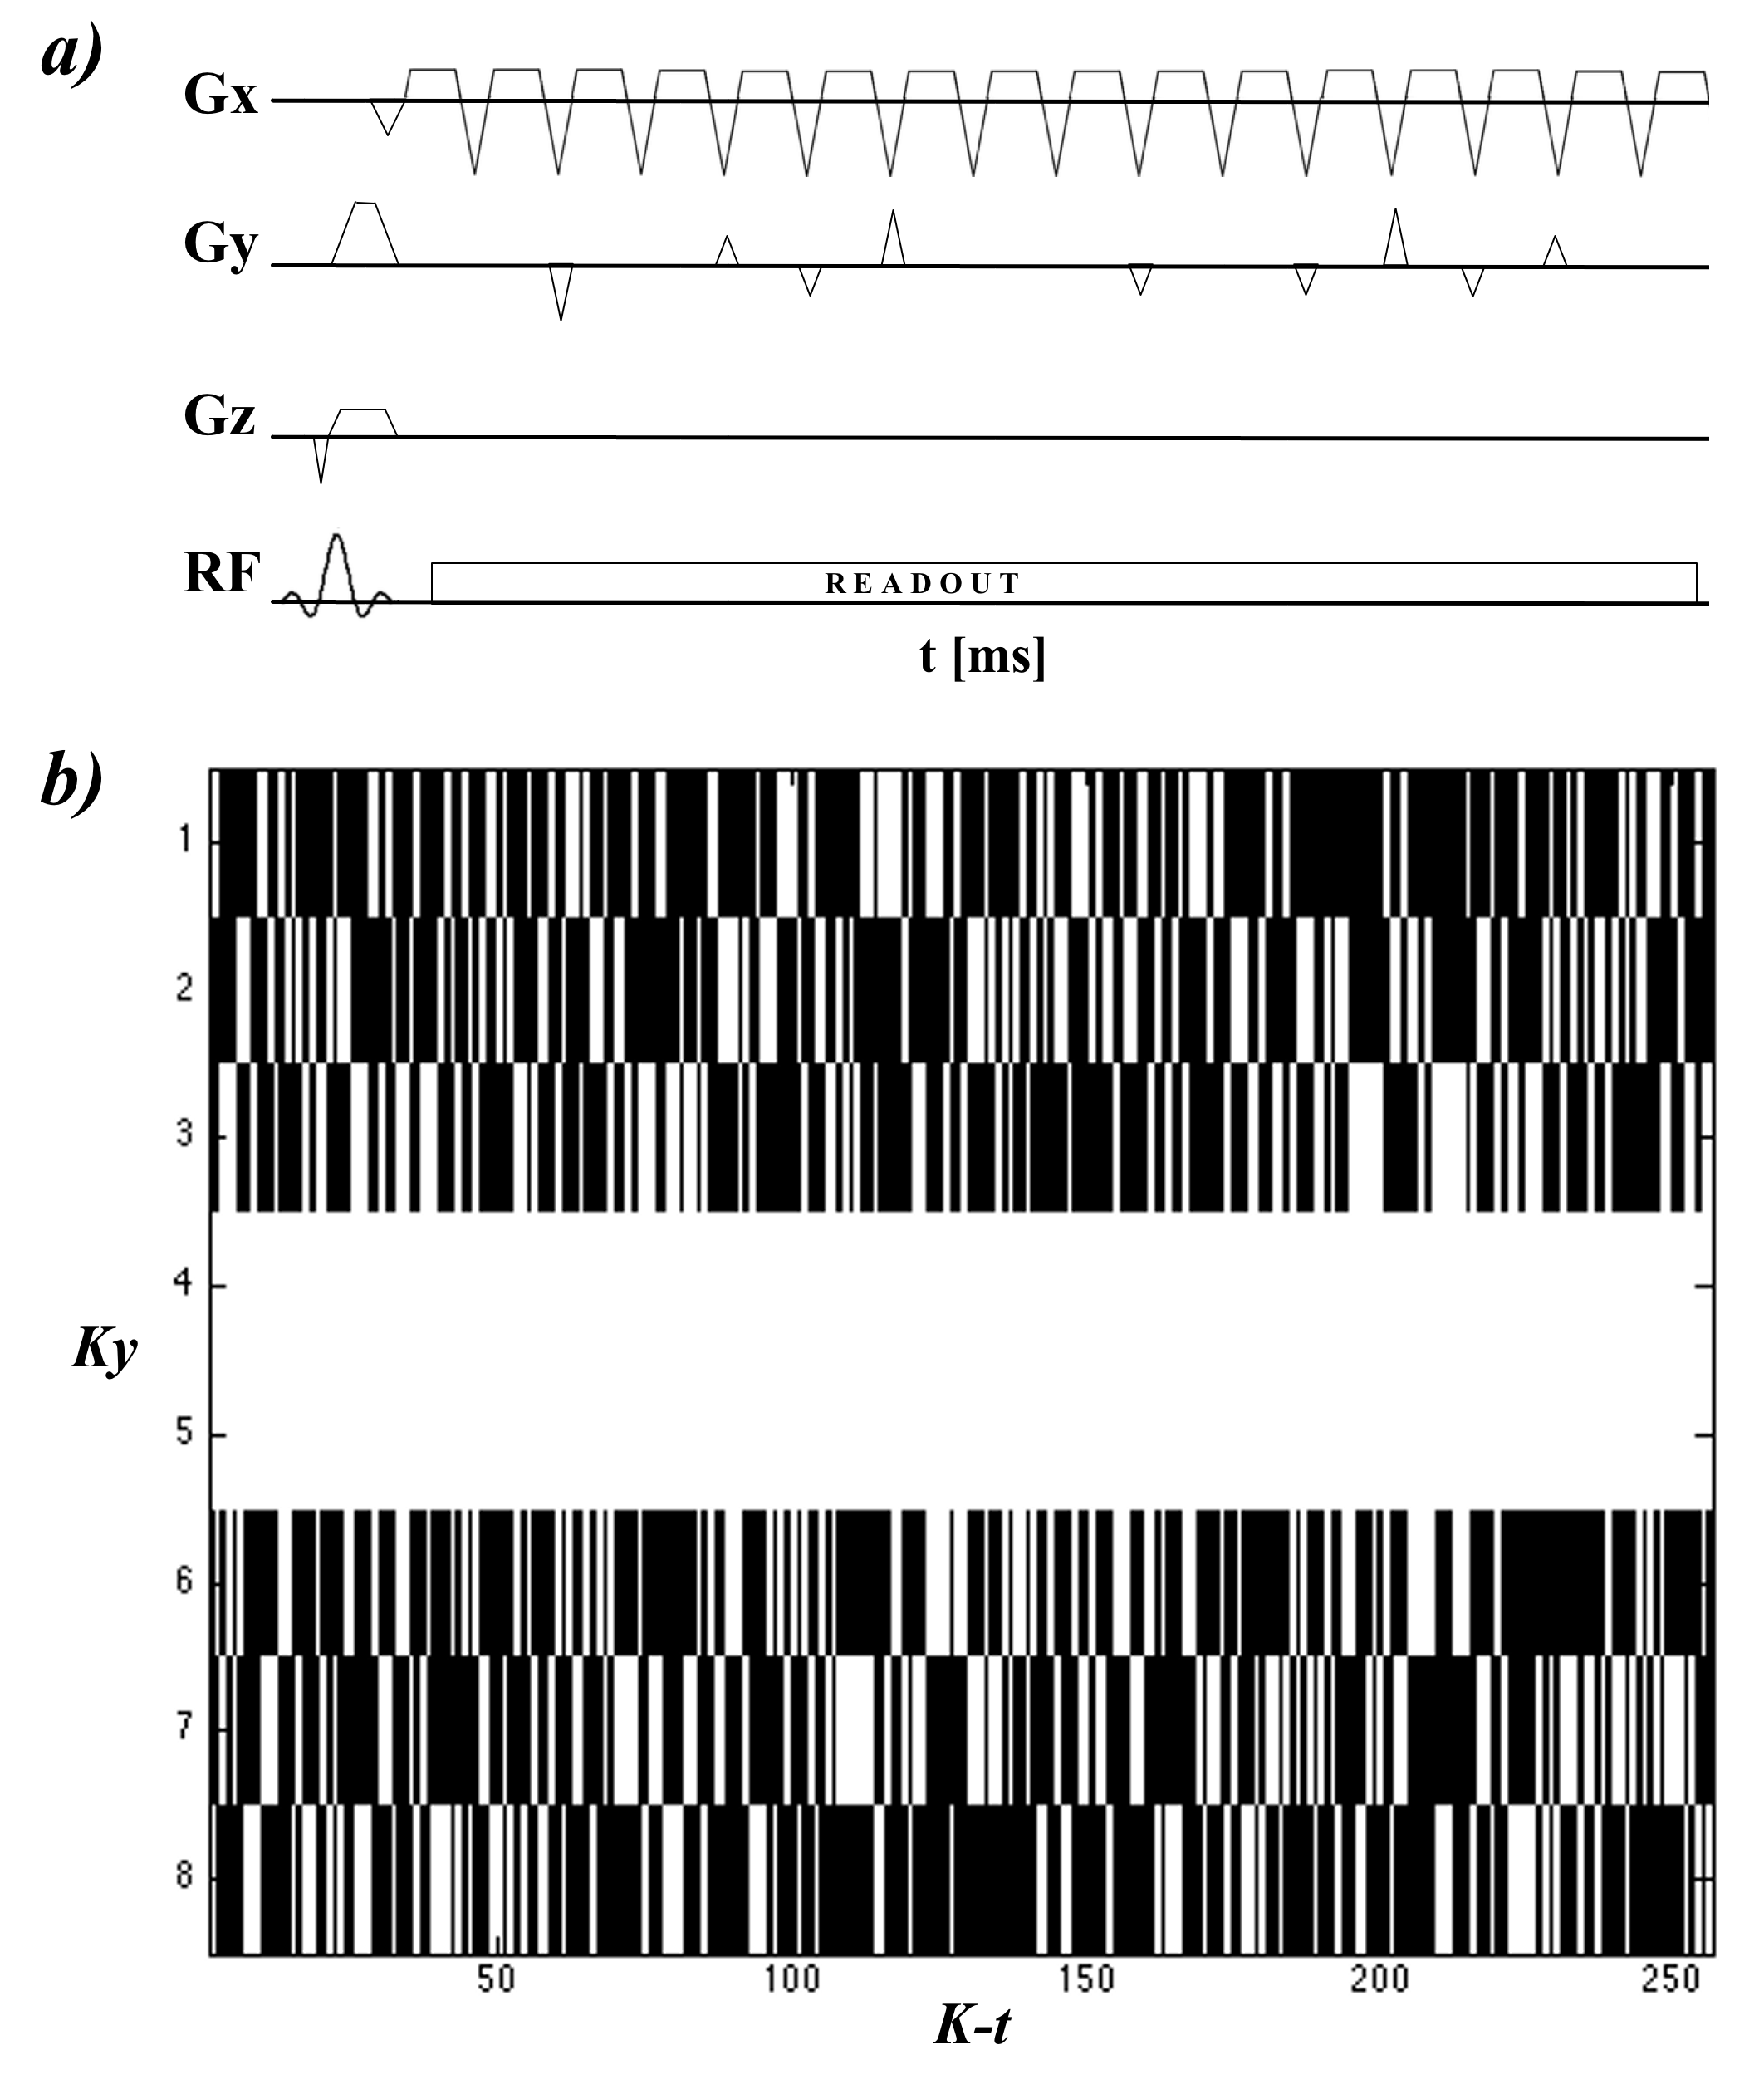
Experiments were performed using a 3T GE MR750 system (GE Healthcare, Milwaukee, WI) and a home designed/built 31P surface coil (51.720 MHz/ 7.62 cm diameter) tune/matched for calf muscles. The pulse sequence was implemented by modifying a research sequence “fidepsi” written in EPIC programing language (GE Healthcare, Milwaukee, WI). The flyback EPSI trajectory was created to achieve a 2.5x2.5 cm2 resolution over a 20 cm2 FOV (i.e. 8x8 data array), 1488 Hz spectral bandwidth and 512 spectral points, using an SNR optimized algorithm [10]. Under-sampling was implemented through the inclusion of pseudo randomly distributed gradient blips in the Ky dimension to achieve acceleration factors of 2x, 2.7x and 4x. Figure 1 shows the sequence diagram and an example of the under sampling scheme. The sequence was first tested in the calf muscles of a 42 year old healthy volunteer, the region of interest was shimmed on a T2 weighted image used as an anatomical reference. Number of averages, slice thickness, TR and flip angle were setup to 16, 4cm, 3000ms and 90° respectively. Data processing and CS reconstruction was performed in MATLAB using a modified version of the SparseMRI toolbox [11] as previously described [9]. PCr signals from reconstructed spectra were fitted using the OXSA MATLAB toolbox [12]. In order to compare results, a fully sampled dataset was also acquired using the flyback EPSI readout.Results
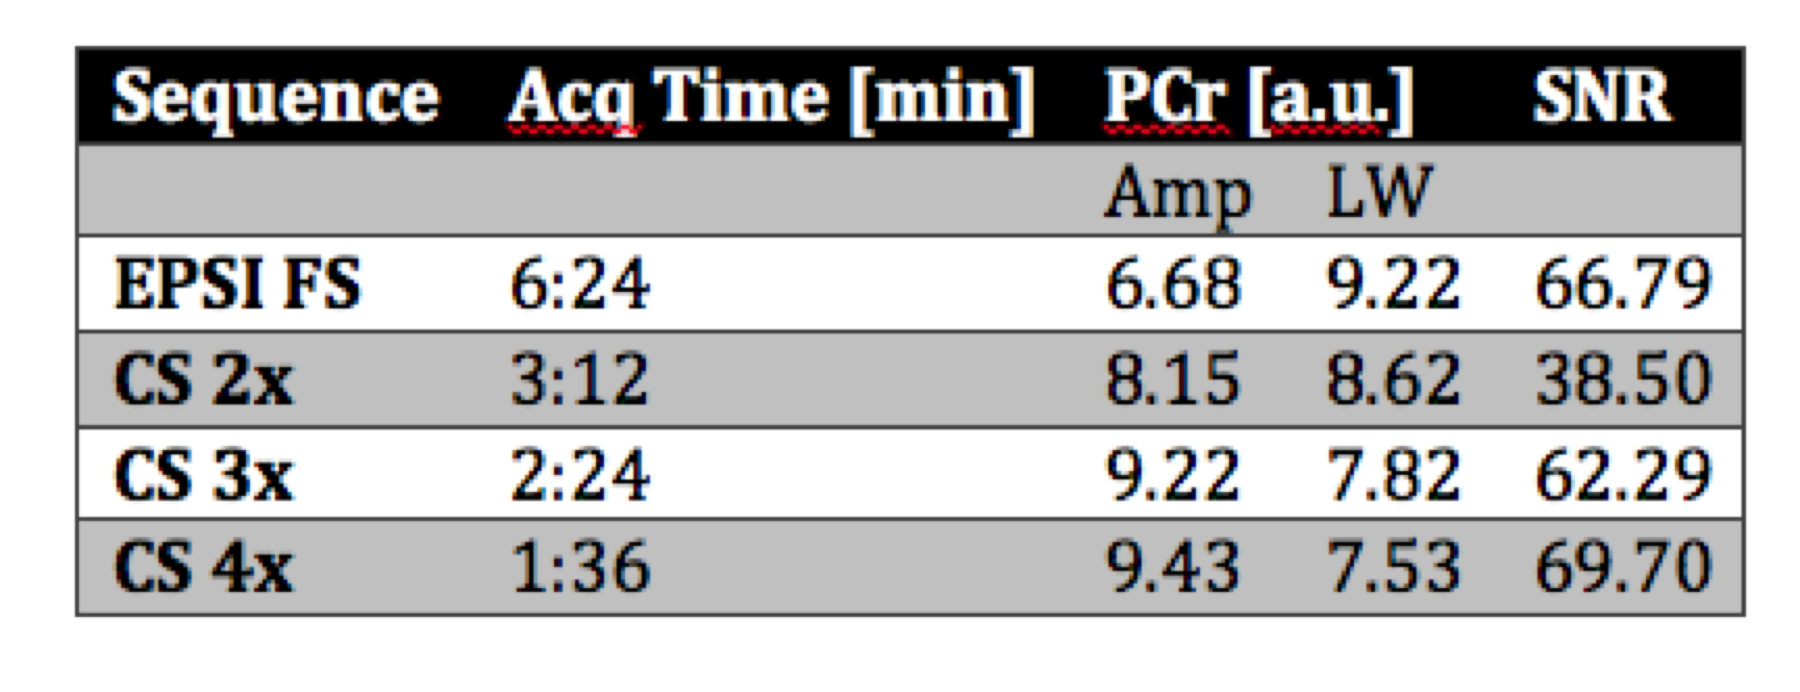
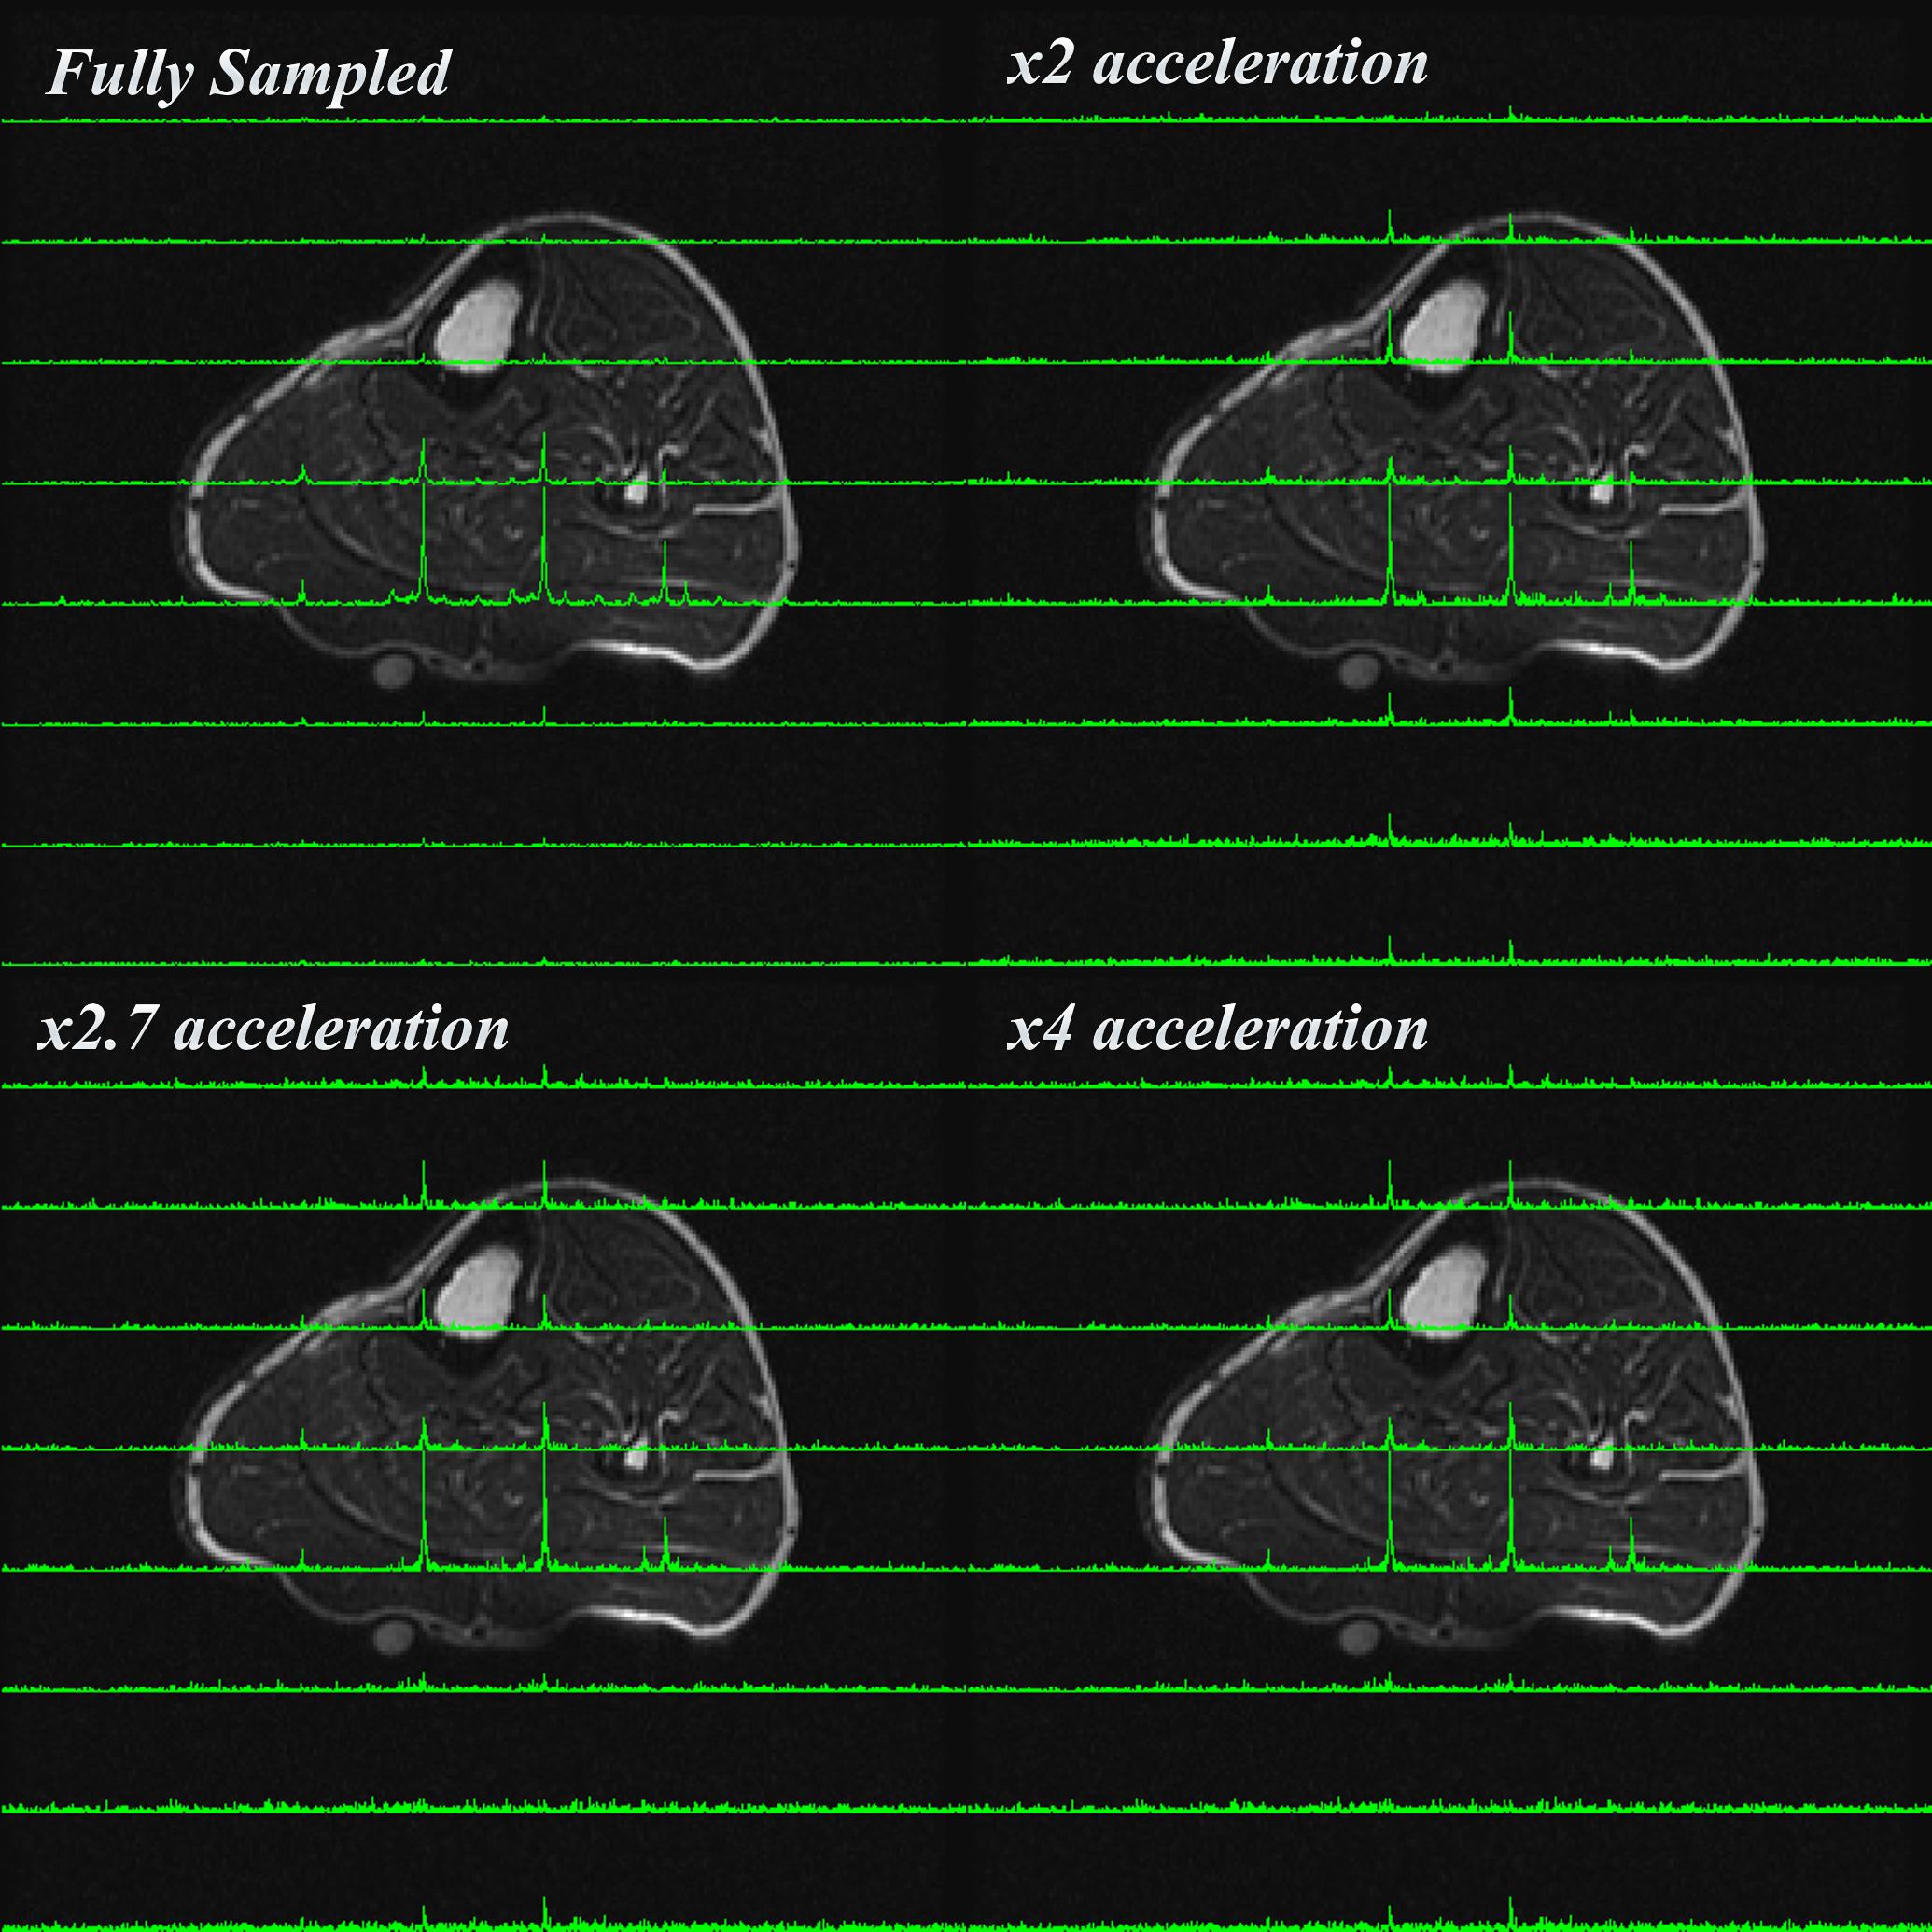
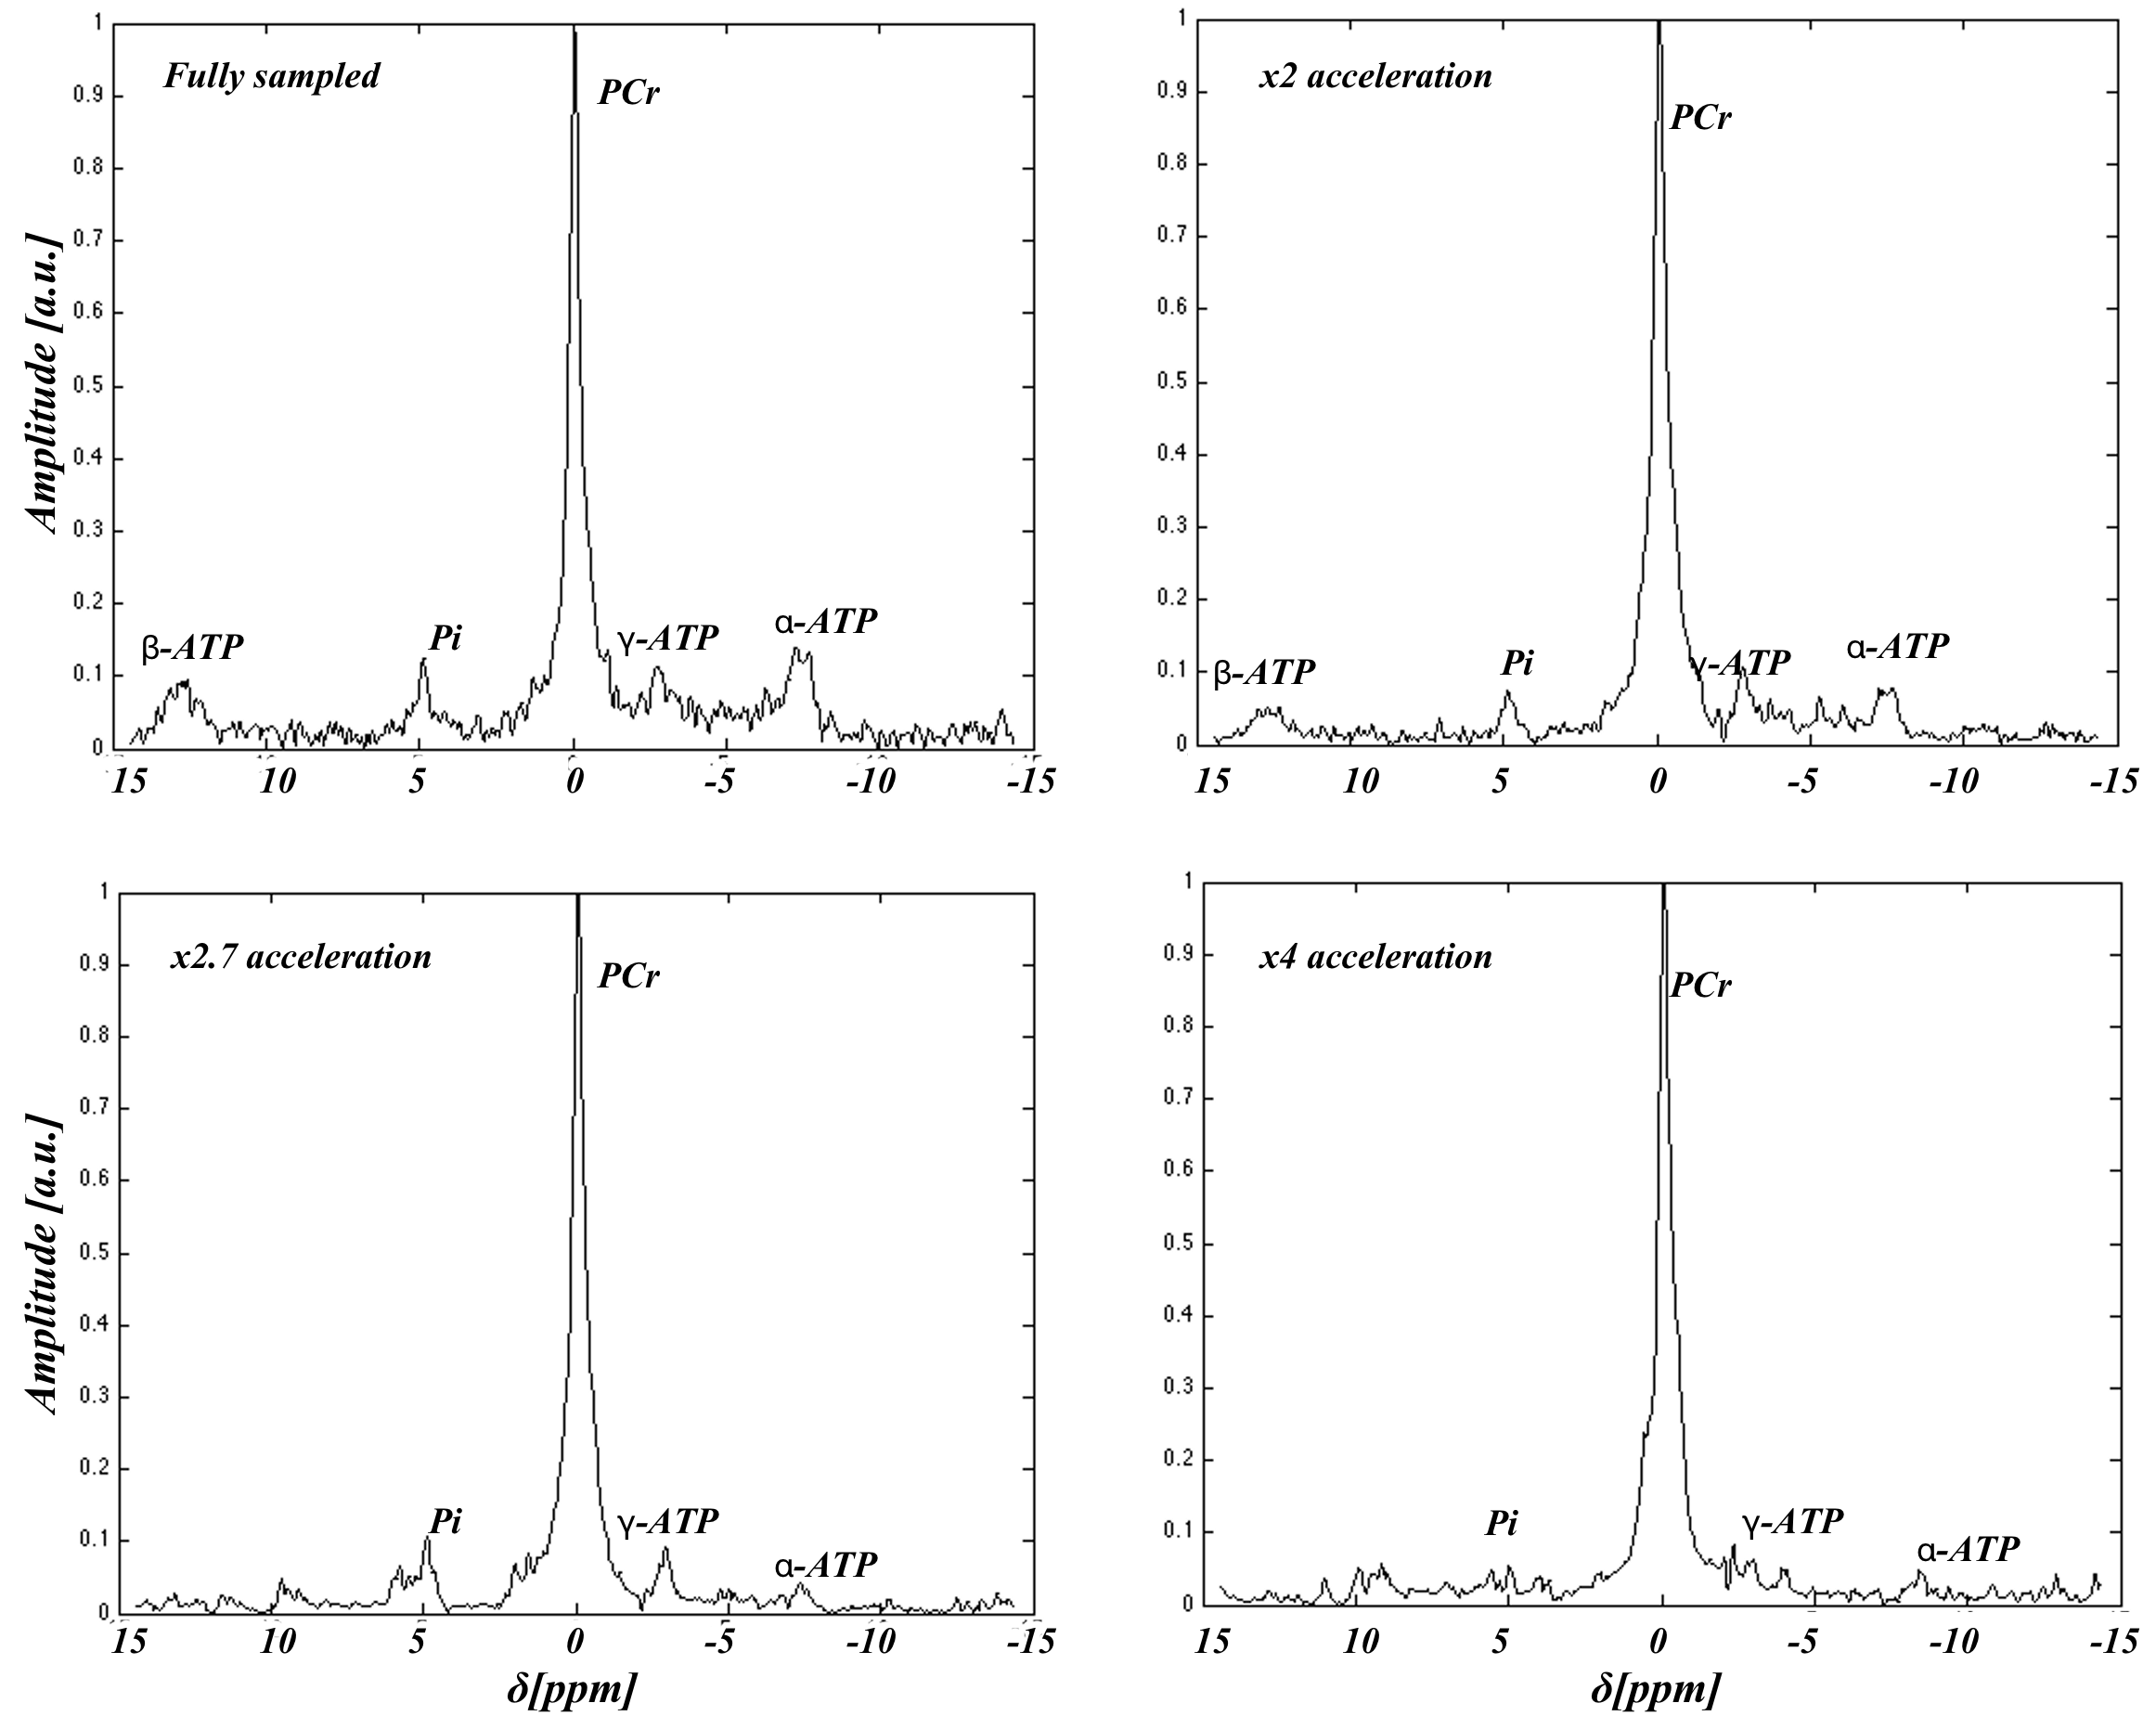
Figure 2 shows the fitted amplitude and line width for PCr, acquisition time and SNR for the fully sampled and CS implementations. Figure 3 shows a comparison of MRSI data for unaccelerated, 2x, 2.7x and 4x accelerated acquisitions whereas Figure 4 depicts an example of spectra extracted from the same position. The CS reconstructed data matched closely the fully sampled acquisition in spectral and spatial characteristics. However we observed an attenuation of the smaller metabolites signal in the CS acquired data.Discussion
Flyback EPSI and compressed sensing techniques were successfully combined and implemented on a clinical 3T MRI scanner. CS reconstruction showed an attenuation of mainly small metabolites signals compared to PCr. As expected for CS implementations, the SNR was notably increased.Conclusion
We successfully implemented a pulse sequence to acquire 31P MRSI data combining Flyback-EPSI and compressed Sensing for low acceleration factors.Acknowledgements
TO CONACYT (MEXICO) CVU:304930
TO NSERC Research Discovery Grant
References
[1] Kemp GJ,et al. Acta Physiol (Oxf) 2015;213:107–44.
[2] Harper DG, et al. eMagRes 2016;5:1257–70.
[3] Novak J, et. al. Eur J Radiol 2014;83:e106–12. [4] Srinivasa Raghavan R,et al. Proc 17th Sci Meet Int Soc Magn Reson Med 2009;4317
[5] Santos Diaz A, et al. Proc ESMRMB 2016,
[6] Hatay GH, et. al. Med Biol Eng Comput 2017;55:1303–15.
[7] Hu S, et al. Magn Reson Med 2010;63:312–21.
[8] Hu S, et al. J Magn Reson 2008;192:258–64.
[9] Santos-Diaz, et al. Proc Intl Soc Magn Reson Med 25, 2017, p. 2931.
[10] Noeske, Ralph; Shulte R. Proc. Intl. Soc. Mag. Reson. Med. 24, 2016, p. 3948.
[11] Lustig M, Donoho D, Pauly JM. Magn Reson Med 2007;58:1182–95.
[12] Purvis LAB, et al. PLoS One 2017;12:e0185356. doi:10.1371/
Figures