1305
Evaluation of different postprocessing-based B0 inhomogeneity correction methods for application in 7T FID-MRSI1High Field MR Centre, Department of Biomedical Imaging and Image-guided Therapy, Medical University of Vienna, Vienna, Austria, 2Christian Doppler Laboratory for Clinical Molecular MR Imaging, Vienna, Austria, 3Athinoula A. Martinos Center for Biomedical Imaging, Department of Radiology, Massachusetts General Hospital, Harvard Medical School, Boston, MA, United States, 4Russell H. Morgan Department of Radiology and Radiological Science, The Johns Hopkins University School of Medicine, Baltimore, MD, United States, 5M. Kirby Research Center for Functional Brain Imaging, Kennedy Krieger Institute, Baltimore, MD, United States
Synopsis
The information from B0 maps can be used to improve the spectral quality in MRSI. Two post-processing methods,
INTRODUCTION
Inhomogeneities of the main magnetic field(B0) cause degradation of spectral quality in MR spectroscopic imaging (MRSI) in terms lineshape distortion/broadening and SNR loss. These effects decrease the reliability of the spectral fitting in quantitative analyses (e.g. by LCModel). Several post-processing methods were proposed to improve the spectral quality in the MRSI, by using information obtained from B0 maps with several times higher spatial resolution than that of the corresponding MRSI dataset1,2. In this study, the performance of Overdiscrete MRSI reconstruction (odMRSI)1 and Spectral Resolution Amelioration by Deconvolution (SPREAD)2 were evaluated in i) a simulation model; ii) phantom data; and iii) high-resolution in vivo data acquired by 2D FID-MRSI with CAIPIRINHA acceleration at 7T3,4.
MATERIALS & METHODS
Both post-processing methods were integrated into the MRSI post-processing pipeline5. The simulation model contained an MRSI slice of 128x128 matrix size with a square object (i.e., 64x64 voxels in the center). A B0 map from a phantom measurement was smoothed to simulate ideal conditions. Each object voxel contained the following FID signal:
$$h_{s}=a_1\exp^{2\pi(v_1+\Delta v(\vec{r}))t}\exp^{-t/T_2}$$
with amplitude a1=1, frequency v1=1500Hz, 2048 vector size over sampling time and $$$\Delta v(\vec{r})$$$represents B0 inhomogeneities in Hz. The simulation of the acquisition was performed in k-space by cutting out the central 32x32x2048 k-space points. The B0 map acquisition was simulated by adding complex noise to the smoothed B0 map used in the simulation model.
Phantom Validation was performed on a spherical phantom containing NAA, Cr, Cho, Lac, and Gln using STEAM-MRSI: TE 20ms, TM 10ms, TR 2s, FOV 200×200mm, slice thickness 10mm, bandwidth 1200Hz, vector size 2048. Two matrix sizes, 16×16 and 32×32, were scanned. B0 maps were obtained via double echo gradient echo sequences: FOV 200×200mm,slice thickness 10mm, TEs 4.92/7.38ms, flip angle 10° and TR 15ms. Two different matrix sizes 64×64 and 128×128 were scanned.
Based on simulation and phantom results, only the odMRSI was tested in vivo. Six healthy volunteers were scanned on a 7T whole-body MR scanner (Magnetom, Siemens Healthcare, Erlangen, Germany) with a 32-channel receive coil array coil.
MRSI datasets were acquired with a 2D FID-MRSI sequence. For the first five volunteers, two different matrix sizes, 64x64 and 100x100 were acquired: FOV 220x220mm; slice thickness 8mm; TE 1.3ms; TR 450ms; flip angle 42°; vector size 2048; bandwidth 6000Hz; elliptical phase encoding; CAIPIRINHA acceleration factors, R=4 for 64x64 matrix size in 6:26min, and R=9 for 100x100 matrix size in 2:38min. For volunteer number six, six averages were acquired to compare improvements in spectral quality obtained by odMRSI against the improvement achieved by simple averaging (=gold standard).
B0 maps were obtained via the double echo gradient echo sequence with three different matrix sizes, 200x200, 300x300, 400x400.
RESULTS
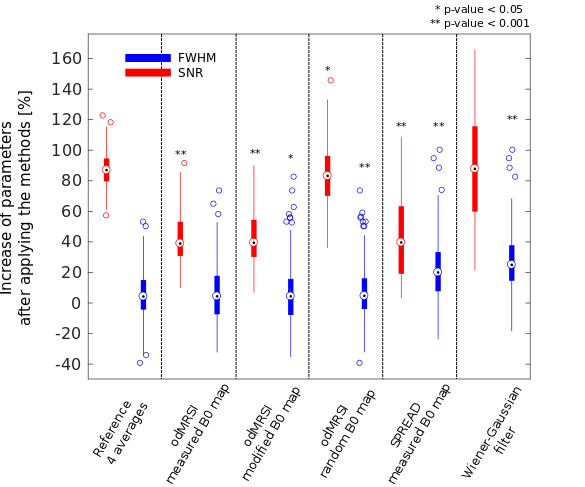
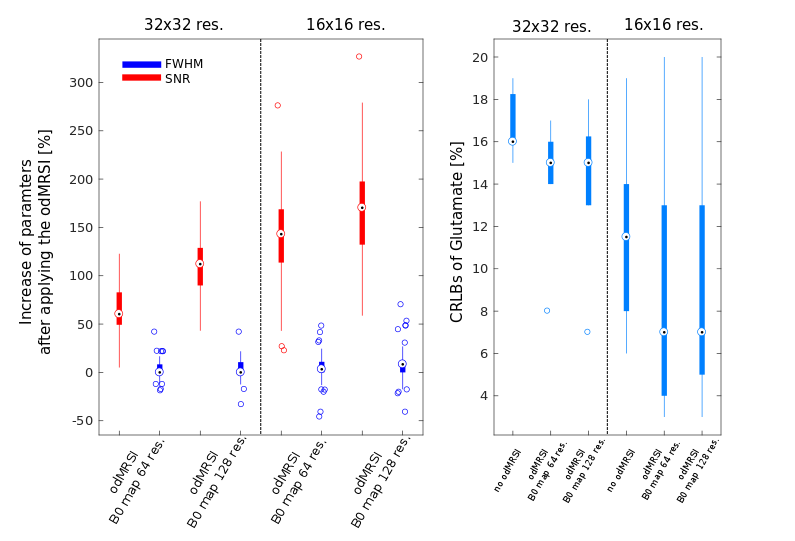
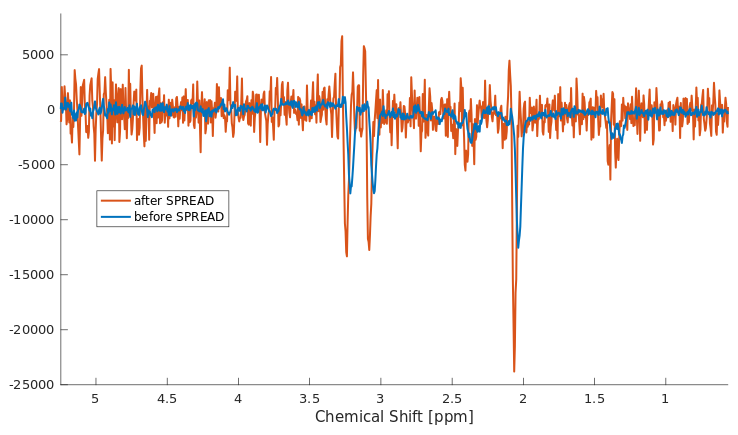
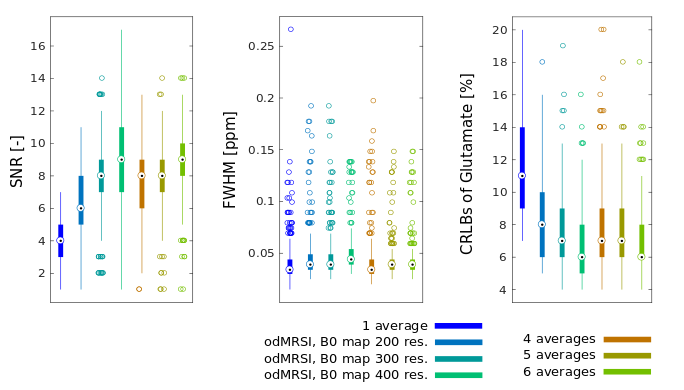
The odMRSI increases the SNR up to +150%, see Figure 1 and 2, while keeping the increase of the FWHM in the range similar to signal averaging. The increase of the SNR by SPREAD is brought by Wienner-Gaussian filter, however, the FWHM increases more than in odMRSI case. Quantitative analyses of SPREAD on the phantom data is not possible due to a poor performance of the method for the low SNR, depicted in Figure 3. The spectral quality improvement of the odMRSI using different resolution of B0 map can be matched with the signal averaging of different numbers of averages, shown in Figure 4 and 5.DISCUSSION
Based on the results from simulations, both post-processing methods, are capable to improve the spectral properties. B0 maps in the odMRSI can be replaced by random numbers and still achieved similar results as the signal averaging, which was explained as results of noise decorrelation. The phantom validation disqualified the SPREAD method in case of low SNR, as can be seen in Figure 3. The comparison of spectral quality improvement between the odMRSI and the signal averaging on in vivo data in Figure 4 suggests that applying the odMRSI with 4-times higher resolution B0 map on MRSI with a single average is equivalent to acquiring MRSI with six averages. However, such equality can be questionable based on the metabolic maps in figure 5. Visually, the 6 averages case looks superior so the improvement brought by odMRSI, which cannot be fully translated to the metabolic maps.CONCLUSION
The SPREAD was capable to improve spectral properties only in situations with high SNR, which are not present in clinical reality. The odMRSI increased spectral quality; however, it is not directly connected to the improvements seen in metabolic map quality. B0 maps used for odMRSI do not have to be acquired, but can be potentially replaced by shiftmaps, the outputs from LCModel fitting.Acknowledgements
This study was supported by the Austrian Science Fund (FWF): P30701-B27 and KLI-646 as well as the FFG Bridge Early Stage Grant #846505.References
1. Thomas Kirchner, Ariane Fillmer, and Anke Henning. “Mechanisms of SNR and line shape improvement by B0 correction in overdiscrete MRSI reconstruction”. In: Magnetic Resonance in Medicine vol. 77. issue 1 (2017), pp.44–56. ISSN: 07403194. DOI:10.1002/mrm.26118. URL : http://doi.wiley.com/10.1002/mrm.26118.
2. Zhengchao Dong and Bradley S. Peterson. “Spectral resolution amelioration by deconvolution (SPREAD) in MR spectroscopic imaging”. In: Journal of Magnetic Resonance Imaging vol. 29.issue 6 (2009), pp.1395-1405. ISSN: 10531807. DOI: 10.1002/jmri. 21784. URL: http://doi.wiley.com/10.1002/jmri.21784.
3. W. Bogner et al. “High-resolution mapping of human brain metabolites by free induction decay 1H MRSI at 7 T”. In: NMR in Biomedicine vol.25.issue 6 (2012), pp.873–882. ISSN: 09523480. DOI: 10.1002/nbm.1805. URL: http://doi.wiley.com/10.1002/nbm.1805.
4. B. Strasser et al. “(2+1)D-CAIPIRINHA accelerated MR spectroscopic imaging of the brain at 7T”. In: Magnetic Resonance in Medicine vol. 78.issue 2 (2017), pp.429–440. ISSN: 07403194. DOI: 10.1002/mrm.26386. URL: http://doi.wiley.com/10.1002/mrm.26386.
5. M. Povazan et al. “Automated routine for MRSI data processing”. In: 2nd TRANSACT Meeting—Quality Issues in Clinical MR Spectroscopy (2014), p. 52.
6. T. Laudadio et al. “Improved Lanczos Algorithms for Blackbox MRS Data Quantitation”. In: Journal of Magnetic Resonance 157.2 (2002), pp.292–297. DOI: 10.1006/jmre.2002.2593. URL: http://linkinghub.elsevier.com/retrieve/pii/S1090780702925930.
Figures