1301
Preliminary study of proton magnetic resonance spectroscopy with multi-echo-time for simultaneous quantification and T2 measurement of glutamate.1Department of Biomedical Engineering, Research Institute of Biomedical Engineering, College of Medicine, The Catholic University of Korea, Seoul, Republic of Korea, 2Asan Institute for Life Sciences, Asan Medical Center, Seoul, Republic of Korea
Synopsis
This study presents our preliminary concept of multi-echo-time (TE) in vivo proton magnetic resonance spectroscopy (1H MRS) for the simultaneous quantification and T2 measurement of the brain metabolites, particularly glutamate. The feasibility of the proposed method was verified by comparing metabolite concentrations to that of conventional short-TE, and T2 relaxation times to that of conventional T2 measurement. Although TE points must be further optimized, the multi-TE in vivo 1H MRS could be used to simultaneously investigate the changes of brain metabolism and microenvironments in a scan time comparable to that of the conventional method.
Introduction
In vivo proton magnetic resonance spectroscopy (1H MRS) has been widely used for the non-invasive measurement and assessment of disease-related changes in major brain metabolite systems. In addition, in vivo 1H MRS can be used to investigate changes in microenvironments of the brain via T2 relaxation measurement. As a neurotransmitter and biomarker of brain diseases, the glutamate (Glu) system and its role in various brain disorders have been investigated in previous studies. High-field and short-echo-time (TE) 1H MRS might enhance the quality of quantification by minimizing the effects of T2 relaxation and J-coupling by utilizing higher signal-to-noise-ratios (SNRs). However, short-TE in vivo 1H MRS can measure only concentrations and conventional T2 measurement require long scan times. This study presents our preliminary concept of multi-TE in vivo 1H MRS for the simultaneous quantification and T2 measurement of the brain metabolites, particularly Glu. To verify the feasibility of the proposed method, metabolite concentrations obtained via conventional short-TE and multi-TE in vivo 1H MRS were compared. In addition, T2 relaxation times obtained via conventional T2 measurement and multi-TE in vivo 1H MRS were compared.Materials and Methods
Localized MRI and in vivo 1H MRS scans were performed on healthy male Wistar rats (n = 5) using Bruker 7T PharmaScan system. To localize the in vivo 1H MRS voxel (1.5 × 5 × 3 mm³) in the prefrontal cortex region, multislice T2-weighted images were obtained using a T2 turbo RARE sequence with repetition time (TR)/TE, 4000/11 ms; RARE factor, 8; field of view, 30 × 30 mm²; matrix size, 256 × 256; slice thicknesses, 1.5/1 mm (axial/coronal)). For the acquisition of conventional short-TE in vivo 1H MRS, we used point-resolved spectroscopy (PRESS) with the following parameters: TR, 5000 ms; TE, 16.3 ms; spectral bandwidth, 5000 Hz; averages, 192. For T2 measurement, we used PRESS with the following TE points and parameters: TR, 5000 ms; TEs, 20/40/60/80/110/130/150/170/200/300 ms; spectral bandwidth, 5000 Hz; averages, 48 × 2. For the proposed method, we used PRESS with the following TE points and parameters: TR, 5000 ms; TEs, 16.3/20/24/28/105/110/115/120 ms; spectral bandwidth, 5000 Hz; averages, 64 × 2. The TE points for the proposed method were selected with respect to the J-evolution patterns of Glu, the target of this study. The toal scan time to acquire the MRI/MRS for one animal was 4 h. Linear combination of model spectra (LCModel) with in-house basis sets, which were simulated using VeSPA software at each TE values, was used to process the obtained spectra. Mono-exponential curve-fitting of the apparent concentrations of metabolites at each TE point was performed using the MATLAB software to estimate the T2 relaxation times of the metabolites.Results
Figure 1 illustrates representative MRI scans of the rat brain with the in vivo 1H MRS voxel. Figure 2 illustrates representative in vivo 1H MRS spectra obtained using minimal TE (16.3 ms) with raw data (black), LCModel-fitted data (red), baseline (black), and the residual errors (top) of (a) conventional short-TE and (b) multi-TE method. Representative in vivo 1H MRS spectra used by the T2 measurements and multi-TE method to estimate the T2 relaxation time of the metabolites are shown in Figure 3. Table 1 lists the mean concentrations and Cramér-Rao lower bound (CRLB) values of the major metabolites obtained in the PFC of the animals by the conventional short-TE and multi-TE method. Table 2 lists mean T2 relaxation times and CRLB values of the major metabolites with respect to the TE points obtained by the T2 measurements and multi-TE method. The total scan times of the proposed method were less than twice those of the conventional short-TE method, and shorter than those of the T2 measurement method.Discussion and Conclusion
In this study, we present the preliminary concept of the multi-TE in vivo 1H MRS method for the simultaneous quantification and T2 measurements of metabolites and assessed the feasibility of the proposed method. Although the proposed method had limited SNRs and higher noise levels compared to those of the conventional method, its concentrations and CRLB values of the major metabolites were comparable to those of the conventional method. The TE points of the proposed method were optimized to the J-evolution patterns of Glu, and the estimated T2 relaxation times of Glu, N-acetylaspartate, and total creatine of the two methods were comparable. Thus, although TE points and TR values must be further optimized, the multi-TE in vivo 1H MRS acquisition method could be used to simultaneously investigate the changes of brain metabolism and microenvironments in a scan time comparable to that of the conventional method.Acknowledgements
This study was supported by grants (2012-007883) from the Mid-career Researcher Program though the National Research Foundation (NRF) funded by the Ministry of Science, ICT & Future Planning (MSP) of Korea.References
No reference found.Figures
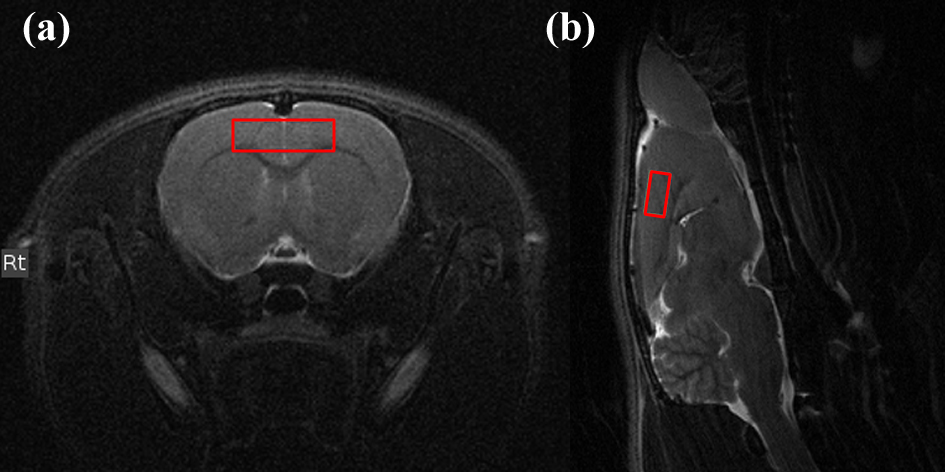
Representative (a-b) axial/sagittal T2-weighted multislice MRI scans with the VOI of in vivo 1H MRS, that were obtained in the rat brain with T2 Turbo RARE sequence and the following parameters: TR, 4,000 ms; TE, 11 ms; effective TE, 1 ms; RARE factor, 8; averages, 2; FOV, 30 × 30 mm²; matrix size, 256 × 256; slice thicknesses, 1.5 mm (axial) and 1 mm (sagittal). Rapid acquisition with relaxation enhancement, RARE; repetition time, TR; echo time, TE; field of view, FOV; volume of interest, VOI, proton magnetic resonance spectroscopy, in vivo 1H MRS.
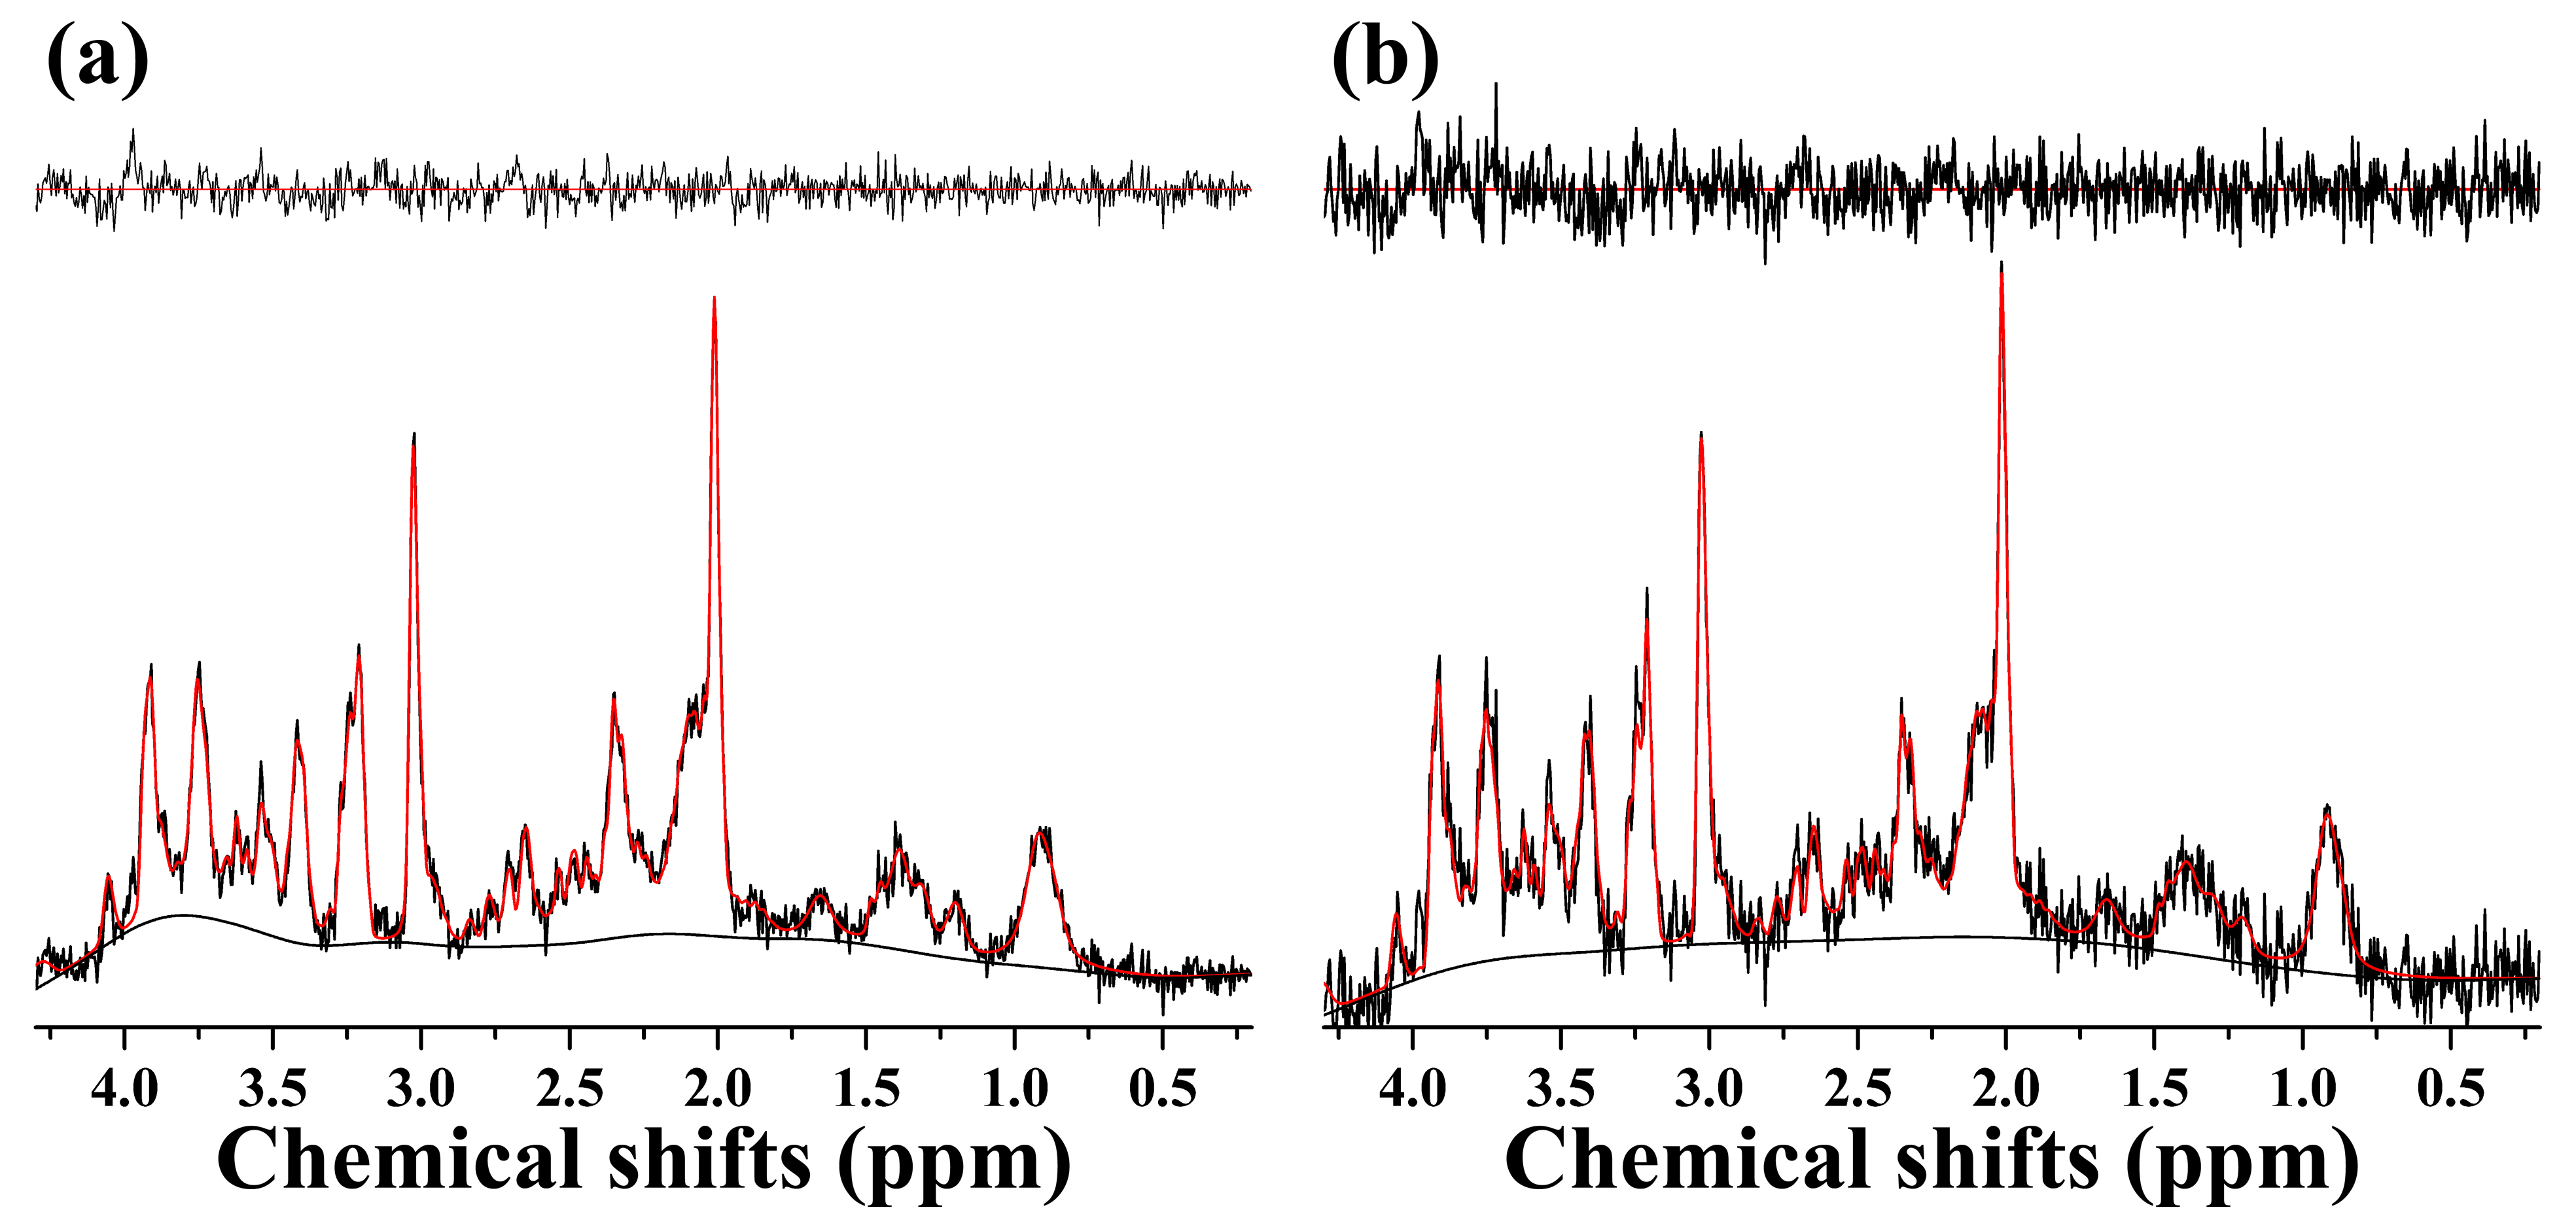
Representative in vivo 1H MRS spectra of the (a) conventional short-TE and (b) multi-TE method showing original spectra (black), LCModel-fitted spectra (red), and residual errors (topside) which were obtained in the rat brain using a PRESS sequence and the following scan parameters: TR, 5000 ms; TE, 8.7944 + 7.507 ms (TE1+TE2); number of averages, 256; complex data points, 2,048; spectral bandwidth, 5,000 Hz. Linear Combination of Model, LCModel; point-resolved spectroscopy, PRESS, repetition time, TR; echo time, TE.
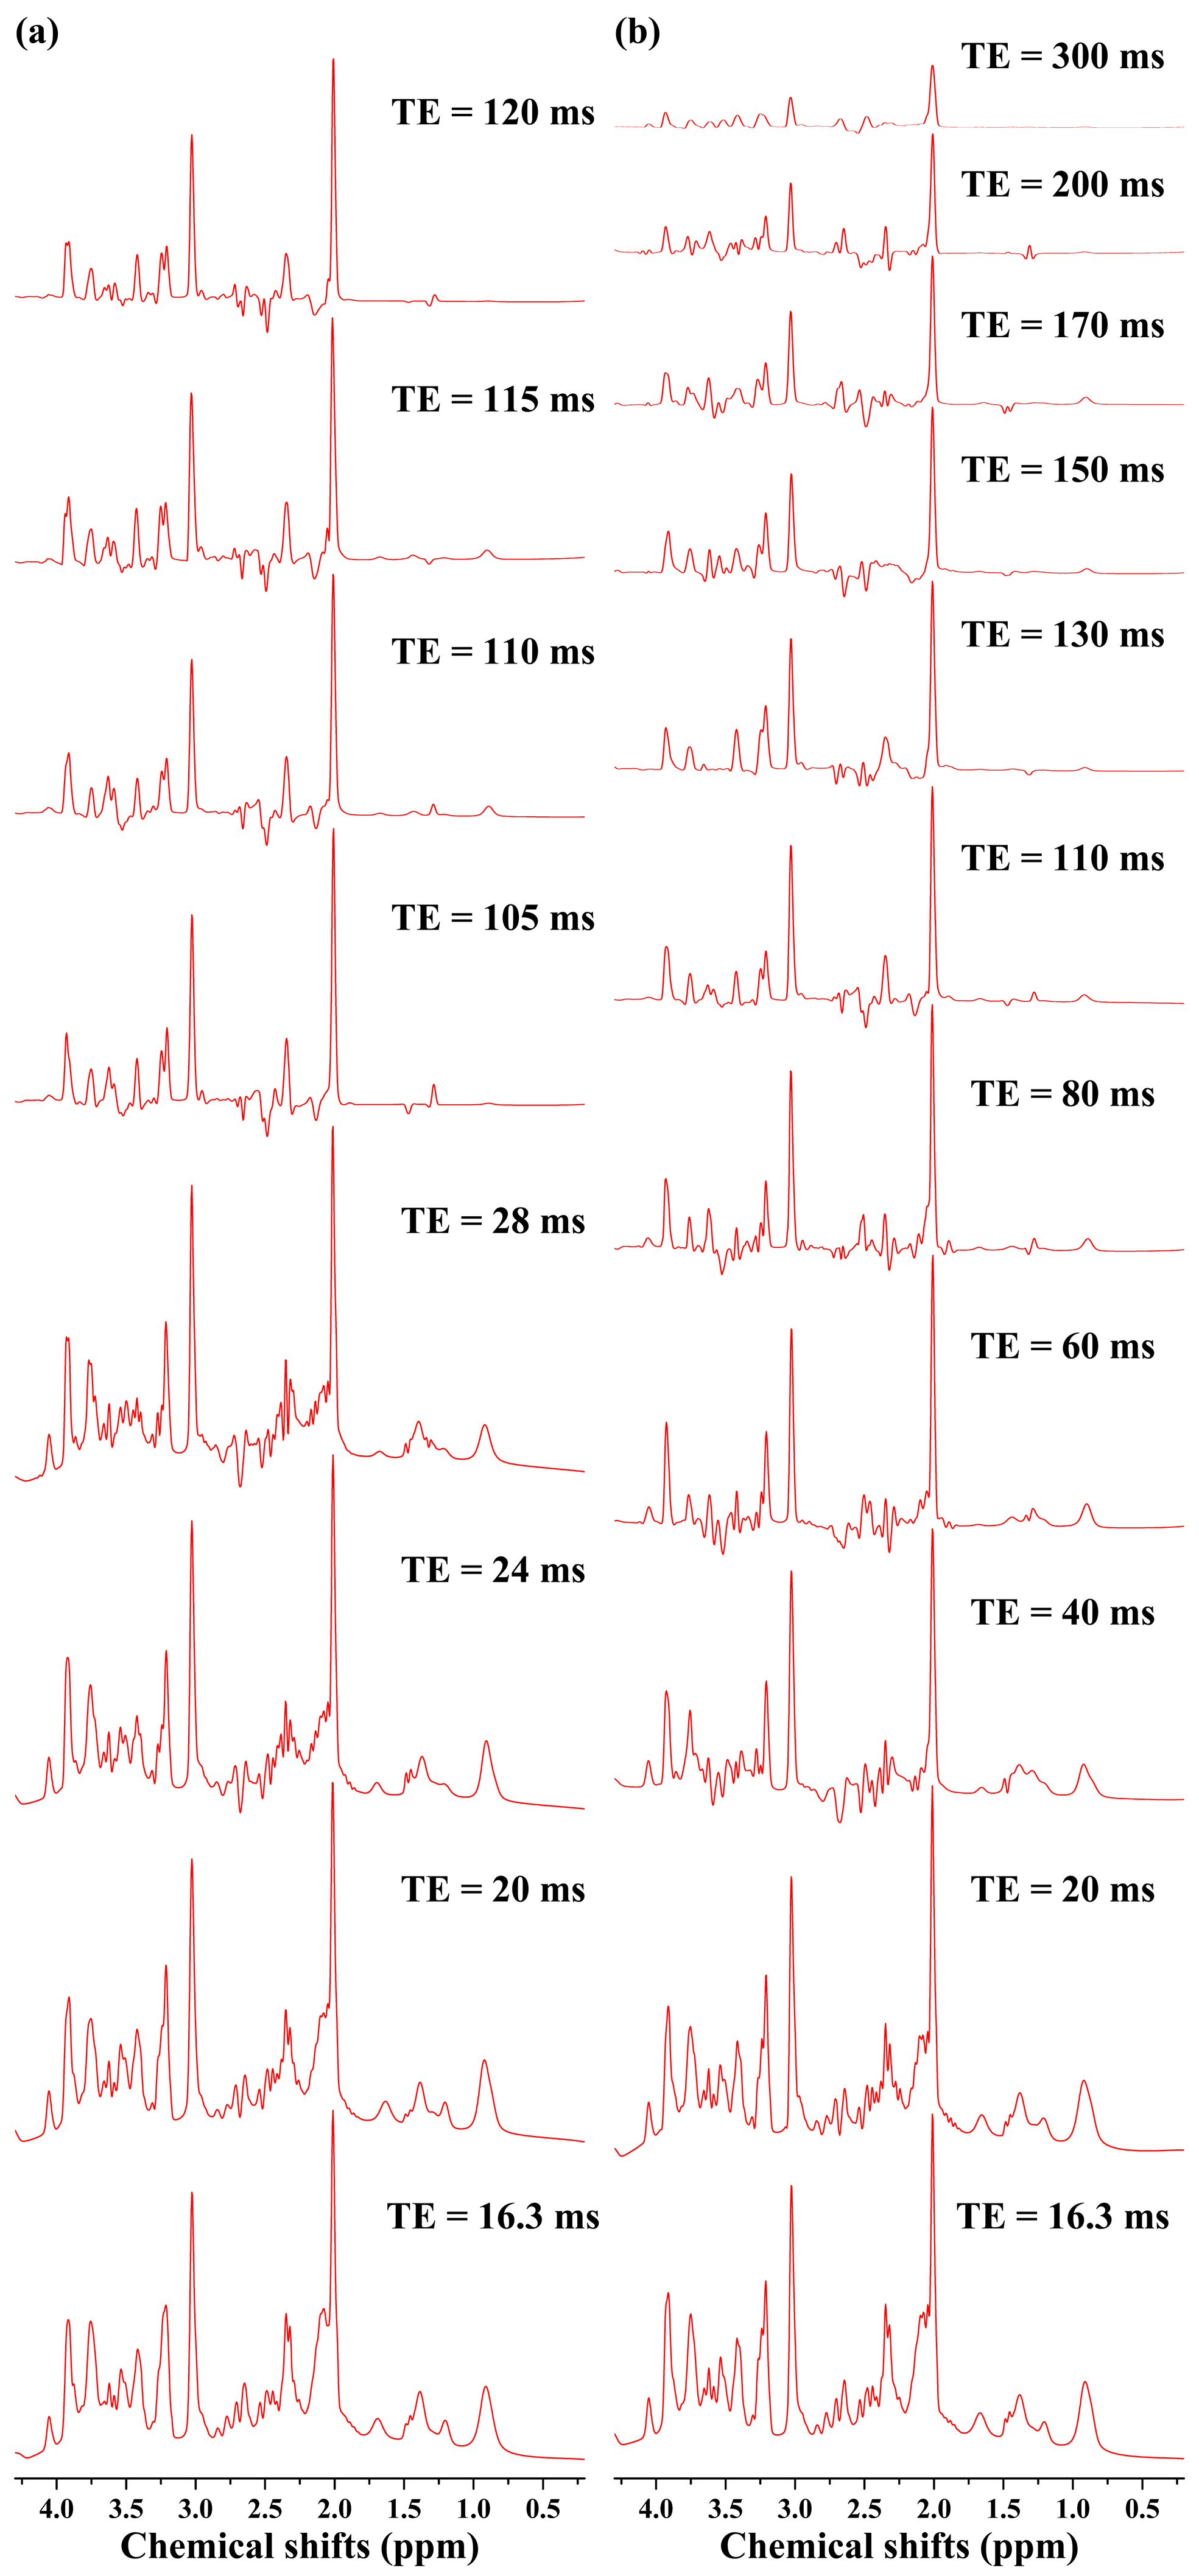
Representative in vivo 1H MRS spectra of the (a) multi-TE method and (b) T2 measurement showing LCModel-fitted spectra (red), at each TE point which were obtained in the rat brain using a PRESS sequence and the following scan parameters: TR, 5000 ms; number of averages, 256; complex data points, 2,048; spectral bandwidth, 5,000 Hz; (a) TE, 16.3/20/24/28/105/110/115/120 ms; (b) TE, 16.3/20/40/60/80/110/130/150/170/200/300 ms. Linear Combination of Model, LCModel; point-resolved spectroscopy, PRESS, repetition time, TR; echo time, TE.
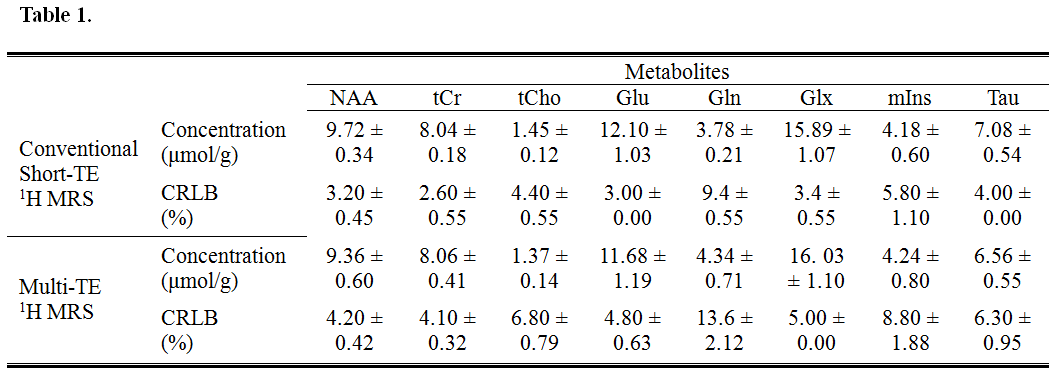
The mean concentrations and CRLB values of the major metabolites obtained in the PFC of the animals by the conventional short-TE and multi-TE H 1MRS.
Abbreviations: CRLB = Cramér-Rao lower bound; PFC= prefrontal cortex; NAA = N-acetylaspartate; tCr = total creatine; tCho = total choline; Glu = glutamate; Gln = glutamine; Glx = glutamate-complex; mIns = myo-inositol; Tau = taurine; 1H MRS = proton magnetic resonance spectroscopy.
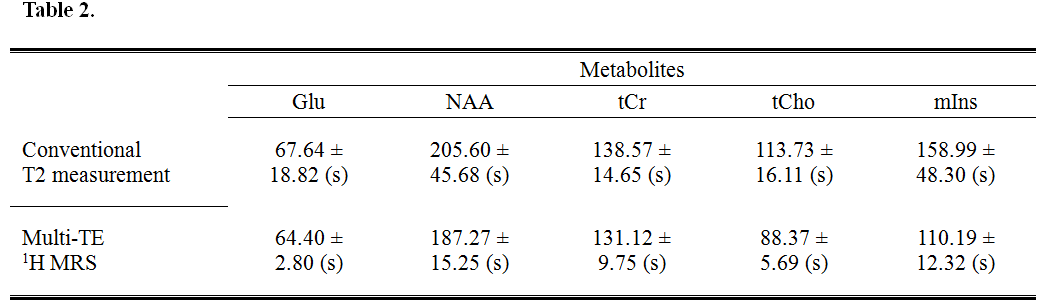
The mean and SD value of the T2 relaxation times of Glu, NAA, tCr, tCho, and mIns obtained by the conventional T2 measurement and multi-TE 1H MRS.
Abbreviations: SD= standard deviation; Glu = glutamate; NAA = N-acetylaspartate; tCr = total creatine; tCho = total choline; mIns = myo-inositol; 1H MRS = proton magnetic resonance spectroscopy.