1300
Reproducibility of the measurement of hepatic lipid composition with 1H MRS at 3T1Department of Radiology, NUTRIM School for Nutrition and Translational Research in Metabolism, Maastricht University Medical Center, Maastricht, Netherlands, 2Department of Human Biology and Movement Sciences, NUTRIM School for Nutrition and Translational Research in Metabolism, Maastricht University Medical Center, Maastricht, Netherlands
Synopsis
The total intrahepatic lipid (IHL) content can reliably be determined with 1H-MRS, but measuring lipid composition (saturated, mono- and poly-unsaturated fatty acids) is very challenging. At 3T the allylic peak is contaminated with the alpha-carbonyl methylene resonance, which hampers accurate measure of lipid composition. Recently, we developed a new approach to determine the lipid composition using prior knowledge to correct the signal intensity for alpha carbonyl group using methyl resonance. Here, we determined the in vivo reproducibility of our approach and robust quantification of lipid composition in a group of subjects with a wide range of total liver fat content.
Introduction:
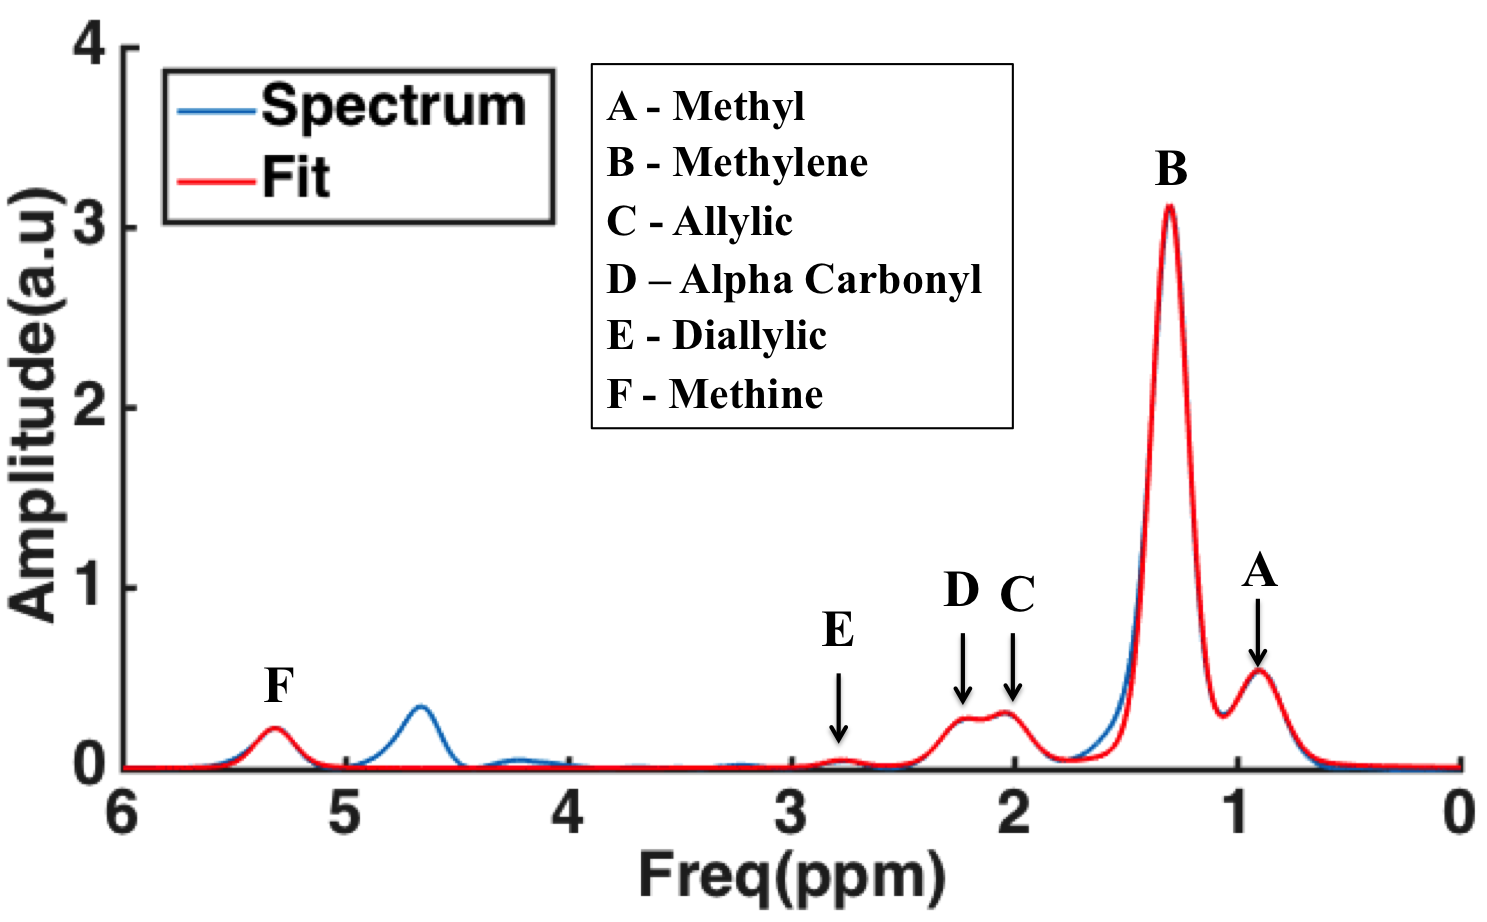
Proton magnetic resonance spectroscopy (1H-MRS) has been widely used to determine the total intrahepatic lipid (IHL) content by quantifying the lipid methylene resonance at 1.3 ppm1,2. Next to determining the total IHL content, it is also important to characterize the lipid composition, especially the saturated, mono- and poly-unsaturated fatty acids (SFA, MUFA and PUFA respectively), as they may have distinct effects on insulin sensitivity3,4. Separate quantification of the allylic (2.02 ppm) and diallylic (2.75 ppm) peaks allows estimating the MUFA and PUFA content5, but at 3T the allylic resonance is highly contaminated with the alpha carbonyl group (at 2.20 ppm). Recently, we tackled this problem by using the prior knowledge that the methyl group (at 0.90 ppm) as well as the alpha carbonyl group only occurs once in every fatty acid molecule. Therefore, the signal intensity of the methyl peak can be subtracted from the sum of the signal intensities at 2.20 and 2.02 ppm to separately quantify the allylic resonance6. Here, we demonstrate the in vivo reproducibility of this new approach in seven healthy subjects with a wide range of total liver fat content.
Materials and Methods:
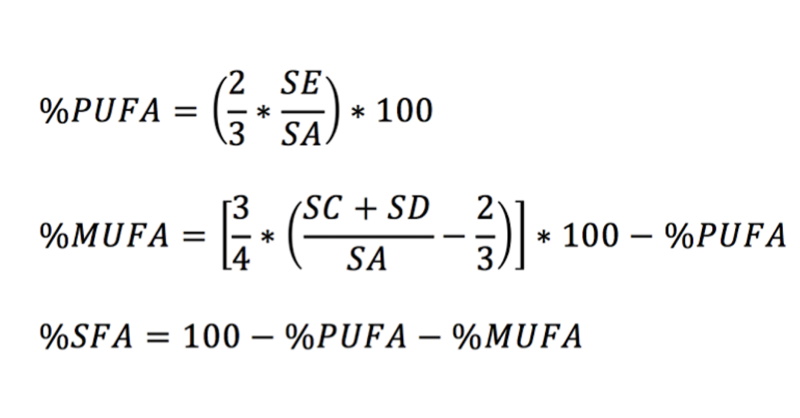
All experiments were performed on a 3T MR system (Achieva 3T-X Philips Healthcare, Best, Netherlands) by using a 32-channel sense cardiac/torso coil (Philips Healthcare, Best, Netherlands). In vivo hepatic lipid spectra were acquired using STEAM (TR/TE=4500/20 ms, NSA=128, Voxel=30X30X30 mm, datapoints=2048) with VAPOR water suppression7 from seven healthy (4 male, 3 female) volunteers. A long TR 4500 ms was chosen to let the subjects breath in a comfortable manner, in the rhythm of the measurement (acquisition at end expiration). All obtained lipid spectra were post-processed in a home-written MATLAB script in which all spectra are corrected for phase and baseline and the lipid resonances are fitted. The relevant lipid resonances, as fitted with the MATLAB script, are shown in figure 1. Lipid composition was calculated after T2 correction (literature values) using the formulas as shown in figure 2. In order to determine the reproducibility, all in vivo measurements were repeated after repositioning of the subjects in MR scanner. The average coefficient of variation (CV) for all seven subjects was calculated for the lipid composition and total lipid content as a measure to determine the reproducibility between two consecutive measurements.
Results and Discussion:
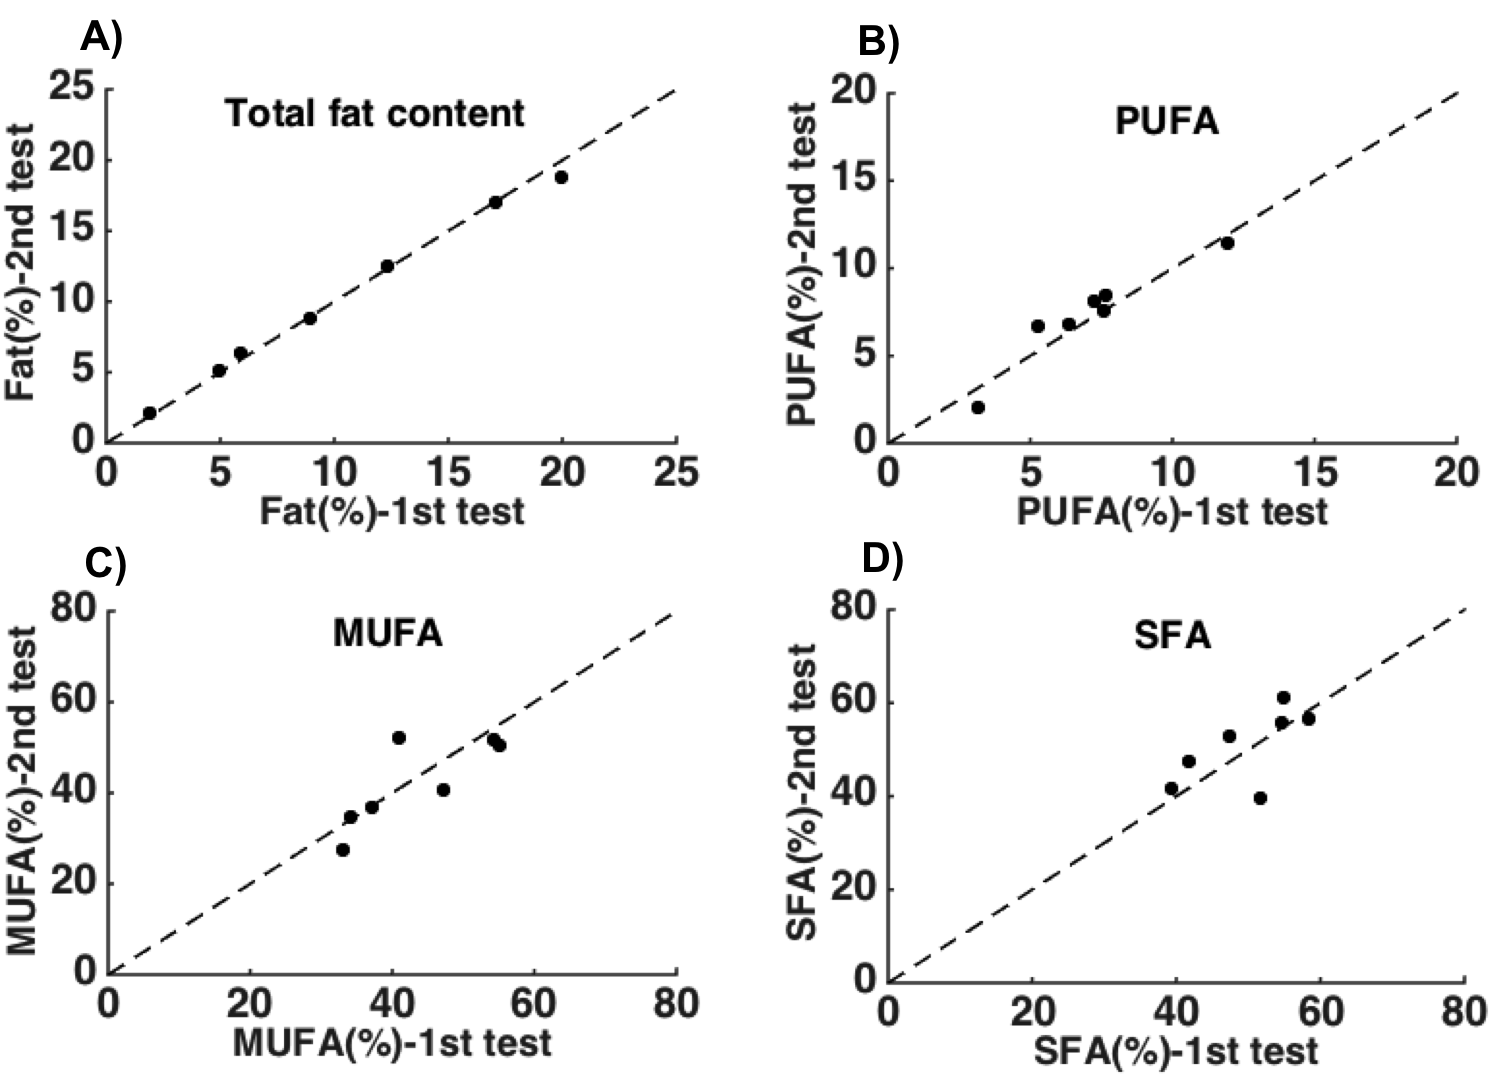
The IHL content for the seven subjects ranged from 2 to 18%. The CV (±SEM) for the measurement of total IHL was 2±1%. Furthermore the CV for SFA, MUFA and PUFA was found to be 7±2%; 6±2%; and 11± 4%, respectively. The low CV for total lipid content and the hepatic lipid composition indicates that the two repeated measurements are in close agreement (figure 3).Conclusion:
We showed a high reproducibility for determining the hepatic lipid composition in vivo with our newly developed approach. This approach can now be used to investigate the relation between lipid composition in the liver and disturbances in hepatic lipid metabolism.Acknowledgements
This work was conducted within the Health-Holland framework and financially supported by Unilever Research Vlaardingen and Health-Holland.References
1. Seppälä-Lindroos A, Vehkavaara S, Hakkinen AM, et al, Fat accumulation in the liver is associated with defects in insulin suppression of glucose production and serum free fatty acids independent of obesity in normal men. J Clin Endocrinol Metab. 2002; 87(7):3023-8
2. Miriam A. Bredella, Reza Hosseini Ghomi, Bijoy J. Thomas, et al, Breath-hold 1H-MR spectroscopy for intrahepatic lipid quantification at 3 Tesla. J comput Assist Tomogr. 2010; 34(3):372-376
3.Fuehrlein BS, Rutenberg MS, Silver JN, et al, Differential metabolic effects of saturated versus polyunsaturated fats in ketogenic diets. J Clin Endocrinol Metab. 2004;89:1641-1645
4.Lee JS, Pinnamaneni SK, Eo SJ, et al, Saturated, but not n-6 polyunsaturated, fatty acids induce insulin resistance: role of intramuscular accumulation of lipid metabolites. J Appl Physiol(1985).2006;100:1467-1474
5. Lindeboom L and De Graff RA, Measurement of Lipid Composition in Human Skeletal Muscle and Adipose Tissue With 1H-MRS Homonuclear Spectral Editing. Magn Reson Med. 2017; (ahead of print)
6. Veeraiah P, Roumans K.H.M, Wildberger J.E, et al, A Novel Approach to Determine the Hepatic Lipid Composition with 1H MRS. ESMRMB 2017; e-poster No:152
7. Tkac I, starcuk Z, Choi IY, et al, In vivo 1H NMR spectroscopy of rat brain at 1 ms echo time. Magn Reson Med 1999; 41:649-656
Figures