1296
In vivo detection of NAD+ in human calf muscle at 7T using 28-channel knee volume coil1Department of Radiology, University of Pennsylvania, Philadelphia, PA, United States
Synopsis
Nicotinamide adenine dinucleotide (NAD+) is a ubiquitous molecule present in all cells and tissues of the body with an important role in the redox reactions and metabolism. Small changes in NAD+ levels may lead to oxidative stress and may be a cause for various disorders. NAD+ is usually be detected in vivo by 31P NMR spectroscopy. Recently, NAD+ measurement with 1H MRS in the human brain was demonstrated. In the present study, we show for the first time, in vivo single voxel localized 1H MRS detection of NAD+ from the human calf muscle at 7T.
Introduction
Nicotinamide adenine dinucleotide (NAD+) plays a very important role in the cellular metabolism as a coenzyme for electron transfer enzymes. Additionally, several cellular reduction-oxidation reactions have the involvement of NAD+/NADH1,2. In vivo monitoring of NAD+ levels can be used to study the oxidative stress levels related to various pathological conditions. Currently, the in vivo detection of NAD species (NAD+/NADH) is performed via 31P MR spectroscopy. However, 31P MRS is limited by lower spectral resolution making it difficult to resolve the oxidized and reduced forms of NAD species3. Recently, a study has shown the feasibility of detection of NAD+ in the brain by 1H MR spectroscopy at 7T using a surface coil4,5,6. In the current study, we present a method for single voxel localized 1H MRS detection of NAD+ from the human calf muscle at 7T using a 28-channel knee volume coil. The initial results are presented.Methods
The 1H MRS pulse sequence uses outer volume suppression (OVS) blocks followed by a spectrally selective self-refocused E-BURP1 90° pulse (7ms long and bandwidth 2 ppm or 600 Hz at 7T) and 3 narrow band (800 Hz) spatially selective refocusing 180° Shinnar-Le Roux pulses for localization6. The spectrally selective and the refocusing pulses are centered at 9.1 ppm for NAD+ and 4.7 ppm for water.
To check the sequence efficiency, 1H MRS was performed on a nicotinamide phantom (20 mM, pH 7). All the human studies were conducted under an approved Institutional Review Board protocol of the University of Pennsylvania on 7T Siemens scanner with a 28-channel phased-array knee coil. Three healthy subjects with mean age 31.7 ± 2.3 yrs were scanned. T1-weighted anatomical 2D magnetization-prepared rapid gradient echo images of the right calf were acquired for positioning the spectroscopy voxel. A voxel sized 40×40×40 mm3 was placed in the Soleus and Gastrocnemius muscles in the calf. Water reference acquisitions were done with TR=8s and 4 avgs and NAD+ acquisitions were done with TR=1s and 512 avgs. Additionally, water reference scan was done at TR 1s for eddy current estimation and correction.
Raw multi-channel time domain data from the scanner was used for post-processing. Water data was used for eddy current calculations, channel selection, and combination. From the water raw data, eddy current compensation was applied to generate a water FID. Reference water spectrum was obtained by the Fourier transform of the water FID. For generating the NAD+ spectrum, 32 averages were used for block-averaging and each block spectrum was eddy current corrected, Fourier transformed, spectral frequency aligned and phase corrected using the position and phase of the broad amide/unassigned purine nucleotide signal between 8 and 8.8 ppm. Final spectrum was produced as the sum of all the individual blocks. For NAD+ quantification, the spectrum in the range of 9 to 9.5 ppm was fitted to a sum of 2 Lorentzians and from the integral of the 9.35 ppm peak, NAD+ concentration was calculated by normalization with the water integral (assuming 70% water content in the calf).
Results and Discussion
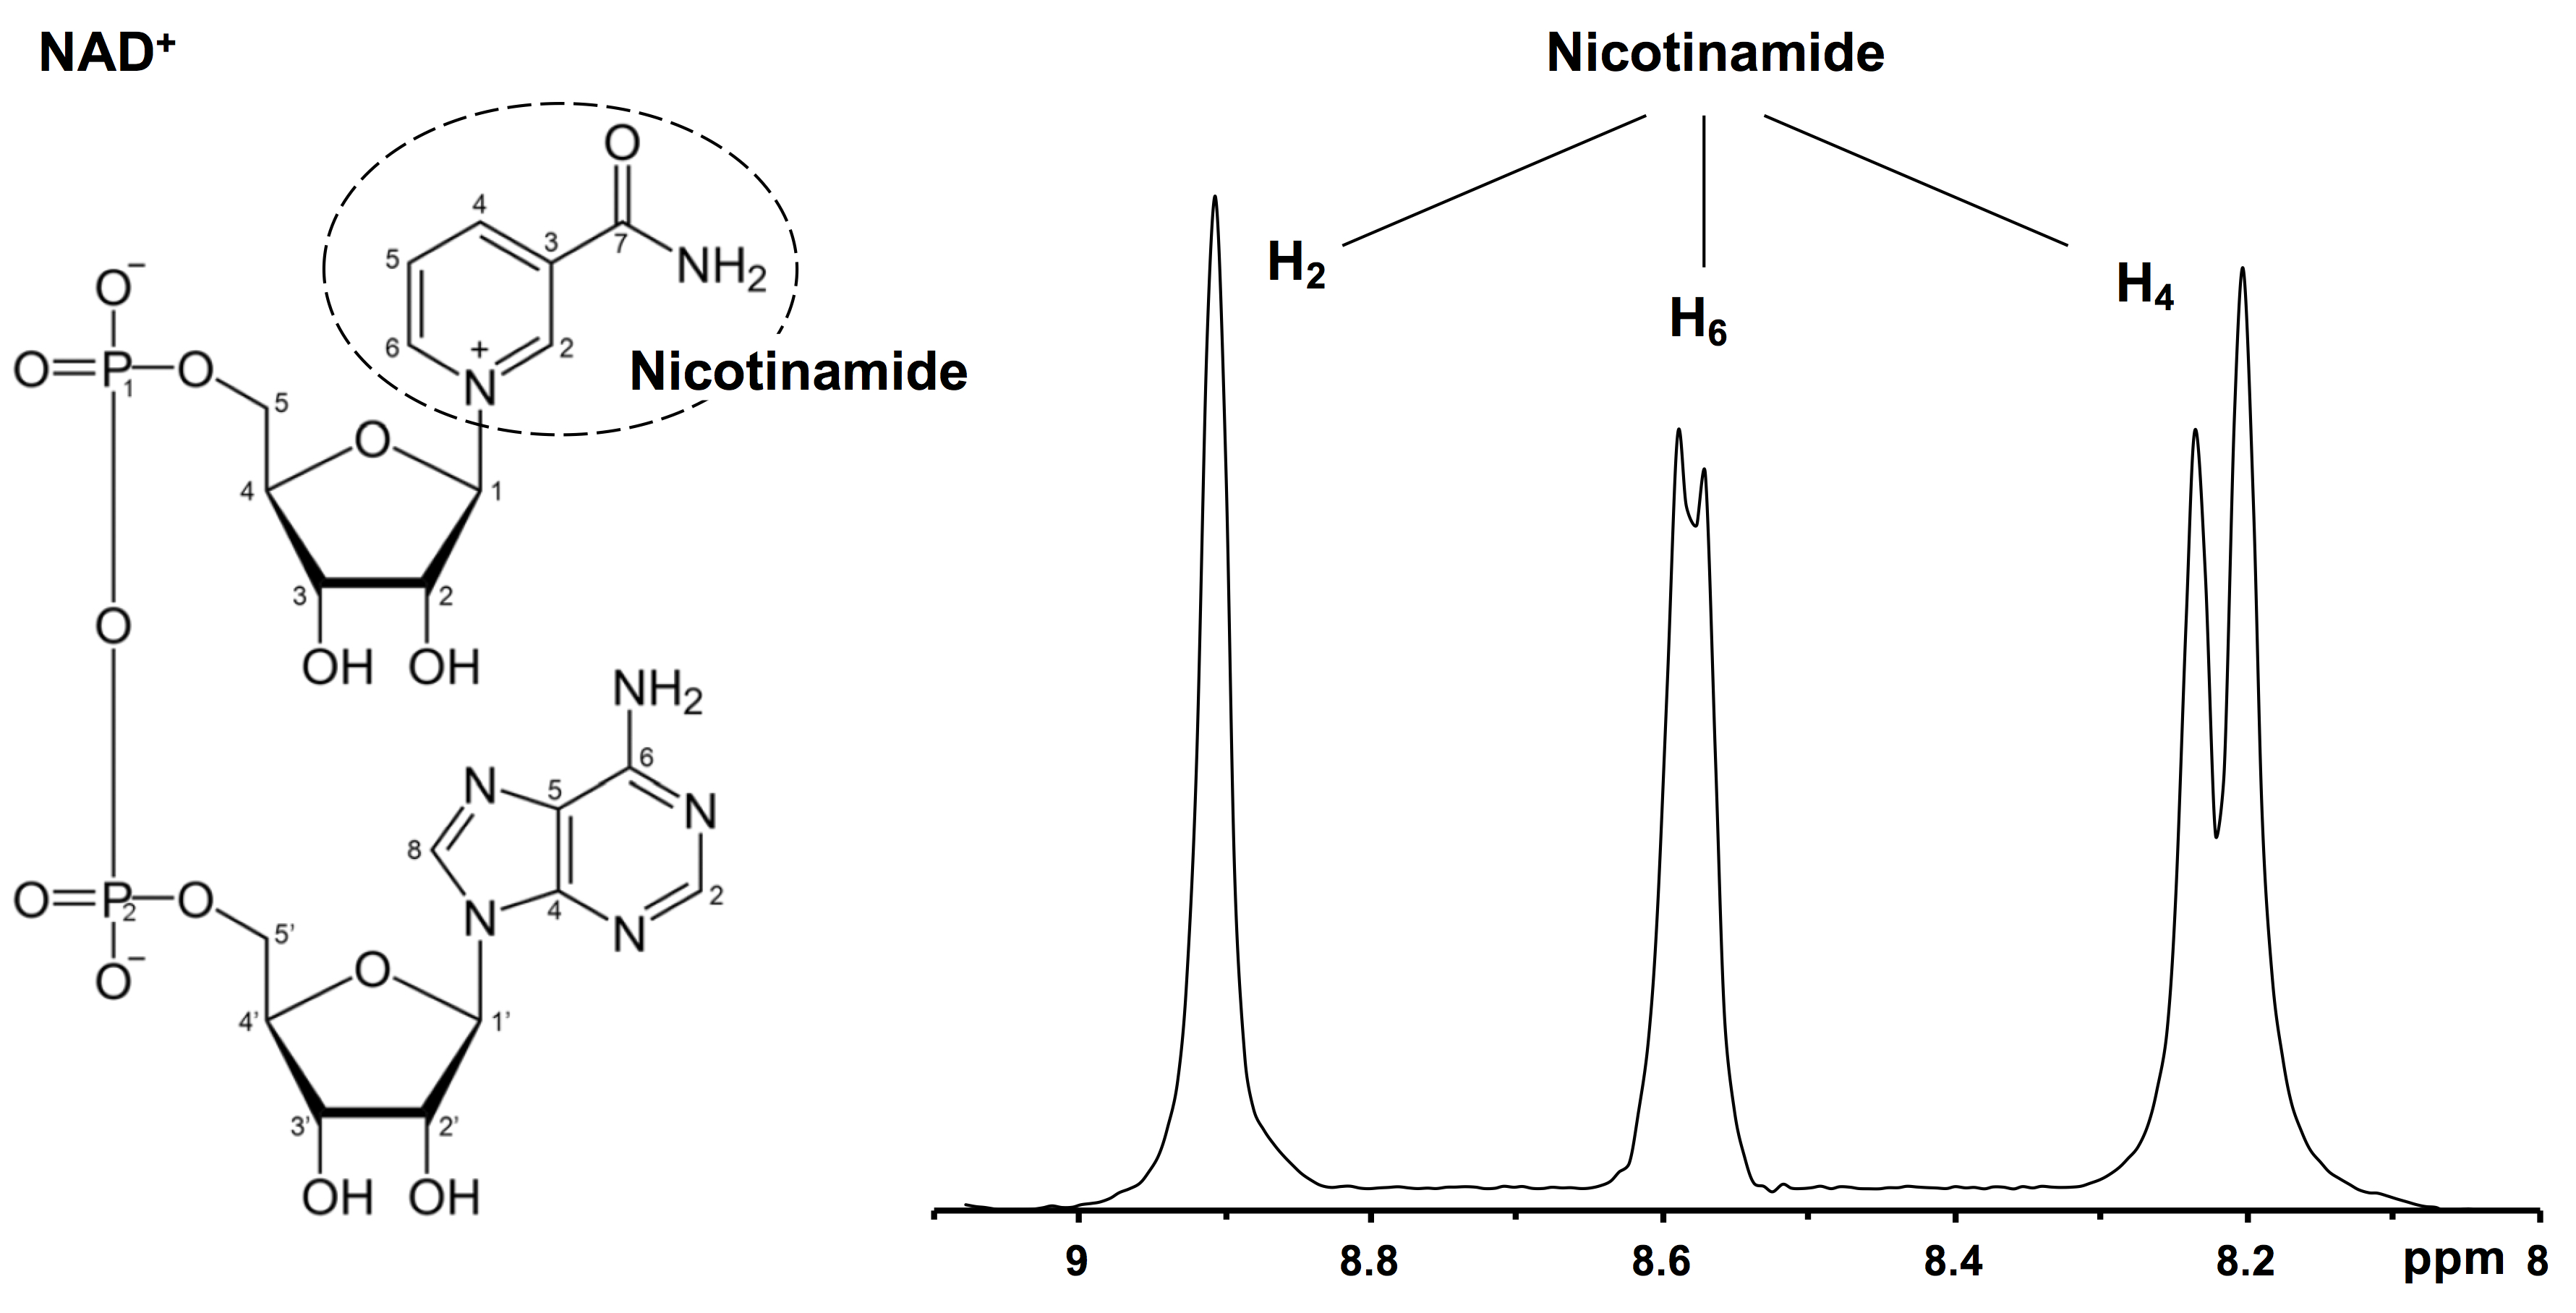
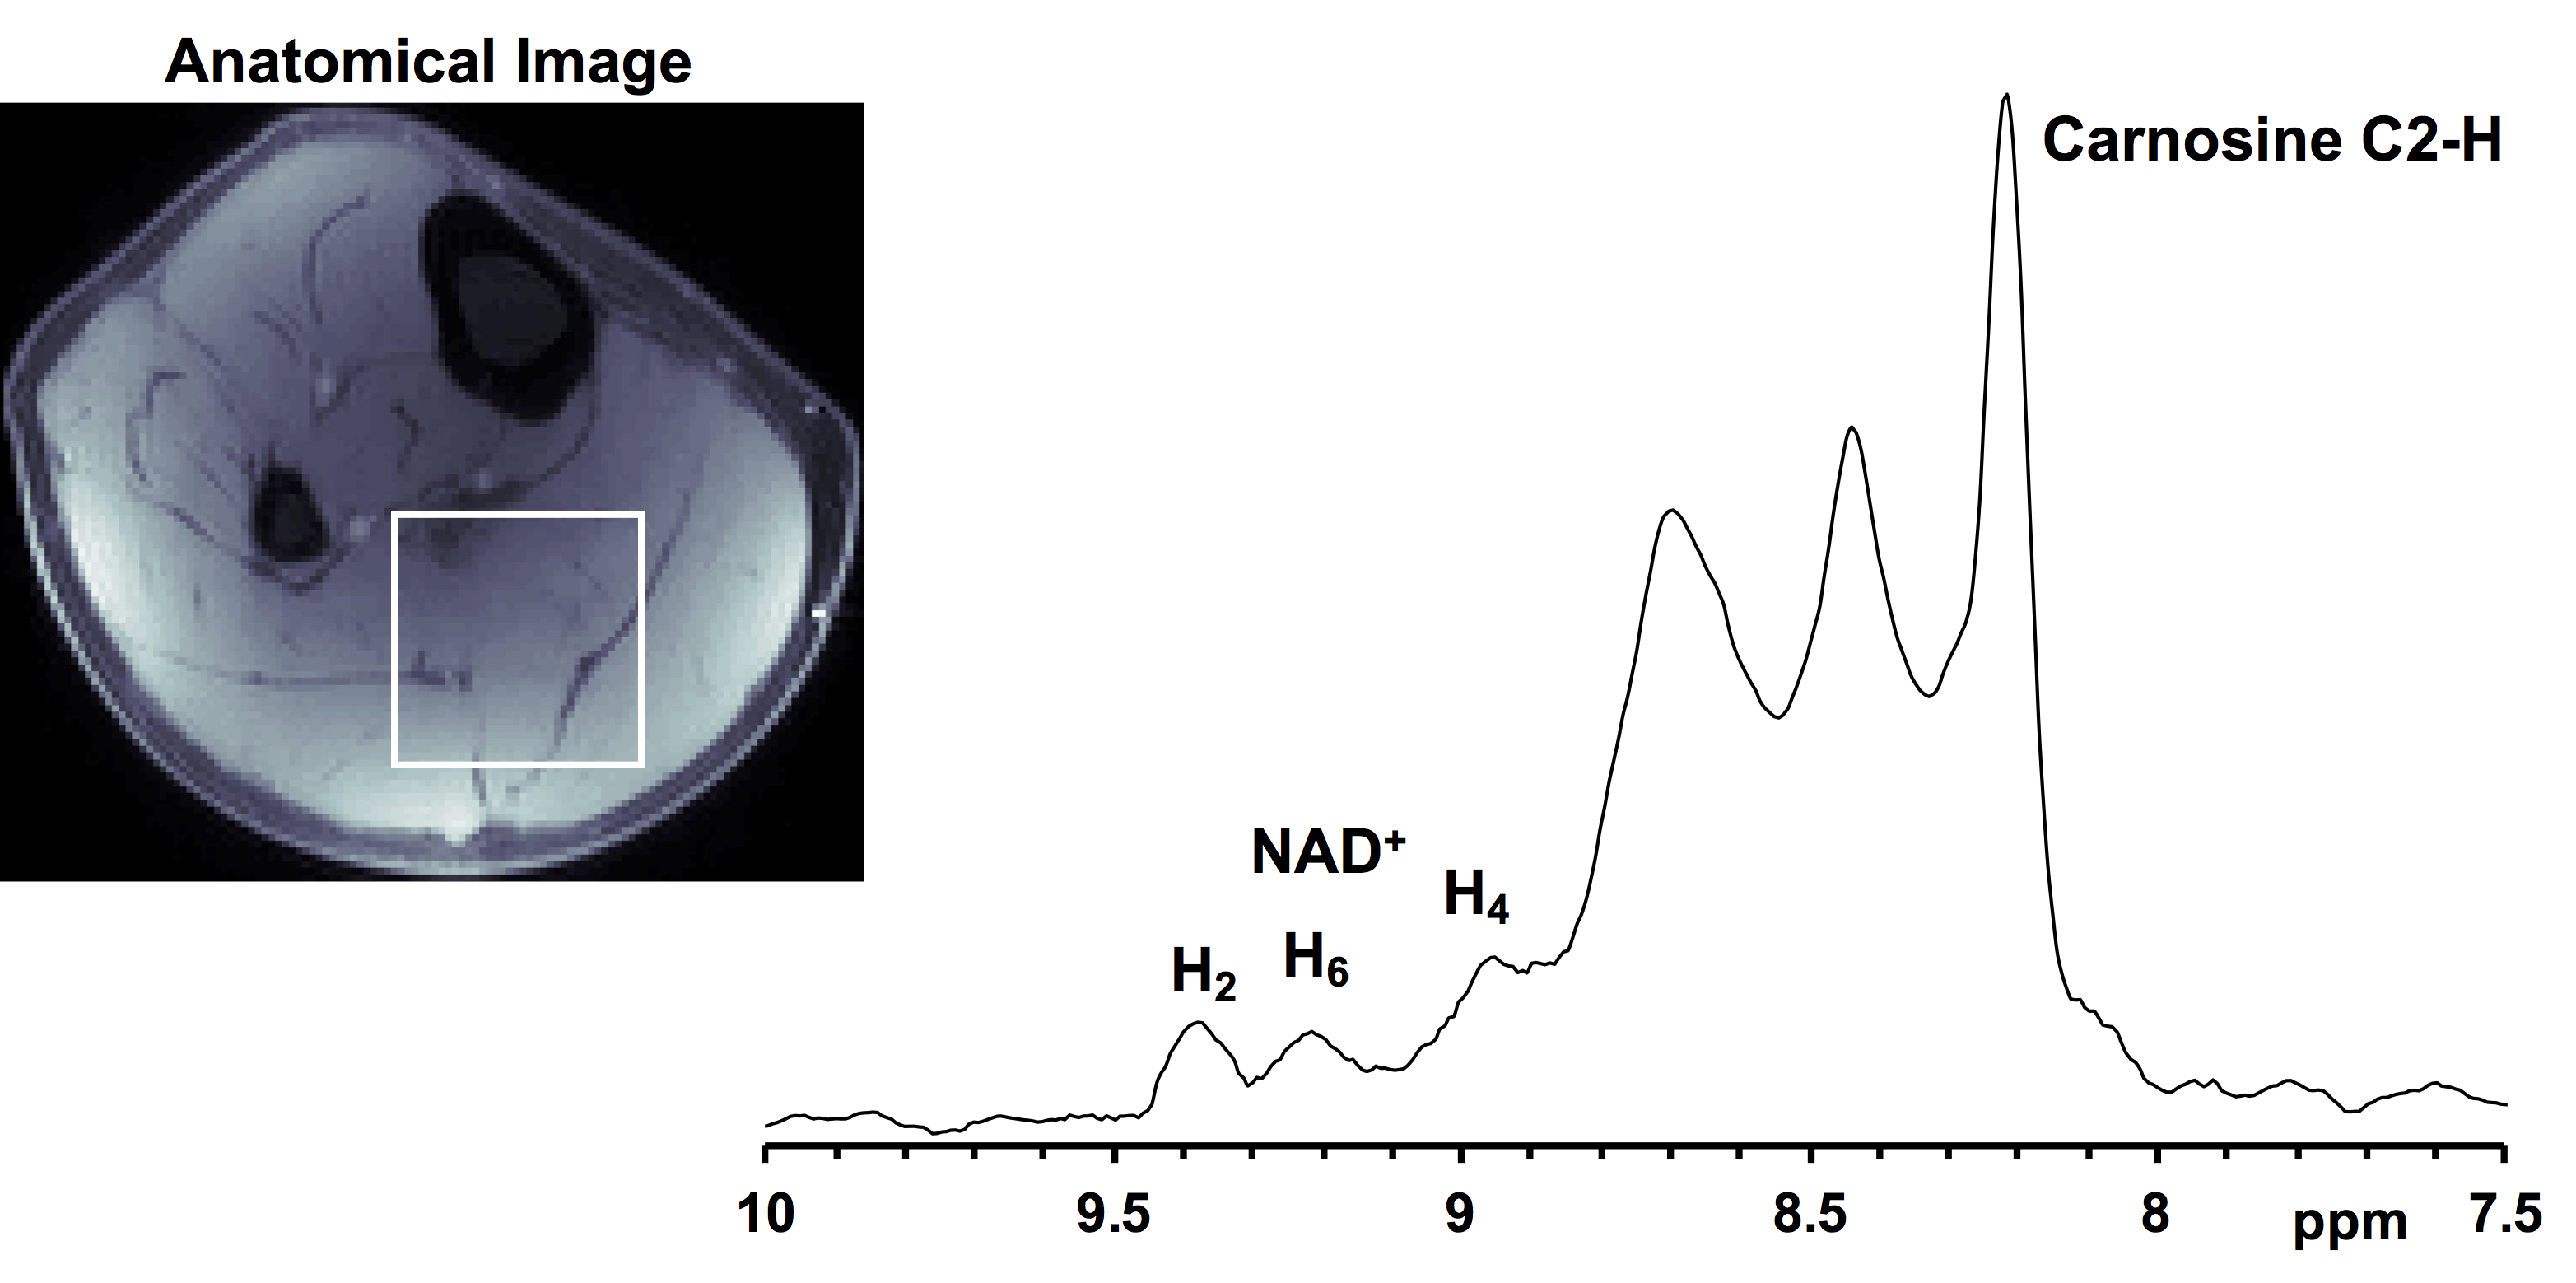
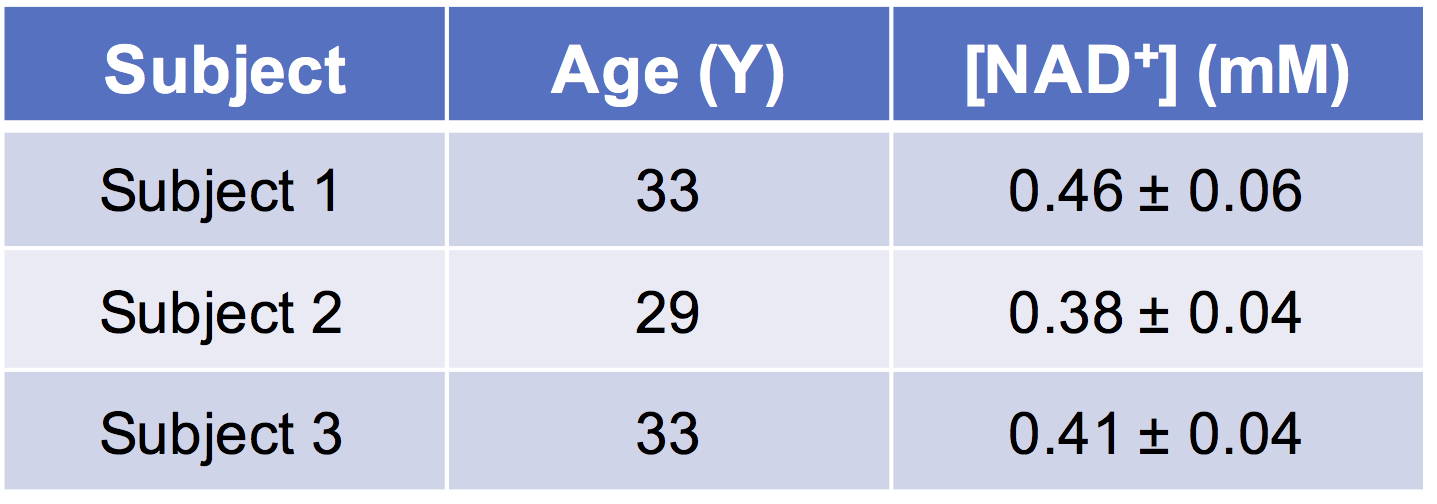
Figure 1 shows the downfield region of a 1H MR spectrum acquired from nicotinamide solution (20 mM, pH 7) at 7T. The three peaks at 8.2, 8.6 and 8.9 ppm can be attributed to the H4, H6 and H2 protons of the nicotinamide which is the active moiety in NAD+. Figure 2 represents the NAD+ spectra acquired from the soleus and gastrocnemius muscles in the human calf at 7T. Besides the carnosine C2-H signal at 8.2 ppm and multiple, unassigned signals from purine nucleotides between 8.3 and 8.8 ppm, the downfield region displays three clear resonances at 8.95, 9.1 and 9.35 ppm. The non-overlapping NAD+ H2 resonance at 9.35 ppm was quantified to be ~0.42 mM. Table 1 shows the concentration of NAD+ in the soleus and gastrocnemius muscles of three healthy subjects. The measured NAD+ concentration (0.42 ± 0.04 mM, n = 3) in muscle corroborates with the previously reported levels of NAD+ in the literature3,4,5. Further investigations for the NAD+ levels in the different pathological conditions and in normal aging are ongoing.Acknowledgements
This project was supported by the National Institute of Biomedical Imaging and Bioengineering of the National Institutes of Health through Grant Number P41-EB015893 and the National Institute of Neurological Disorders and Stroke through Award Number R01NS087516.References
1. Stein LR and Imai S Trends Endocrinol Metab 2012 23:420-38
2. Bai P and Canto C Cell Metab 2012 16:290-95
3. Lu M et al Magn Res Med 2014 71:1959-72
4. de Graaf RA and Behar KL NMR Biomed 2014 27:802-09
5. de Graaf RA et al Magn Reson Med 2016 DOI:10.1002/mrm.26465
6. Bagga P et al Proc Int Soc Magn Reson Med 2017 25:1057
Figures