1295
Uncovering Long Range J-coupled Lipid Resonances in Human Calf In-Vivo: Pilot Findings Using Localized Two Dimensional Total Correlated Spectroscopy1Radiological Sciences, David Geffen School of Medicine at UCLA, Los Angeles, CA, United States, 2Medicine, David Geffen School of Medicine at UCLA, Los Angeles, CA, United States, 3Greater Los Angeles Veterans Affairs Medical Center, Los Angeles, CA, United States, 4Center for Biomedical Imaging, New York University School of Medicine, New York, NY, United States
Synopsis
Based on the same principle of localized correlated spectroscopy (L-COSY) of coherence transfer during mixing period, total correlated spectroscopy (TOCSY) is a powerful technique that can provide correlations for both direct and long range coupled spins via relayed coherence transfer. Due to the SAR issue, the potential of TOCSY has not been fully exploited in-vivo and only few versions of TOCSY have been evaluated in brain. Here we have implemented a novel version of localized TOCSY technique for implementation in human calf muscle in-vivo, and compared results from three mixing strategies. Results are presented from a corn oil phantom, and in-vivo 2D spectra from 4 healthy volunteers and 1 diabetic patient obtained on 3T clinical platforms. We demonstrated that TOCSY can uncover the hidden relayed peaks, particularly that of IMCL/EMCL in calf muscle which can play an important role in better estimation of degree of unsaturation.
Introduction:
Localized correlated spectroscopy (L-COSY)1 facilitates improved detection of overlapping metabolites with increased spectral dispersion. In skeletal muscle, COSY has been used to separately assess saturated and unsaturated lipid components, allowing estimation of the degree of unsaturation2,3. Based on the same principle of COSY, total correlated spectroscopy (TOCSY)4 is another powerful technique that contains information about the directly scalar coupled spins coherence transfer. However, TOCSY can provide additional correlations for remotely J-coupled spins and exhibits an in-phase magnetization transfer. In-vivo 1D spectral-editing TOCSY5,6 and localized 2D TOCSY7 in human brain have been demonstratedn previously. Due to the SAR issue associated with the requirement of a sustained train of RF pulses during TOCSY mixing, the potential of TOCSY has not been fully exploited in-vivo. Here, we propose a novel version of localized TOCSY technique to recover hidden resonances in human calf muscle in-vivo. We also compare the results from three mixing strategies: a spin lock scheme using continuous wave (CW) RF pulses8,9, an MLEV410 scheme, and a CW spin lock scheme with composite pulses.Materials and Methods:
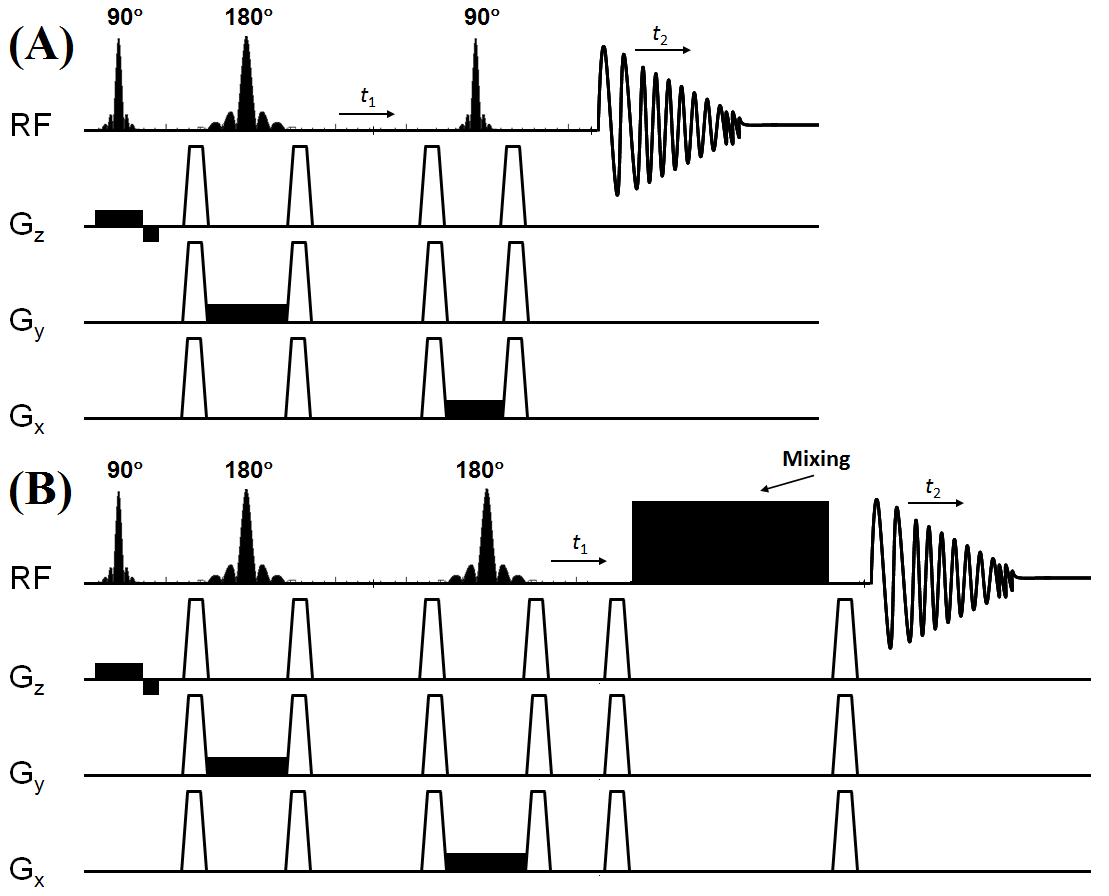
Fig.1 shows the schematic diagram of the TOCSY sequence. TOCSY block does not contribute to the echo time and the total echo time is nothing but the echo time of the PRESS localization block. The time between the last 180° refocusing pulse in the PRESS localization and the TOCSY block was incremented to introduce the t1 evolution. Global water suppression was performed using a WET11 scheme, preceding the first excitation pulse. To test the sequence, a corn oil phantom was used. The sequence was further evaluated in the calf muscle of four healthy volunteers (age, 23-40 years) and one type 2 diabetic subject (63 years). All data were collected on a 3T Prisma MRI scanner using a 15 channel knee ‘transmit/receive’ coil. The TOCSY acquisition parameters for the phantom and in-vivo calf muscle were: a voxel size of 4x4x4cm3, TE=30ms, TR=2-2.5s, averages=8, 64 Δt1 increments with 0.8ms, 1024 t2 points, F1 and F2 bandwidths of 1250 Hz and 2000 Hz respectively with scan time ~17-25min. 2D L-COSY spectra were also acquired with same parameter for comparisons purposes. Acquired data were extracted, and post-processed12 with a library of custom MATLAB-based program.Results:
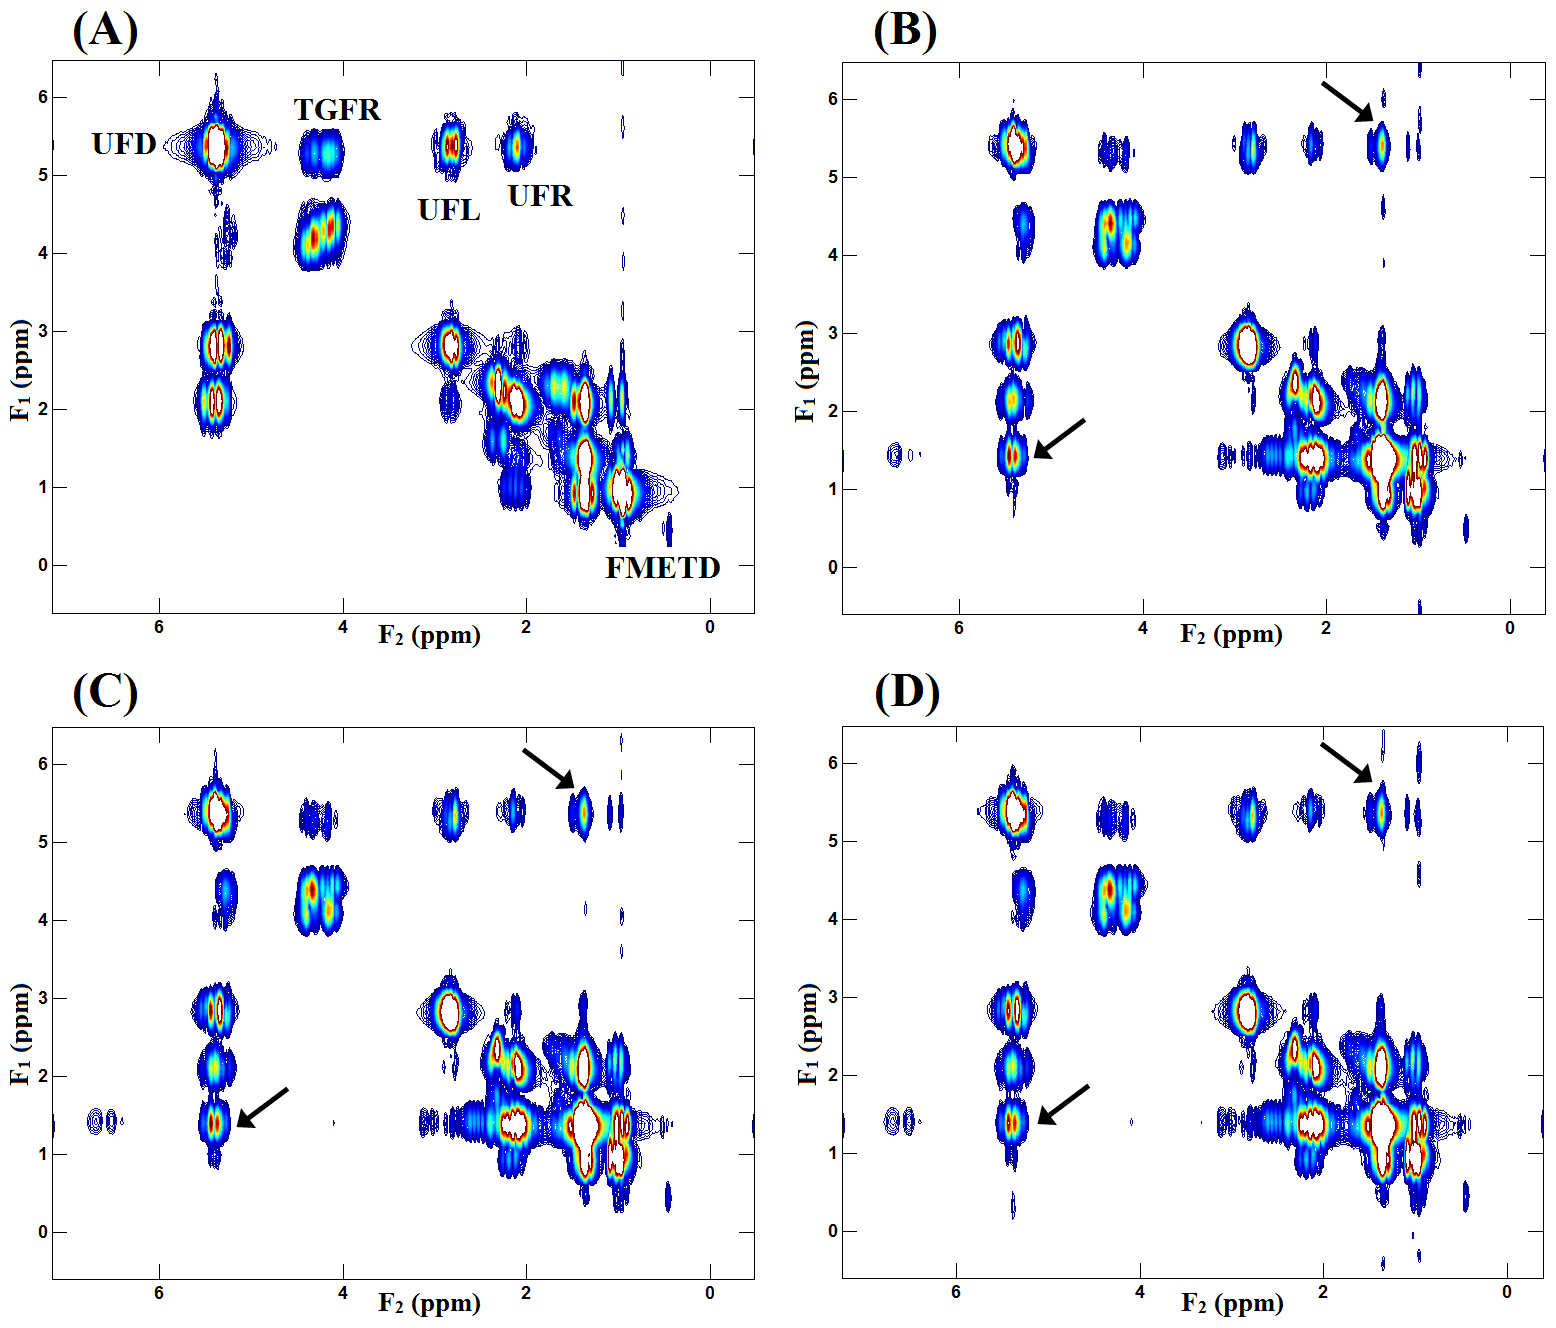
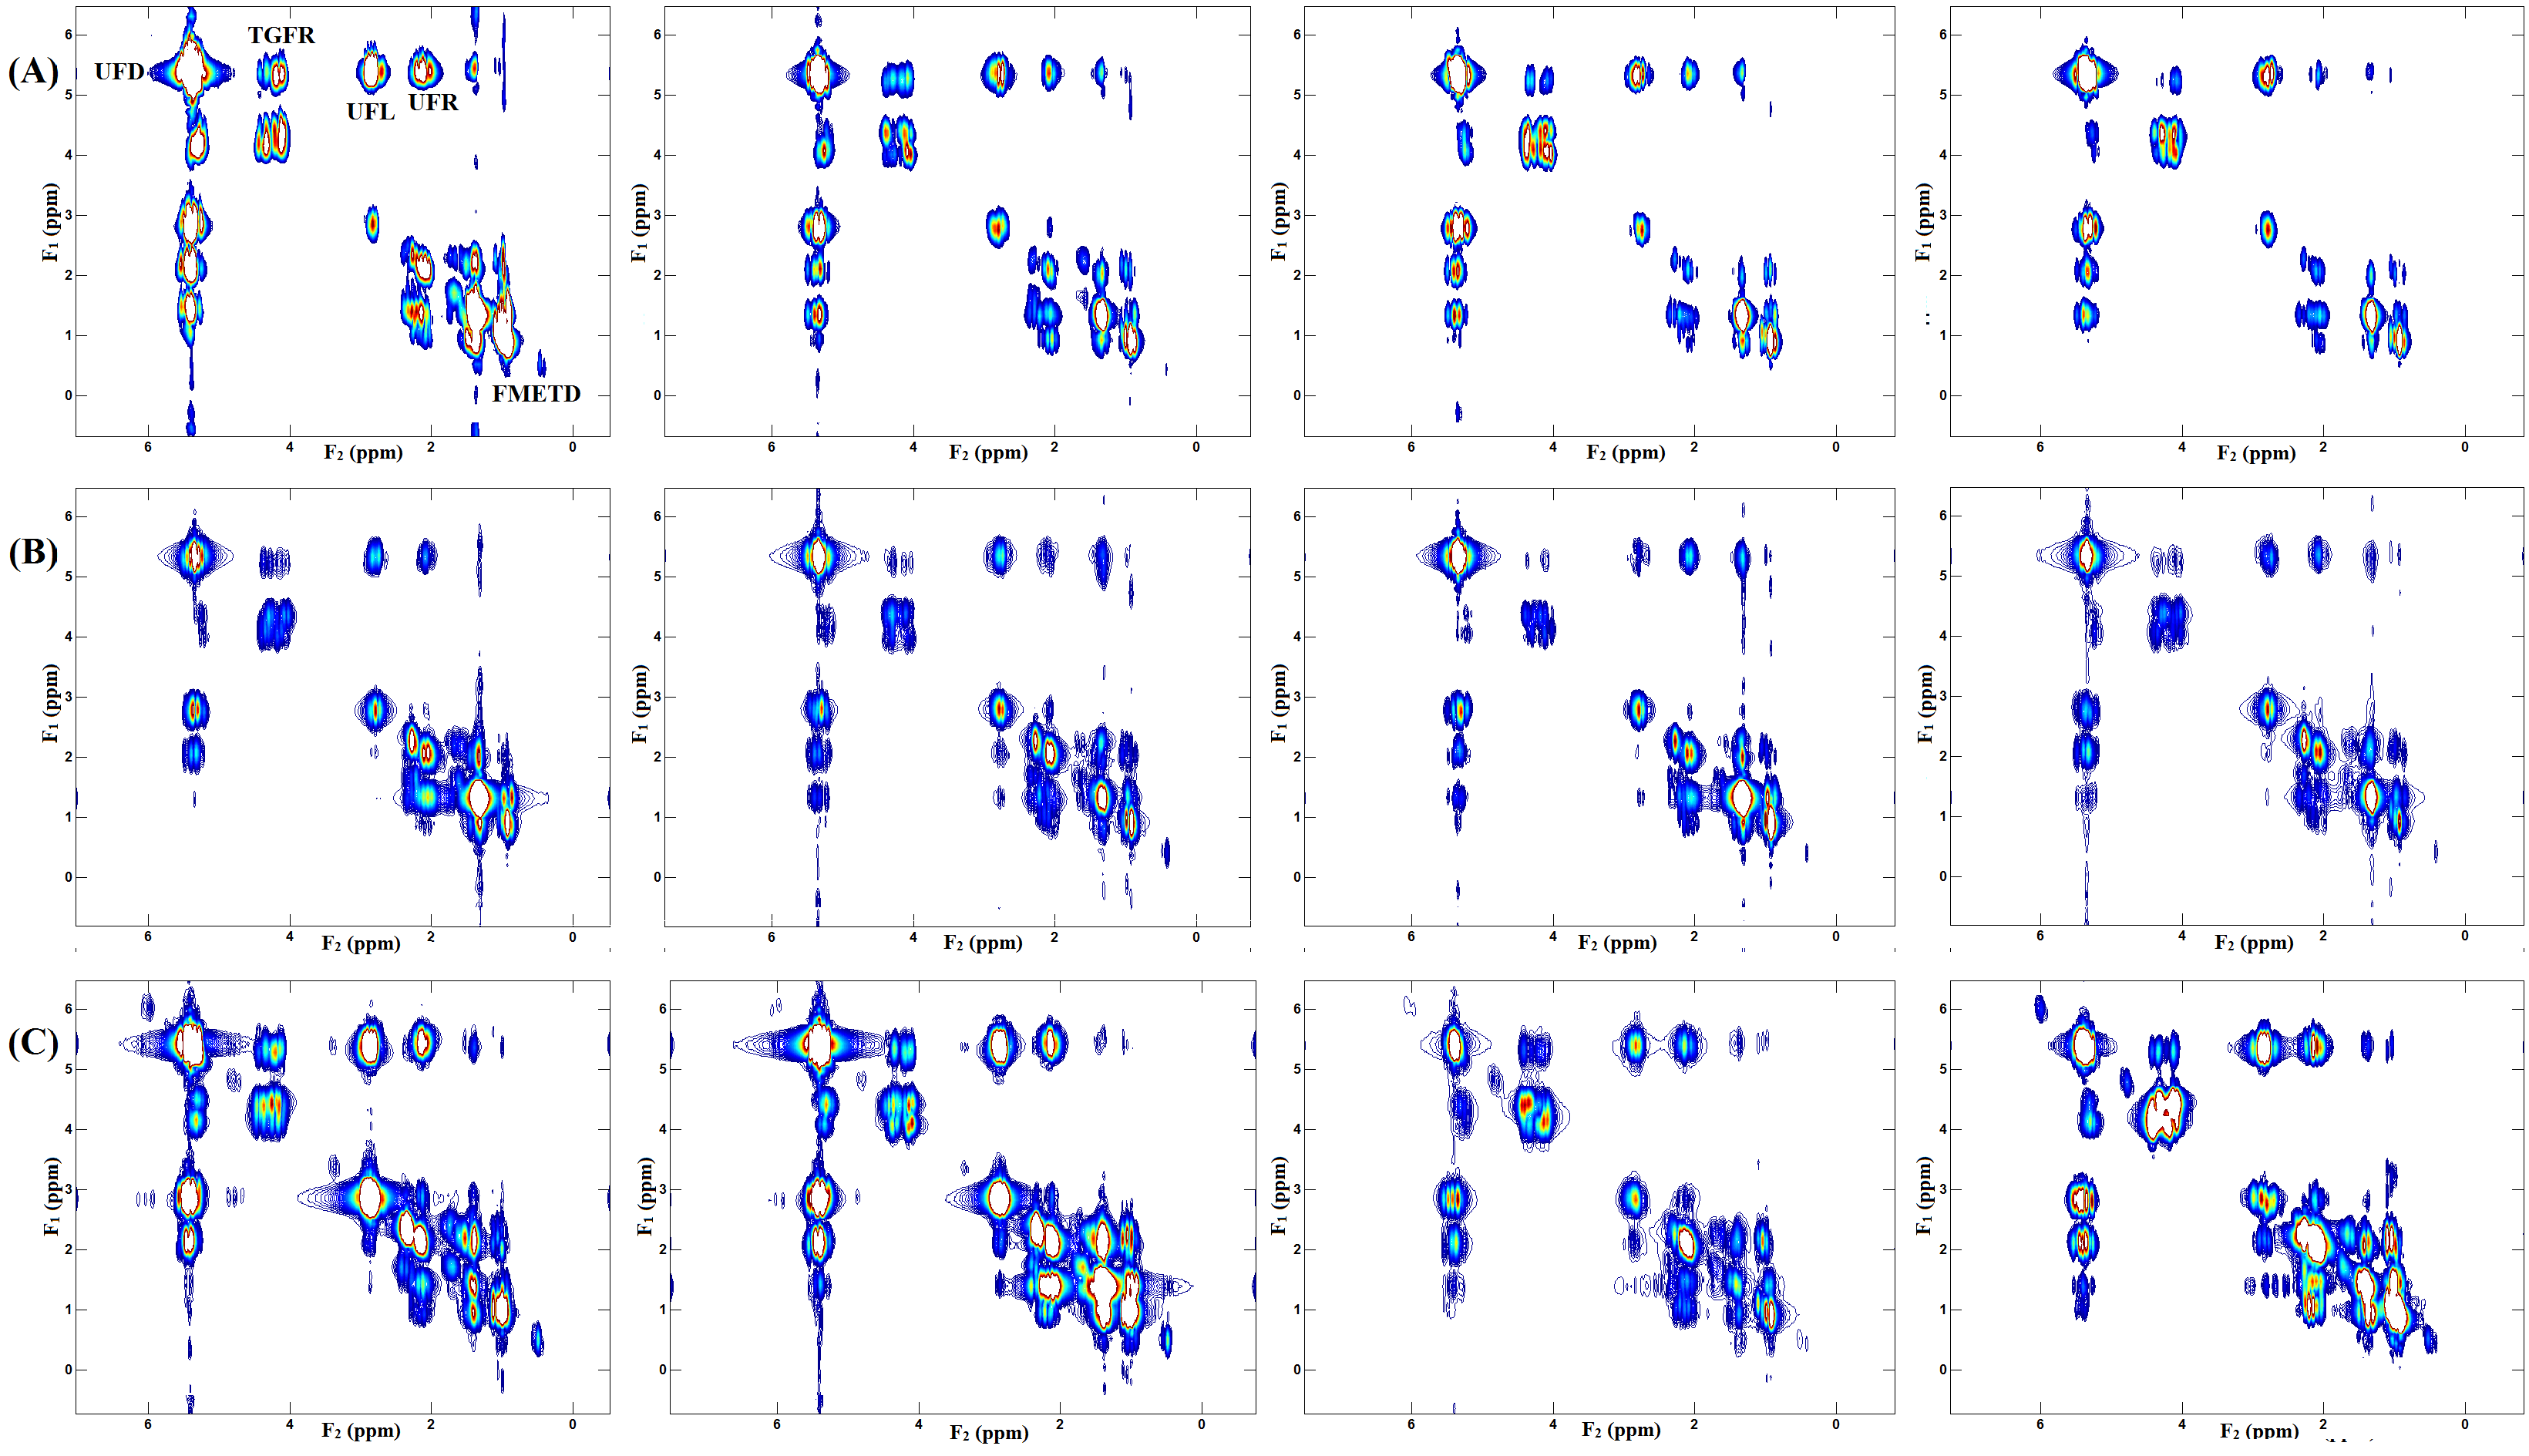
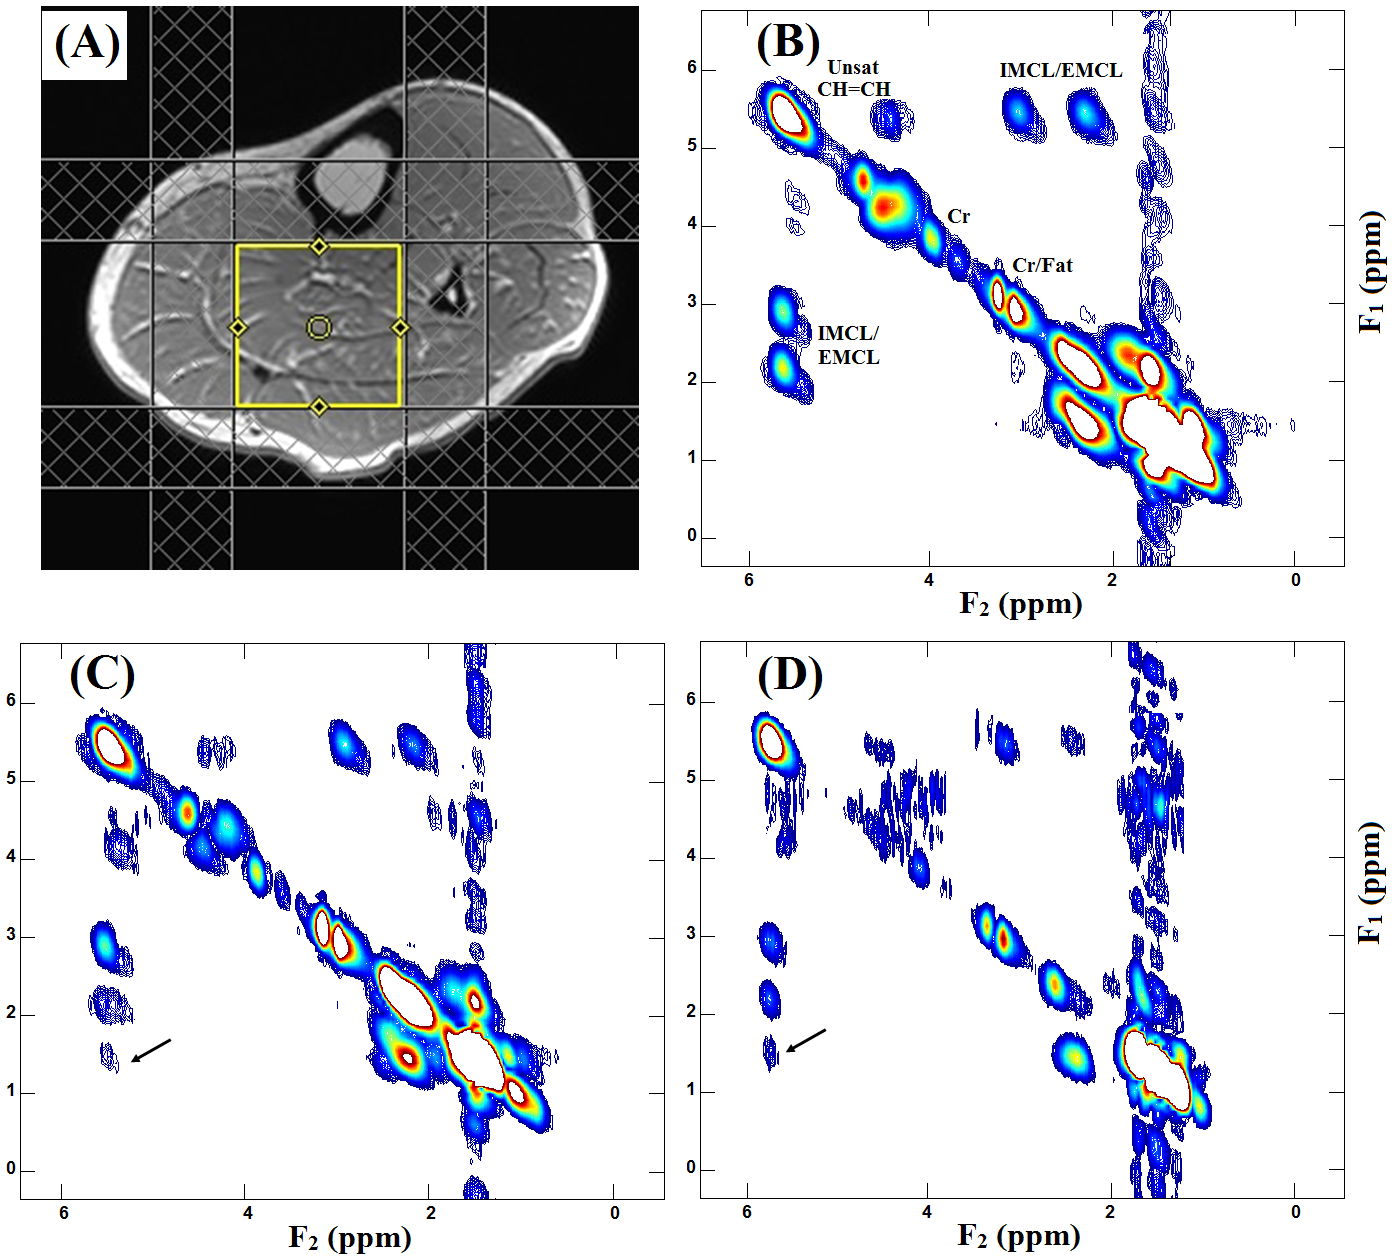
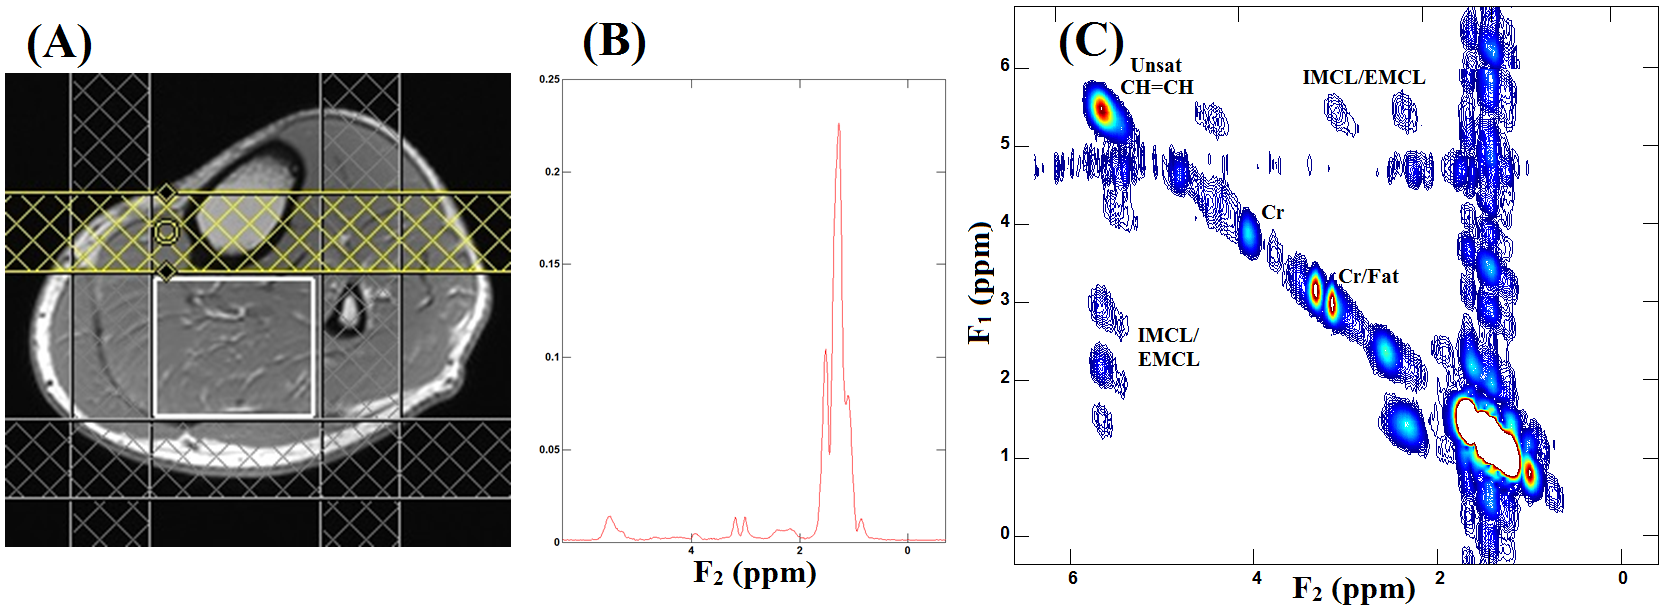
Fig. 2 shows our initial results in corn phantom showing spectra recorded with L-COSY and TOCSY using the three different mixing strategies. Cross peaks of all lipid multiplets were well visible and separated from the main diagonal. Due to in-phase coherent transfer the multiplet structure of each cross peak is more apparent in TOCSY spectra. Relayed cross peaks of intramyocellular (IMCL)/extramyocellular lipids (EMCL) are visible in TOCSY spectra which cannot be detected in COSY. TOCSY spectra measured with the three mixing strategies at different mixing time are shown in Fig. 3. At very short mixing time of 11.5ms also TOCSY with SL showed relayed cross peaks. Fig. 4 demonstrates results obtained at 3T from a patient with diabetes. The relayed cross peak of IMCL/EMCL which are not visible on COSY (Fig. 4(B)), can be observed in TOCSY with SL at mixing time 11.5ms and TOCSY with MLEV-4 at mixing time 45ms (Fig. 4(C) and 4(D)). TOCSY with MLEV-4 spectra recorded in a healthy volunteer are shown in Fig. 5. A projected spectrum along the F1 dimension from the same voxel is included for comparison. Here also, relayed cross peak of IMCL/EMCL are visible demonstrating the reliability of the TOCSY technique.Discussion:
Although different versions of TOCSY have been implemented before for in-vivo brain study, this work represents the first demonstration of a robust in vivo TOCSY for calf muscle application. Although COSY spectra have a higher SNR than TOCSY due to the fact that the optimum mixing conditions for TOCSY are harder to realize in-vivo within SAR limits, we demonstrated that TOCSY can uncover the hidden relayed cross peaks, particularly that of the unsaturated IMCL/EMCL in calf muscle which can play an important role in clinical application in diabetic/obese skeletal muscle studies for better estimation of degree of unsaturation. Compared to COSY, TOCSY has the advantage of eliminating signal cancellation and improving spectral resolution with pure absorptive phase-sensitive crosspeaks7. Even though CW-SL performed better, MLEV based TOCSY may be a better option at 3T due to less SAR compared to the CW pulses allowing it to use in other body parts. There are still some limitations to the work including the long scan time, which will be addressed in future studies.Conclusion:
While these initial results are promising, further optimization and validation with a larger pool of subjects is needed. We expect that the new developments presented in this work will facilitate in-vivo applications of TOCSY in clinical evaluations.Acknowledgements
This research was supported by grants from 1) NIH/NIBIB (5R21EB020883-02) and 2) NHLBI 1R56HL131010-01A1.References
1. Thomas MA, Yue K, Binesh N, et al. Localized two-dimensional shift correlated MR spectroscopy of human brain. Mag Res Med 2001; 46(1):58–67.
2. Velan SS, Said N, Durst C, et al. Distinct patterns of fat metabolism in skeletal muscle of normal weight, overweight and obese humans. Am J Physiol Regul Integ Comp Physiol 2008;295(4): R1060–R1065.
3. Velan SS, Durst C, Lemieux SK, et al. Investigation of muscle lipid metabolism by localized one- and two-dimensional MRS techniques using a clinical 3T MRI/MRS scanner. J Magn Reson Imaging 2007;25(1):192–199.
4. Braunschweiler L, Ernst RR. Coherence Transfer by Isotropic Mixing: Application to Proton Correlation Spectroscopy. J Magn Reson 1983;53(3):521–528.
5. Choi IY, Lee SP, Shen J. Selective homonuclear Hartmann-Hahn transfer method for in vivo spectral editing in the human brain. Magn Reson Med 2005;53(3):503–510.
6. Marjanska M, Henry PG, Bolan PJ, et al. Uncovering hidden in vivo resonances using editing based on localized TOCSY. Magn Reson Med 2005;53(4):783-789.
7. Andronesi OC, Ramadan S, Mountford CE, Sorensen AG. Low-power adiabatic sequences for invivo localized two-dimensional chemical shift correlated MR spectroscopy. Magnetic Resonance in Medicine 2010; 64(6):1542–1556.
8. Zu Z, Li H, Jiang X, Gore JC. Spin-lock imaging of exogenous exchange-based contrast agents to assess tissue pH. Magn Reson Med 2017. [Epub ahead of print]
9. Sharafi A, Xia D, Chang G, Regatte RR. Biexponential T1ρ relaxation mapping of human knee cartilage in vivo at 3 T. NMR Biomed 2017;30(10).
10. Brittain JH, Hu BS, Wright GA, et al. Coronary Angiography with Magnetization-Prepared T2 Contrast. Magn Reson Med 1995; 33(5):689–696.
11. Ogg RJ, Kingsley PB, Taylor JS. WET, a T1- and B1-insensitive water-suppression method for in vivo localized 1H NMR spectroscopy. J Magn Reson B 1994;104(1):1–10.
12. Sarma MK, Huda A, Nagarajan R, et al. Multi-dimensional MR spectroscopy: towards a better understanding of hepatic encephalopathy. Metab Brain Dis 2011;26(3):173–184.
Figures