1293
Accuracy and Reproducibility of NAD+, NADH and Redox Ratio Measurement in Human Brain by LCModel1Centre d'Imagerie BioMédicale (CIBM), Ecole Polytechnique Fédérale de Lausanne (EPFL), Lausanne, Switzerland, 2Nestec Ltd, Avenue Nestlé 55, Vevey, Switzerland, 3Departments of Radiology, University of Lausanne, Lausanne, Switzerland, 4Laboratory of Functional and Metabolic Imaging, Ecole Polytechnique Fédérale de Lausanne, Lausanne, Switzerland
Synopsis
The aims of this study were to test the feasibility of NAD+, NADH and redox ratio([NAD+/NADH]) measurement in vivo in the human brain at 7T using LCModel and to further evaluate the measurement accuracy and reproducibility. High 31P spectral quality was achieved and LCModel provides excellent fitting quality. Monte-Carlo simulations and test-retest experiments demonstrated good measurement accuracy and reproducibility with sufficient SNR achieved. The values are in agreement with those previously published. Therefore, LCModel can be used as an alternative tool to achieve automated and objective measurement of NAD+, NADH and redox ratio in human brain in vivo.
Introduction
The oxidized (NAD+) and reduced (NADH) form of nicotinamide adenine dinucleotide play a key role in many biological processes such as energy metabolism, antioxidation, calcium homeostasis and their ratio reflects cellular redox state1. Their measurement in vivo is challenging due to its low concentration and limited spectral separation. With the increase of sensitivity, spectral dispersion at high magnetic fields and the efforts made on spectral fitting, recent studies have successfully reported the measurement of these parameters in vivo in cat and human brains by 31P MRS using in-house fitting routines, which mostly use least-square fit2-5. LCModel6 as a robust and automated software has been widely used for 1H and 13C MRS spectral quantification and it was also demonstrated once for 31P MR spectral fit at 3T7. The advantage of LCModel over the least-square fit is that it is more automated and objective. However, the quantification of NAD+, NADH and redox ratio (RR, [NAD+]/[NADH]) from 31P spectra using LCModel has never been reported. Therefore, the aims of this study were 1) to test the feasibility of NAD+, NADH and RR measurement in vivo in the human brain at 7T using LCModel; 2) to further evaluate the accuracy and reproducibility of the measurement.Methods
Accuracy: Monte Carlo simulations
Monte Carlo simulations were performed to evaluate the impact of SNR and linewidth(LW) on the measurement accuracy. Simulated 31P spectra were generated with different SNRPCr (30-240, 30/step) and LWPCr (6.5-12.5 Hz, 1Hz/step) at 7T using the published chemical shift, J-coupling constants and concentrations2,5,8. A baseline obtained by a spline fit of the in vivo spectra was added into the simulated spectra. 100 spectra were generated at different experimental conditions by adding random Gaussian noise. Measurement accuracy was assessed by comparing the quantified values with its respective true values using the estimation error(%)=([meas]-[true])×100/[true].
Reproducibility: test-retest measurements
Six healthy volunteers (4M/2F, 19-33y) were recruited and gave informed consent prior to the study. 31P MRS experiments were performed on a 7T/68cm MR scanner (Siemens Medical Solutions) with an in-house-built 1H quadrature surface coil (10cm-diameter) and a single-loop 31P coil (7cm-diameter) for the coverage of occipital lobe. B0 field inhomogeneity was optimized using FAST(EST)MAP. A pulse-acquire sequence was used with a 200μs hard pulse for excitation and the flip angle was calibrated in vivo to achieve maximal PCr signal. This measurement was performed two times (scan1 and scan2) on the same subject with a 10-30min break.
Spectral processing and quantification
B0 shift correction was performed prior to summation of the spectra. Summed 31P MR spectra were analyzed by LCModel using a basis-set composed of simulated 31P spectra of PCr(phosphocreatine), α-ATP, β-ATP, γ-ATP, Piint, Piext, PE (phophothanolamine), PC (phosphocoline), GPC (glycerophosphocholine), GPE (glycerophosphoethanolamine), MP (membrane phospholipid), NADH, NAD+, UPDG (uridine diphosphoglucose) with respective linewidths7. [α-ATP] was assumed to be 2.8 mM 3,4 and used as an internal concentration reference. Coefficients of variance (CV[%]=SD/mean) were calculated to evaluate the measurement reproducibility.
Results
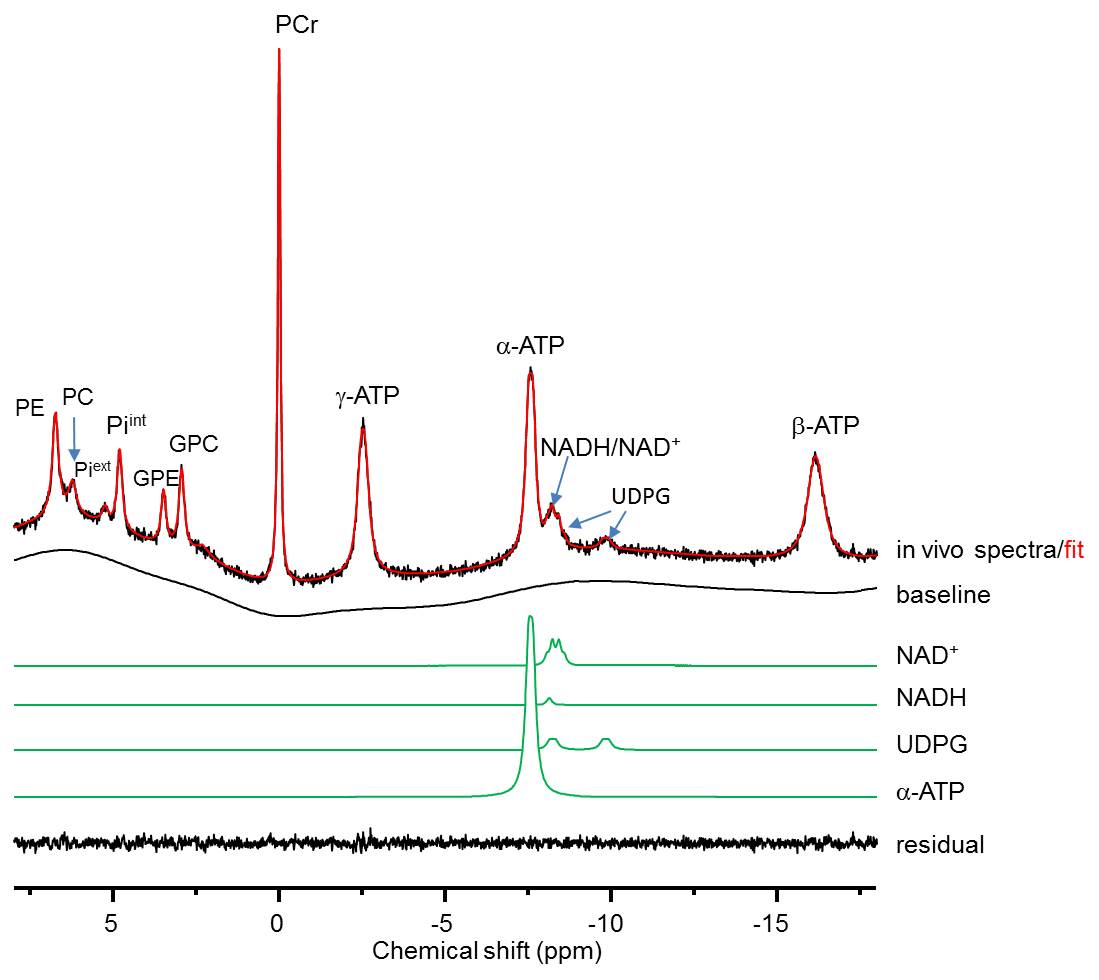
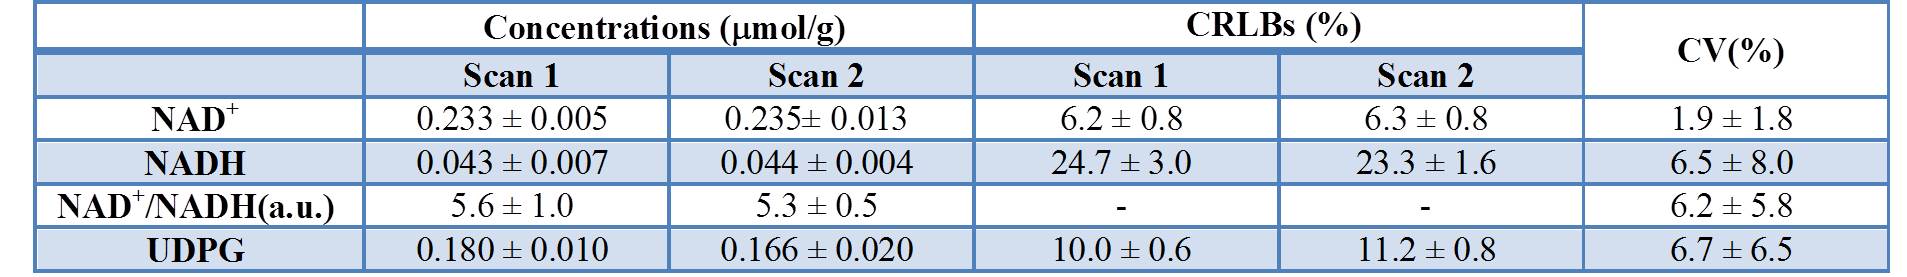
High spectral quality (scan1: SNRPCr=164±14, LWPCr=10.2±1.3Hz and scan2: SNRPCr=163±52, LWPCr=10.0±2.2Hz) achieved at 7T is a prerequisite for NAD and RR measurement, as demonstrated in Fig.1 with a representative in vivo 31P spectrum of human occipital lobe at 7T. LCModel provides good fitting quality for NAD regions with the fit residual minimized to the noise level (Fig.1). Results of Monte Carlo simulations demonstrated excellent accuracy of measurement when SNR>50 (Fig.2a) and the precision is improved with the increase of SNR. In addition, the spectral linewidth shows very minor impact on both accuracy and precision (Fig. 2b). Metabolites concentrations quantified in vivo and CV(%) are listed in table 1.Discussion and Conclusion
This study demonstrated the feasibility of NAD+, NADH and RR measurement in vivo from 31P MRS at 7T using LCModel. Good accuracy and reproducibility can be achieved with sufficient SNR. More importantly it is an automated and user-independent tool relative to other customized fitting routines. As suggested by de Graaf et al.5, both UDPG resonances(-8.23 and -9.83ppm) were included in the LCModel basis-sets and the concentrations of NAD+ and NADH are in excellent agreement with those reported in Kim et al.4, which also included UDPG in the fitting. As expected, the values are lower than those reported in Zhu et al.3, which did not include UDPG in the analysis, leading to an overestimation of NAD concentrations. For RR values, good agreement with published values in human brain3,4 was attained. We conclude that LCModel can be used as an alternative tool to achieve automated and objective measurement of NAD+, NADH and redox ratio in human brain at 7T.Acknowledgements
Supported by Centre d’Imagerie BioMédicale (CIBM) of the UNIL, UNIGE, HUG, CHUV, EPFL, the Leenards and Jeantet Foundations.References
1. Ying W. NAD+/NADH and NADP+/NADPH in Cellular Functions and Cell Death: Regulation and Biological Consequences. Antioxidants & Redox Signaling. 2007; 10(2): 179-206.
2. Lu M. et al., Intracellular Redox State Revealed by In Vivo 31P MRS Measurement of NAD+ and NADH Contents in Brains. Magn. Reson. Med. 2014; 71:1959–1972.
3. Zhu X.H. et al., In vivo NAD assay reveals the intracellular NAD contents and redox state in healthy human brain and their age dependences. Proc Natl Acad Sci U S A. 2015;112(9):2876-81.
4. Kim S.Y. et al., Redox Dysregulation in Schizophrenia Revealed by in vivo NAD+/NADH Measurement. Schizophr Bull. 2017;43(1):197-204.
5. de Graaf R.A. et al., Detection of cerebral NAD+ in humans at 7T. Magn Reson Med. 2017;78(3):828-835.
6. Provencher S.W., Estimation of metabolite concentrations from localized in vivo proton NMR spectra. Magn Reson Med. 1993;30(6):672-9.
7. Deelchand D. K. et al., Quantification of in vivo 31P NMR Brain Spectra using LCModel. NMR Biomed. 2015; 28(6): 633–641.
8. Ren J. et al., (31)P-MRS of healthy human brain: ATP synthesis, metabolite concentrations, pH, and T1 relaxation times. NMR Biomed. 2015;28(11):1455-62.
Figures