1290
Fast In Vivo Metabolite T2 Quantification by RF-Driven Steady State1National Institute of Mental Health, Bethesda, MD, United States
Synopsis
MARzss method is a novel method for brain metabolite T2 quantification without varying echo time. This study evaluates the feasibility of shortening the scan time of the MARzss method by more than 80% using minimum TR and two-FA measurements. Phantom and preliminary in vivo studies show that metabolite T2 quantifications using two-FA measurements agree well with T2 values obtained by the originally proposed seven-FA measurements. In addition, Monte Carlo simulations indicate that under the same total scan time, the two-FA measurements can significantly improve the precision of T2 quantification.
Introduction
In vivo metabolite relaxation reflects changes in cell-type specific cellular environments due to diseases.1 The transverse in vivo metabolite relaxation time (T2) are conventionally quantified by fitting the decay of signals acquired at different echo times (TEs). However, TE-dependent effects, such as diffusion, macromolecule, and J-coupling modulation, often produce sub-optimal conditions for T2 measurements. For example, many spectral editing techniques require a fixed TE, making determining the T2 of edited signal difficult. Recently, Li et al. proposes a novel multiple flip angle pulse-driven ratio of longitudinal steady states (MARzss) method for quantifying metabolite T2 without varying TE.2 This method uses long repetition time (TR), seven different flips angles (FA), and a linear equation to quantify T2. Here we evaluate the feasibility of shortening the scan time of the MARzss method by >80% by reducing both TR and number of FAs.Methods
The MARzss method measures the pulse driven longitudinal steady state magnetization (Mzss) at several different FAs and computes T1/T2 of metabolites using the following equation: $$ Rzss=\sqrt{\frac{T_{1}}{T_{2}}}\cdot tan(\frac{\alpha}{2}) [1] $$ Where $$$Rzss=\frac{M_{0}-M_{ZSS}}{\sqrt{M_0^2-(M_{0}-M_{ZSS})^{2}}}$$$, M0 is the thermal equilibrium signal intensity, and α is the FA of a single RF pulse in the RF pulse train with interspersing field gradient (iPFG). Monte Carlo simulations were performed to evaluate the precision of linear fitting between seven-FA2 and two-FA (0o and 50o) methods with the same total acquisition time. The average numbers for the seven-FA FIDs and for the two-FA FIDs were selected to generate the same total acquisition time for the two methods. Phantom studies were performed using a doped water-based sphere phantom on a 7T scanner (n = 5). The minimum TR for two-FA MARzss were computed using Bloch simulations. TR of 4.5s was used for FA =0, and TR of 3s with iPFG containing 170 RF pulses was used for FA = 50o. T1 was pre-determined using a conventional inversion recovery sequence. T2 was solved using Eq. [1]. Reference T2 values were provided by the originally proposed seven-FA acquisition with substantially longer TR2. In vivo MRS data were acquired using a 32-channel head coil at 7T. Written informed consent was obtained from 2 healthy volunteers (2 males, 40 and 58 years old). VOI was placed in the occipital lobe. TR = 6.5s for FA = 0; TR = 2.5s for FA = 50o. The total acquisition time was 14 mins for the seven-FA experiments2 and 2.5 min for the two-FA experiments. Number of averages = 16 for each FA.Results
Figure 1 shows the trajectory of longitudinal magnetization in the absence and presence of an iPFG. T1 and T2 values of human brain NAA3 were used in the Bloch simulations. For TR = 6.5s, FA = 0o and TR = 2.5s, FA = 50o, the deviation of the final Mz from steady state is < 0.1%, indicating negligible error due to T1 saturation. Table 1 summarizes the mean and standard deviation of metabolite T2s from fitting 100 sets of Monte Carlo simulations. For the same total scan time, the standard deviations of T2 by the two-FA method are all substantially smaller than the corresponding seven-FA values. Phantom results are given in Figure 2. With only 18% of the scan time of the seven-FA measurement, the mean T2s from two-FA measurements are similar to seven-FA measurements, and the standard deviations of T2s from two-FA measurements are reasonably small (Table 2). Preliminary in vivo results are given in Figure 3 and the in vivo T2 values were summarized in Table 2. Although there is a large variation in T2 between the two subjects, the differences in T2 values measured between the two-FA and seven-FA methods for the same subject are less than 5%.Discussion and Conclusion
The Monte Carlo simulations, phantom and preliminary in vivo results indicate that the scan time of the MARzss method can be greatly reduced by using minimum TR and two-FA measurements. Because in linear regression the variance of the slope is inversely proportional to the variance of independent variables4, a two-FA method with the largest separation in FA produces the highest precision. However, when FA is too large, the signal intensity of weak signals (e.g., glutamate) may become too small to be reliably determined. Therefore, there is an optimal set of FA values for maximizing both the accuracy and precision of the T2 measurement, which will be determined in our on-going study. Nevertheless, our current results have demonstrated that it is feasible to greatly shorten the overall scan time of the MARzss method without significantly compromising the quality of T2 measurements.Acknowledgements
This work was supported by the intramural research program of National Institute of Mental Health.References
1. Du F et al., Schizophr Res 2012;137:241-245.
2. Li L et al., Mag Reson Med doi: 10.1002/mrm.26941
3. An L et al., Mag Reson Med doi: 10.1002/mrm.26612
4. DeGroot MH et al., Probability and Statistics, 3rd ed., Addison Wesley, Boston, 2002.
Figures
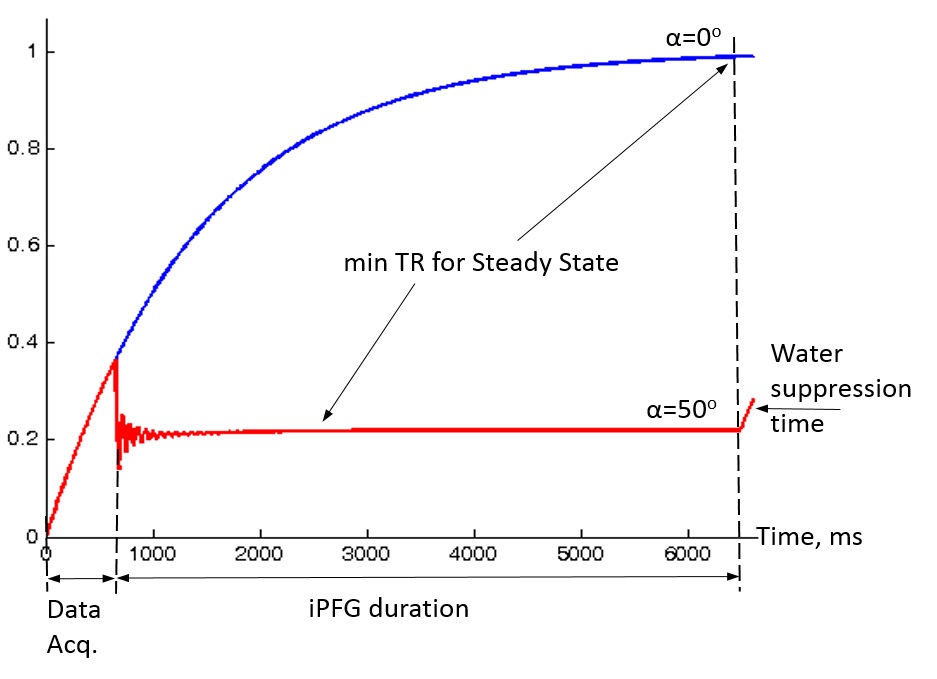
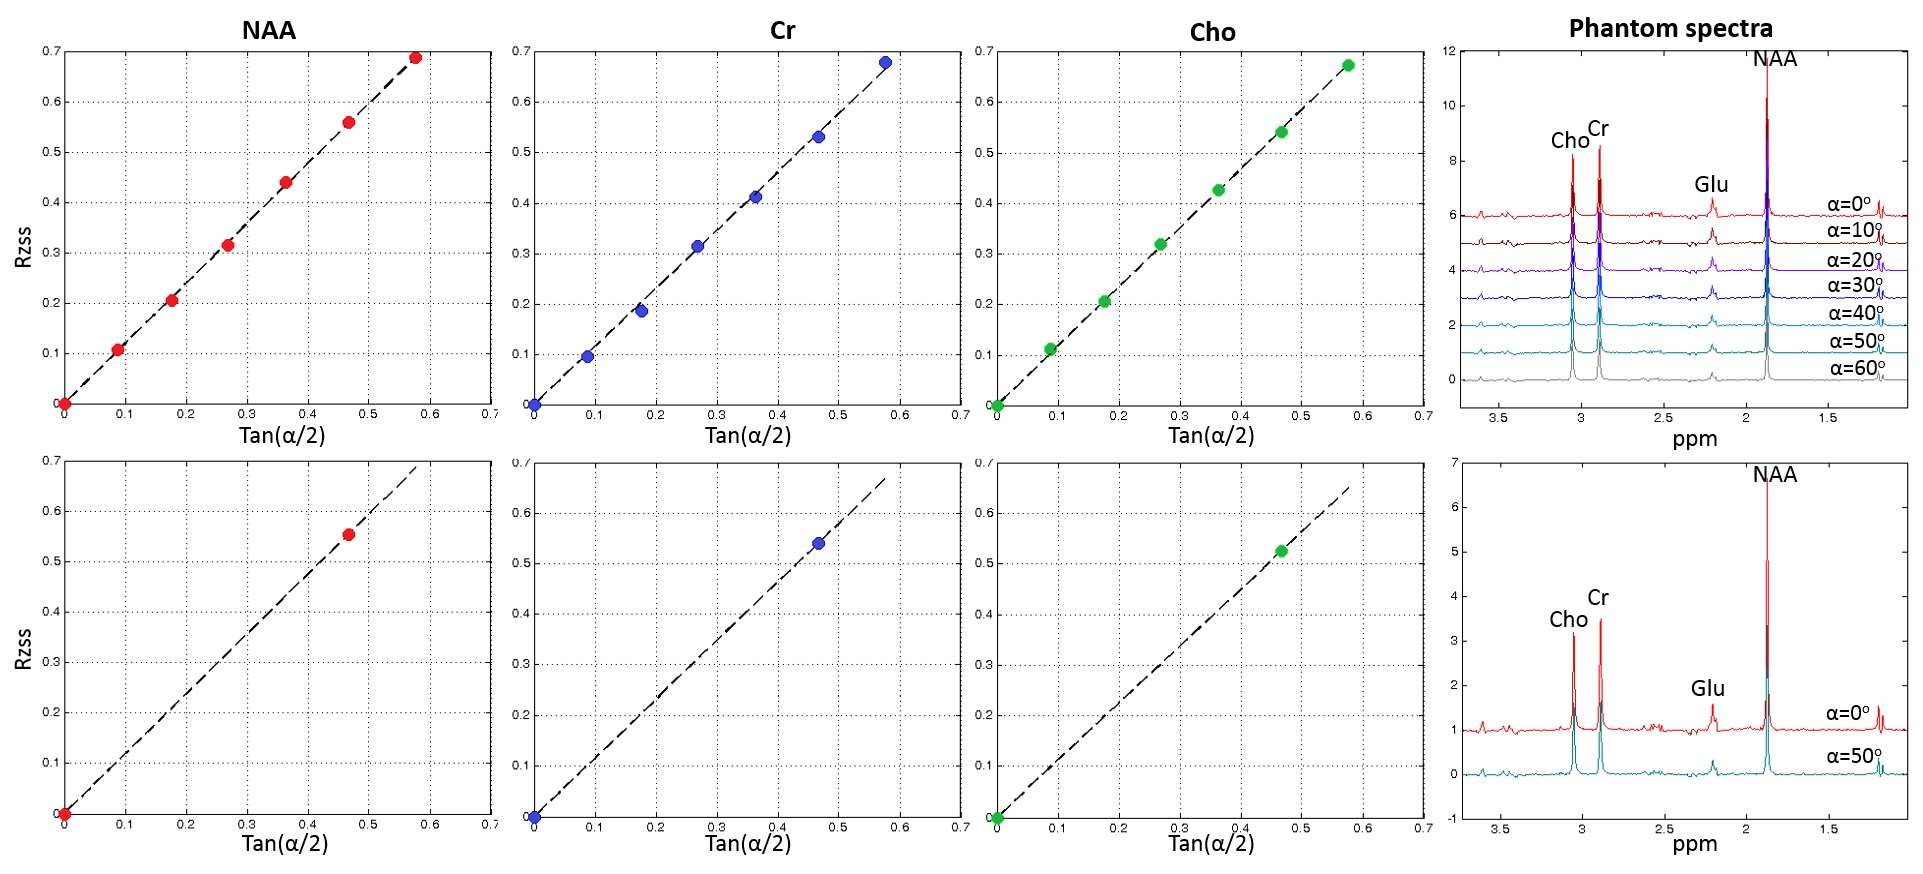
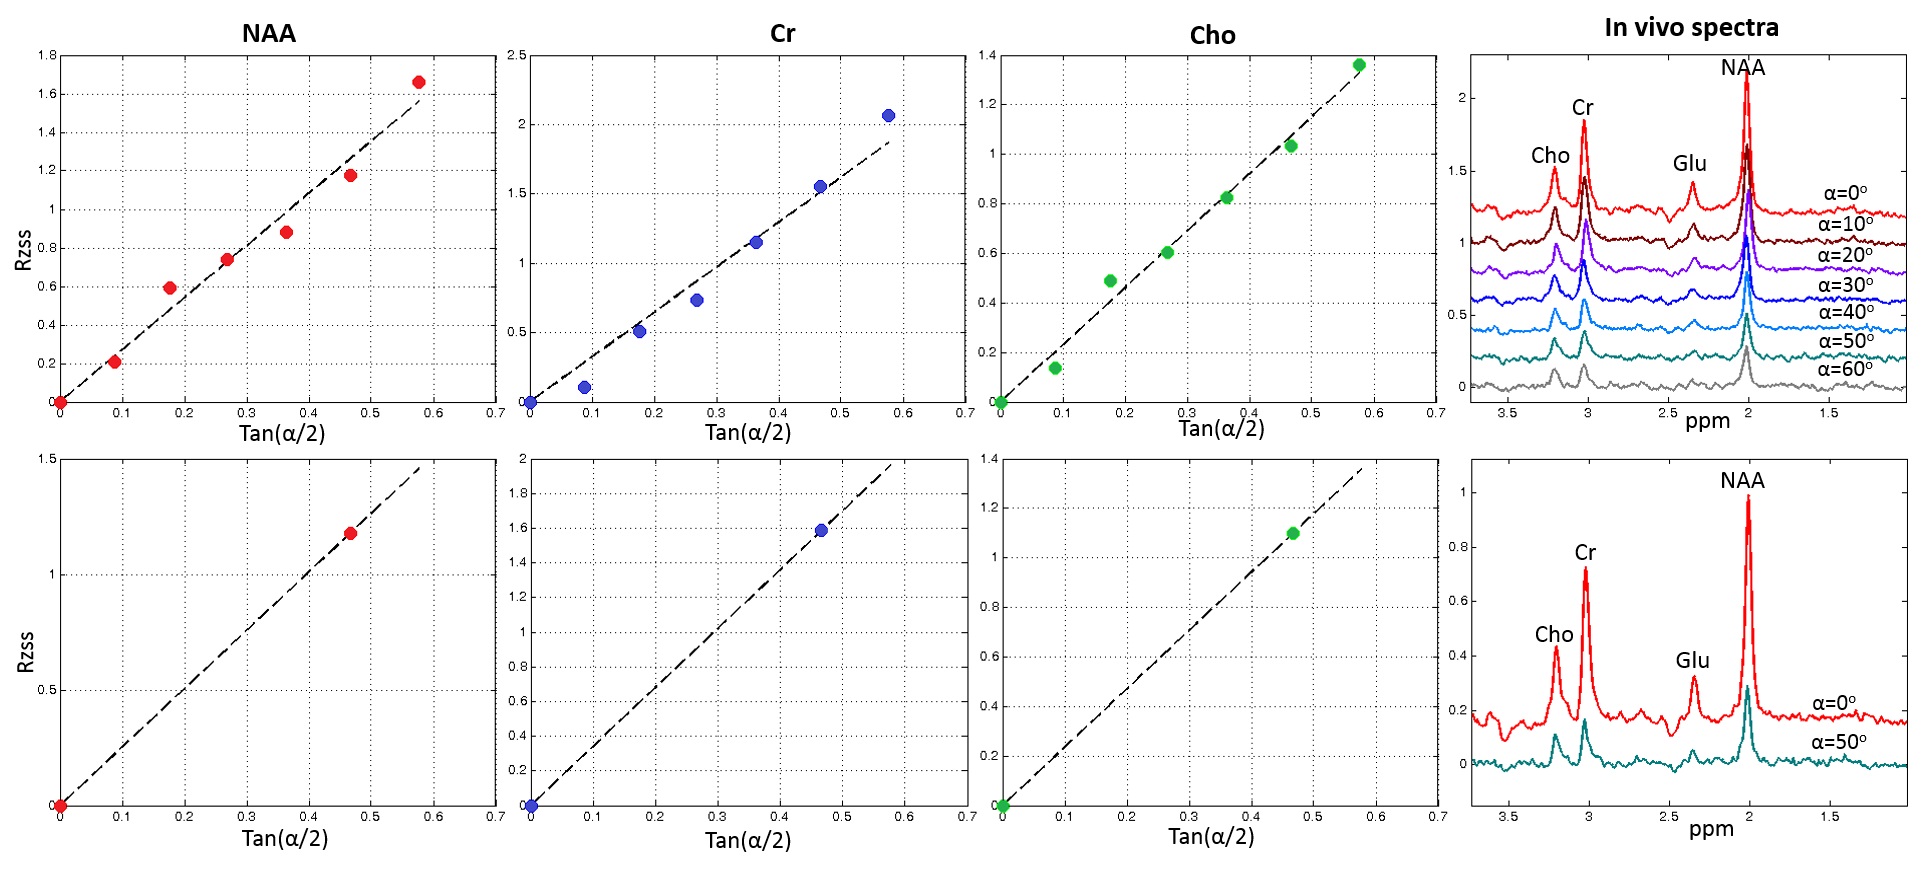
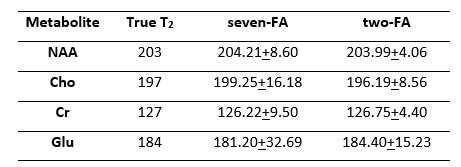
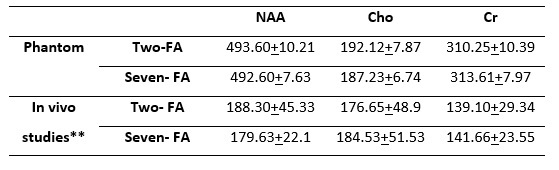
Table 2. Mean and standard deviation of phantom (n = 5) and in vivo (n = 2) T2 values*.
*The two-FA experiments used 18% of the scan time of the seven-FA experiments.
**The intrasubject differences in T2 between the two-FA and seven-FA measurements are less than 5%.