1289
Improving time resolution in the imaging of metabolic dynamics using Compressed Sensing from 2D Heteronuclear Multiple Quantum Coherence1Department of Systems Science, Kyoto University, Kyoto, Japan, 2Department of Applied Information Sciences, Tohoku University, Sendai, Japan
Synopsis
We propose a compressed sensing reconstruction method with high time resolution for imaging fast metabolic dynamics from sequential data measured using 2D 1H-13C heteronuclear multiple quantum coherence (HMQC) MRSI. Optimization using the alternating direction method of multipliers (ADMM) is employed to incorporate prior knowledge about the substance distribution.
The 2D-HMQC MRSI with pseudo-random undersampling is applied to tumor-bearing mice after the injection of [U-13C] glucose. From the resulting data, we successfully reconstruct time-series of the in vivo density of three substances (glucose, lactate, and fat) at a high time resolution of 2.25 min.
Introduction
We have previously reported a reconstruction method using compressed sensing from MRSI data using 2D 1H-13C heteronuclear multiple quantum coherence (HMQC).1 2D 1H-13C HMQC MRSI is a method for obtaining a two-dimensional spectrum including spatial information. We formulated our problem as an optimization problem to estimate the spatial distribution of substances using the prior knowledge that the temporal change in this distribution is sparse. However, the effect of the temporal change was not adequately considered because of limitations in the optimization method, and only time resolutions down to approximately 30 min were achieved.
In this research, we propose a reconstruction method to properly incorporate prior knowledge by improving the optimization method and reconstructing the metabolic dynamics of substances at high time resolutions.
Methods
We used compressed sensing to model the relationship between the HMQC measurement data and the spatio–temporal distribution of substances. We assumed that the spectrum $$$Φ$$$ at spatial position $$$(x, y)$$$ and frequency $$$(F_1, F_2)$$$ at time $$$t$$$ is represented by a linear combination of the base spectra $$$Φ_0$$$ of the substances and the density $$$S$$$ of the substance $$$p$$$, as
$$\Phi(F_1, F_2, x, y, t) = \sum_{p=1}^P\phi_0(F_1, F_2; p)S(x, y, t; p)$$
where $$$P$$$ is the number of substance types to be targeted. We write this relation in abstract form as $$$\Phi = \Phi_0 S$$$. Using compressed sensing with the prior knowledge that the spatial distribution of the substance and its temporal changes were sparse, the problem of estimating the substance density $$$S$$$ from the actual measurement data $$$K$$$ was formulated as follows.
$$\min_{S}\left( \frac{1}{2}\left|\left|K- \mathcal{U}\mathcal{F} (\Phi_0 S)\right|\right|_2^2 + \lambda_{\mathrm{s}} \left|\left|S\right|\right|_1 + \lambda_{\mathrm{fd}} \left|\left|DS\right|\right|_1\right)$$
Here, $$$\mathcal{U}$$$ denotes the undersampling operator, $$$\mathcal{F}$$$ denotes the discrete Fourier transform operator, and $$$D$$$ denotes an operator for calculating the differences between adjacent time frames. $$$\lambda_{\mathrm{s}}$$$ and $$$\lambda_{\mathrm{fd}}$$$ are regularization parameters, and $$$\left|\left|DS\right|\right|_1$$$ is called the total variation of $$$S$$$ along the time dimension.
To solve this problem, we used the alternating direction method of multipliers (ADMM) optimization method,2 which can handle the total variation. The optimization was carried out by dividing the total number of time frames into $$$T$$$ blocks and rewriting the cost function as follows for each time frame $$$t$$$.
$$\min_{S, r}\left\{ \sum_{t=1}^{T} \left( \frac{1}{2}\left|\left|K^t- \mathcal{U}^t \mathcal{F}^t (\Phi_0^t S^t)\right|\right|_2^2 + \lambda_{\mathrm{s}} \left|\left|S^t \right|\right|_1 \right) + \lambda_{\mathrm{fd}} \sum_{t=1}^{T-1} \left|\left|r^t \right|\right|_1 \right\}$$
$$\mathrm{s.t.} \;\; r^t = S^{t+1} - S^t $$
For MR measurements, preclinical 7T MR system (Bruker BioSpin) and a double resonant 1H/13C transmit-receive volume coil were used. We employed 2D MRSI pulse sequence incorporating 1H-13C HMQC and signals were collected for 7 h with a sampling pattern based on the Sobol sequence, which is a set of quasi-random numbers. The following experimental parameters were used: TR/TE = 990/9.6 ms, 8 and 16 phase encoding steps for $$$k_x$$$ and $$$k_y$$$ dimensions as spatial resolution, respectively, FOV = $$$4\times8$$$ cm2, coronal orientation without slice selection, 256 complex points with an $$$F_2$$$ bandwidth of 2000 Hz (1H direction), 32 points with an $$$F_1$$$ bandwidth of 8000 Hz (13C direction), and 4-step phase cycling. Under these imaging conditions, in the case of conventional full sampling, the imaging time is about 4.5 h. The 13C-labeled glucose was intraperitoneally administered to a tumor-bearing mouse after the scan had begun. In the present study, we focused on three substances: glucose, lactate, and fat.
Results and Discussion
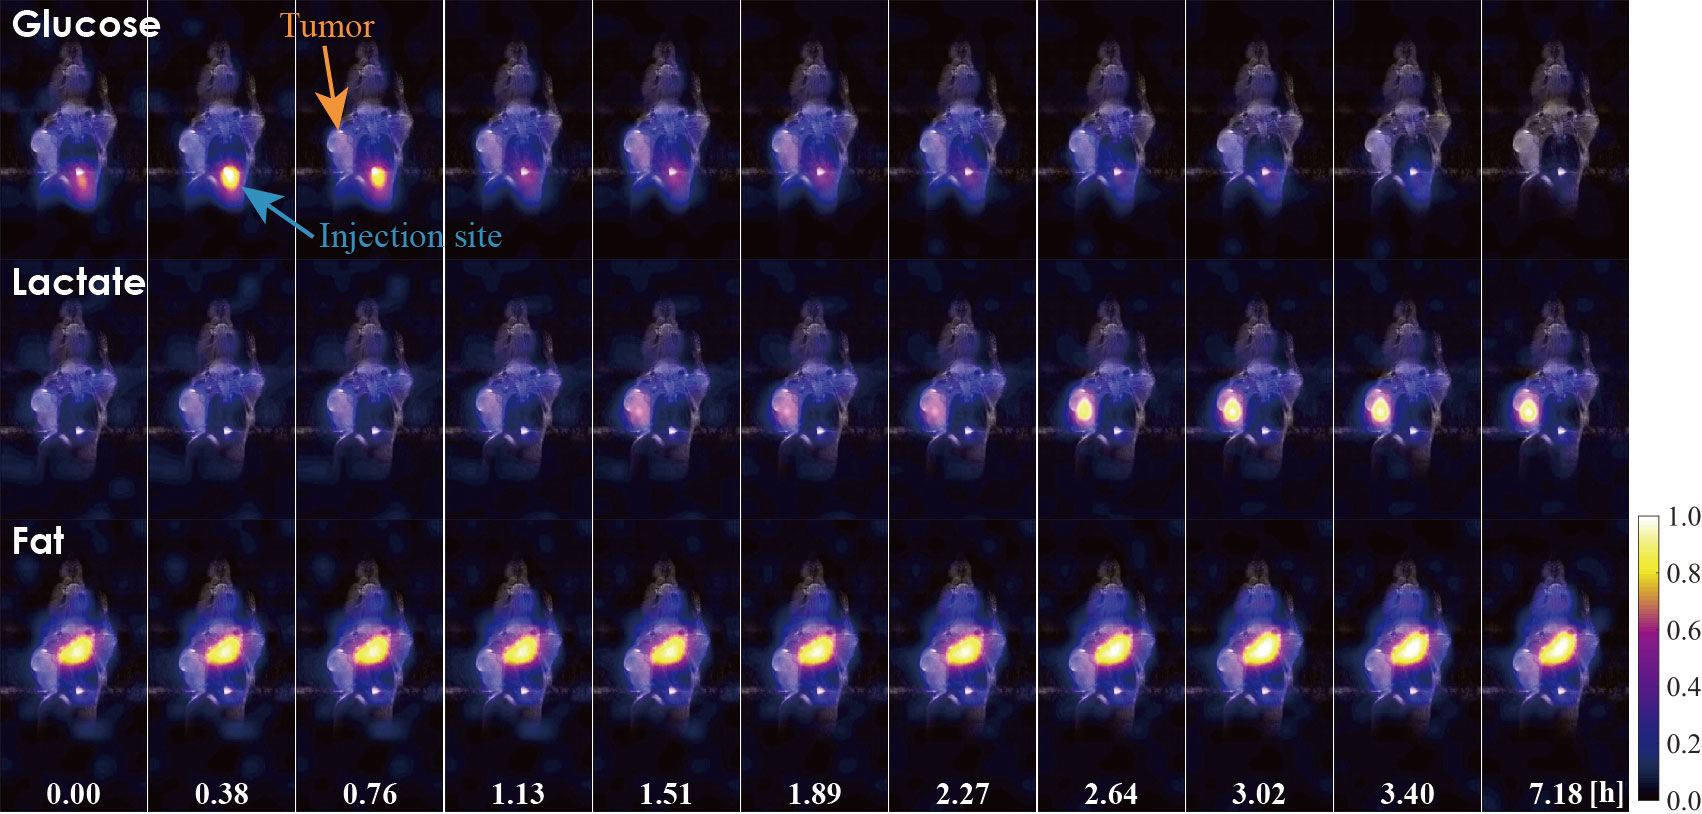
We achieved time-series reconstruction of the three substances simultaneously with a time resolution of 2.25 min. The whole scan used a total of 200 time frames. The estimated results of eleven time frames are shown in Fig. 1. The spatial distribution in each time frame is illustrated as a color map with an anatomical image of the mouse. The elapsed time from the beginning of the scan is shown in the bottom of the figure. The reduction in glucose and accumulation of lactate in the tumor area were successfully observed; this is regarded as the Warburg effect.3 The density of the fat remained constant over time because the fat is not involved in this effect.Conclusion
Applying the method proposed in this study to HMQC MRSI data, we reconstructed metabolic dynamics with a high time resolution. This reconstruction method enabled the detection of fast temporal changes of the spatial distribution of substances in vivo.Acknowledgements
This work was supported by Grant-in-Aid for Scientific Research on Innovative Areas, ‘Initiativefor high-dimensional data-driven science through deepening sparsemodeling’, Grant Number: JP25120008, and Japan Society for the Promotion of Science(JSPS) Grant-in-Aid for Young Scientists (B), Grant Number: JP16K16407.References
1. Imai H, Sano K, Momma S, et al. Imaging of Tumor Glycolysis with 2D Heteronuclear Multiple Quantum Coherence: Accelerated Acquisitions using Compressed Sensing. Proc. ISMRM 2015: 4721.
2. Wahlberg B, Boyd S, Annergren M, et al. An ADMM Algorithm for a Class of Total Variation Regularized Estimation Problems. Proc. 16th IFAC Symp. Syst. Ident. 2012;45(16): 83-88.
3. Vander Heiden M G, Cantley L C, Thompson C B. Understanding the Warburg effect: the metabolic requirements of cell proliferation. Science. 2009;324(5930): 1029-1033.
Figures