1286
Simultaneous MRSI of GABA and glutathione using HERMES spectral editing at 3T1Biomedical Engineering, Johns Hopkins School of Medicine, Baltimore, MD, United States, 2Russell H. Morgan Department of Radiology and Radiological Science, Johns Hopkins School of Medicine, Baltimore, MD, United States, 3F. M. Kirby Research Center for Functional Brain Imaging, Kennedy Krieger Institute, Baltimore, MD, United States
Synopsis
HERMES with single-voxel PRESS localization has been used to simultaneously edit multiple compounds. It’s often desirable to measure spectra from multiple brain regions, using MR spectroscopic imaging (MRSI). This study examined the feasibility of HERMES editing of GABA and GSH with a PRESS-localized MRSI sequence at 3T, and compared it to conventional MEGA-edited MRSI acquisitions. It’s found that adding symmetrical lipid suppression pulses to HERMES allows the sequence to be used in vivo and has an editing efficiency equivalent to that of separate acquisitions of GABA and GSH using MEGA-PRESS MRSI without an increase in measurement variability relative to MEGA-PRESS.
Purpose
HERMES allows the simultaneous editing of multiple metabolites. HERMES with single-voxel (SV) PRESS localization has been used to simultaneously edit two (glutathione (GSH) and GABAor N-acetylaspartate (NAA) and N-acetylaspartylglutamate (NAAG)), or three compounds (such as NAA, NAAG, and aspartate) (1-3). It is often desirable to measure spectra from multiple brain regions, using MR spectroscopic imaging (MRSI). This study examined the feasibility of HERMES editing of GABA and glutathione (1) with a PRESS-localized MRSI sequence at 3T, and compared it to conventional MEGA-edited MRSI acquisitions.Methods
All experiments were performed using a Philips Achieva 3T scanner with a 32-channel head coil. Common parameters for all MRSI acquisitions included: 20-ms sinc-Gaussian editing pulses; TE/TR = 80 ms/1.5s; VAPOR water suppression (4). Separate water-unsuppressed reference scans with one average were also acquired for coil combination and phasing information.
HERMES and MEGA-PRESS (5) MRSI experiments were performed in three 1L phantoms: 10 mM GABA; 10 mM GSH; and both. For GABA MEGA-PRESS, the edit-ON and edit-OFF frequencies were 1.9 ppm and 7.5 ppm, respectively. For GSH MEGA-PRESS, the edit-ON and edit-OFF frequencies were 4.56 ppm and 7.5 ppm, respectively. For HERMES, the editing pulse frequency combinations used were: 4.56/1.9; 4.56; 1.9; and 7.5 ppm respectively. One 20-mm slice was recorded with 2 cm3 voxels. Root-mean-squared (RMS) crosstalk values (i.e. the percentage of the ‘unwanted’ molecule signal in the reconstruction of the signal of the desired molecule) were calculated.
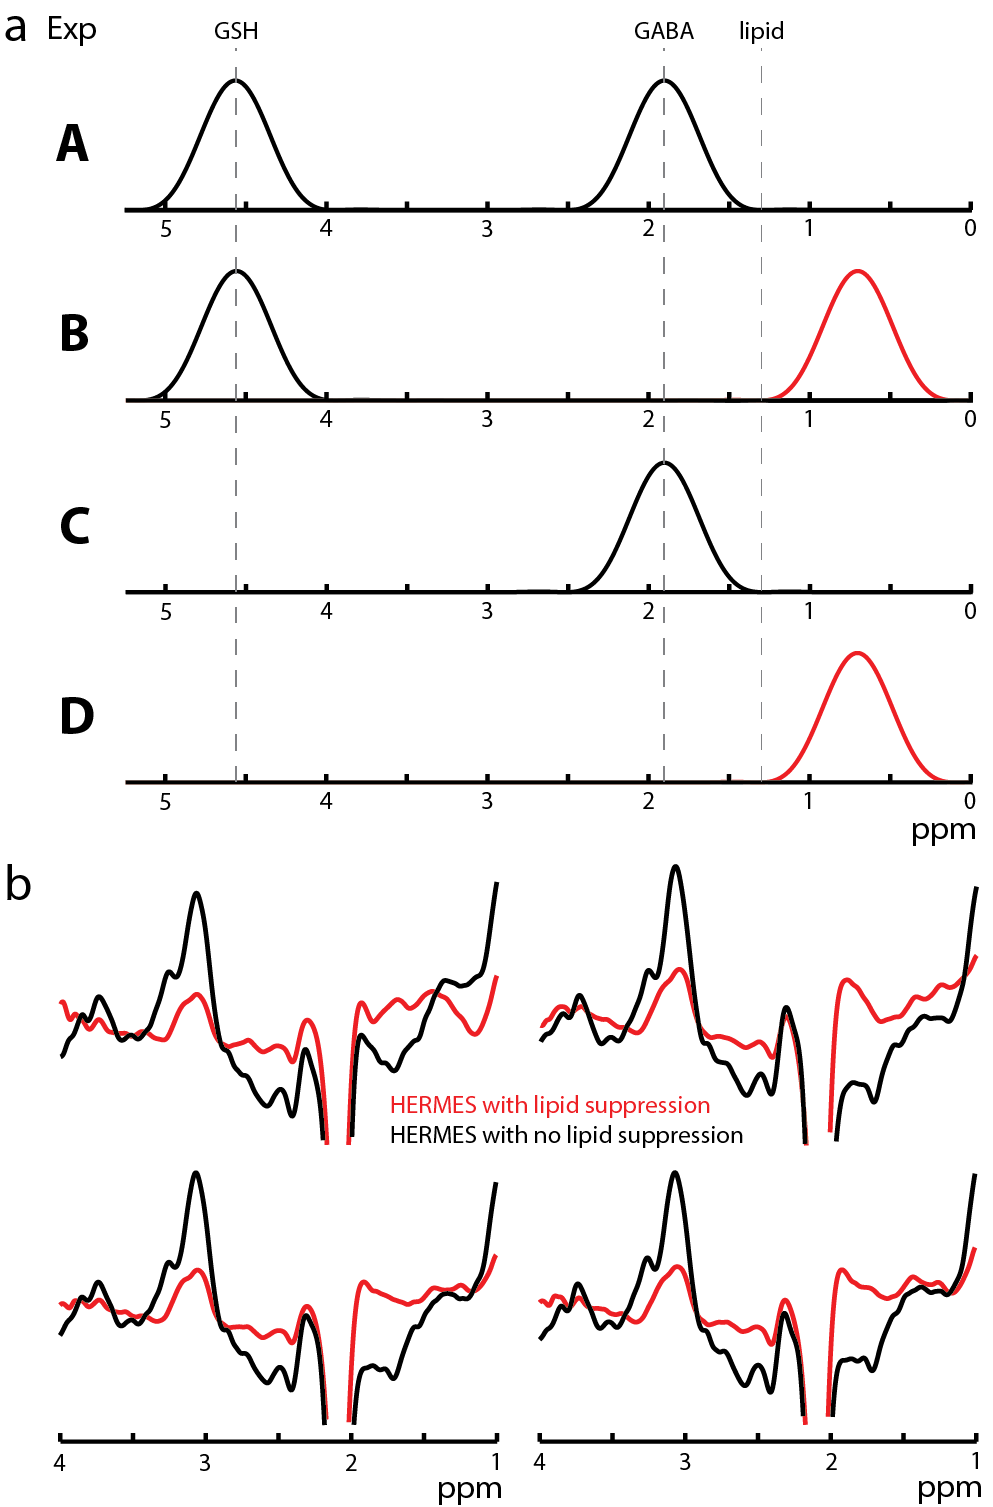
Edited MRSI experiments were performed in 5 healthy adults (4 male; age 28 ± 3 years). One 20-mm slice was recorded with a field of view of 180x210 mm2, 12x14 phase encoding matrix, and 4.5 cm3 voxels for a scan duration of 13 minutes. For GABA+ MEGA-PRESS, the edit-OFF pulse was moved to 0.7 ppm, i.e. symmetric about the 1.3 ppm lipid resonance relative to the 1.9 ppm edit-ON GABA+ pulse, to reduce co-edited lipid. HERMES GABA+/GSH was modified to include 0.7 ppm lipid suppression pulses in the GABA-OFF sub-acquisitions (Figure 1a).
Peak areas of the ~3 ppm GABA+ and GSH were estimated using a single-Gaussian model. The voxel-by-voxel peak area ratio between HERMES and MEGA-PRESS was calculated for each subject to assess measurement bias. Linear regression of the GABA+/water integral ratio and gray matter (GM) fraction was performed in two subjects. To compare reliability between methods, the coefficient of variation (CV) was calculated for each subject as the standard deviation of the water-normalized GABA+ and GSH integrals over the mean for voxels in the PRESS volume-of-interest (VOI) for both HERMES and MEGA.
Results
Phantom experiments (data not shown) indicate that HERMES and MEGA-edited GABA and GSH signals and multiplet patterns were equivalent across the VOI. In addition, GABA and GSH were well segregated with minimal RMS crossover values of 13.5% ± 5.3% (GABA-only phantom) and 9.5% ± 4.5% (GSH-only phantom).
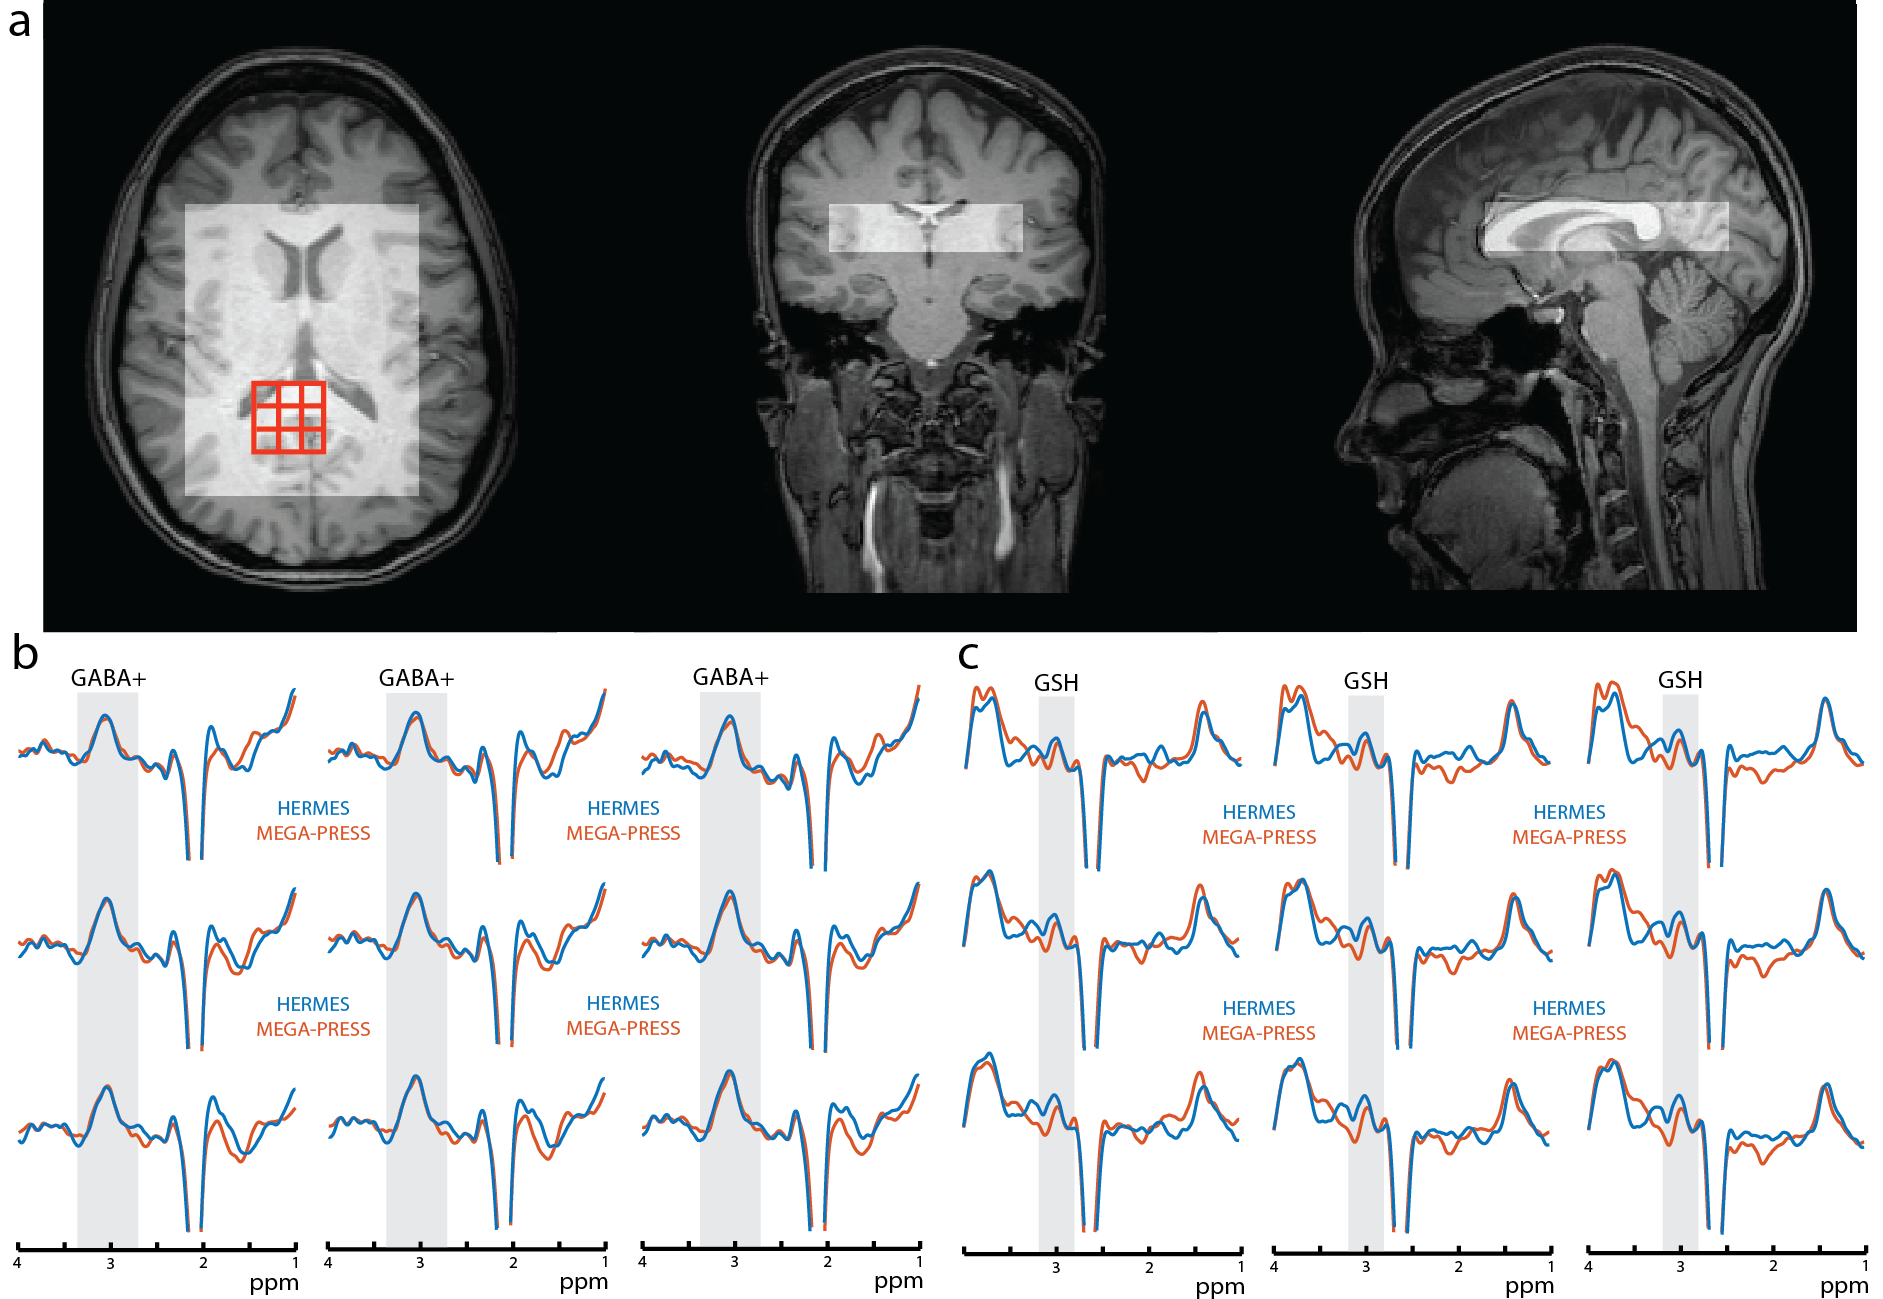
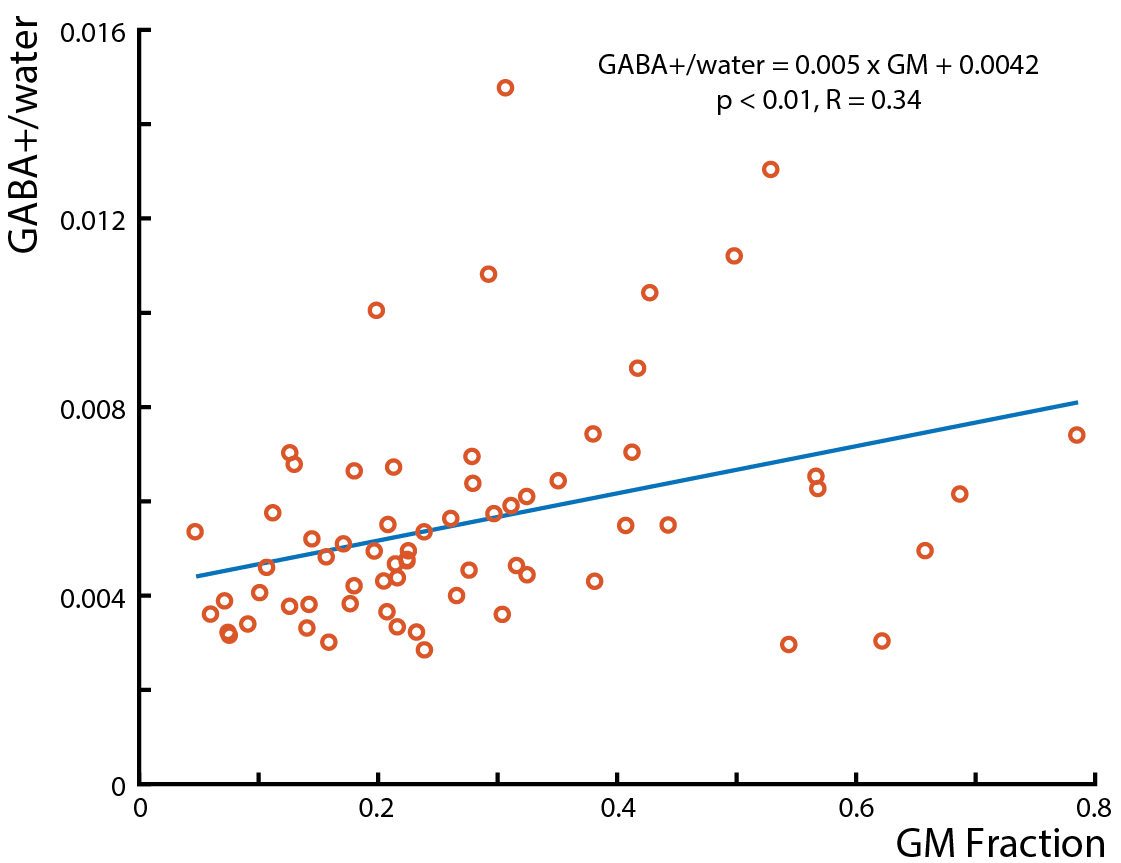
Example in vivo spectra taken from HERMES acquisitions with the GABA+ ‘OFF’ pulses at 7.5 ppm and 0.7 ppm are shown in Figure 1b. Without symmetric lipid suppression, significant artifacts appear in the GABA-edited spectrum. Figure 2a shows the PRESS VOI placement. Figures 2b and 2c show representative GABA+ and GSH spectra for both HERMES and MEGA acquisitions; very similar spectra are recorded using both methods. The median voxel-by-voxel HERMES/MEGA metabolite ratios are close to one with an average ± standard deviation of 1.18 ± 0.23 for GSH and 0.94 ± 0.09 for GABA. The interquartile ranges are significantly larger for GSH, however, indicating a less consistent measurement than GABA+. The two methods have comparable reliability with average GABA+ CVs of 38.4% and 42.4% for HERMES and MEGA, respectively and GSH CVs of 73.6% and 72.6% for HERMES and MEGA respectively. Linear regression of the HERMES GABA+/water integrals versus GM fraction (Figure 3) indicates ~2.2 times more GABA+/water in gray matter than in white matter, in agreement with literature values (6-9).
Discussion
HERMES GABA+/GSH MRSI at 3T is feasible in vivo if symmetrical GABA+ editing pulses are included in the sequence to suppress unwanted lipid resonances. The origin of the artifact is not clear, but appears to be coupled lipid resonances at approximately 3.0 and 1.3 ppm respectively.
The advantage of HERMES- over conventional MEGA-editing is that it can acquire the same data in half the scan time, without an increase in measurement variability. In the current example, GABA+/GSH MRSI data were acquired in 13 minutes using HERMES, as opposed to 26 min using MEGA MRSI. The combination of HERMES encoding with MR spectroscopic imaging is a promising method for mapping the distribution of multiple low-concentration compounds.
Acknowledgements
This work was supported by P41 EB015909.References
1. Chan KL et al. Magn. Reson. Med. 2016;19:11–19.
2. Saleh MG et al. NeuroImage 2016;142:576-582.
3. Chan KL et al. NeuroImage 2017;155:587–593.
4. Tkáč I et al. Magn. Reson. Med. 1999;41:649–656.
5. Mescher M et al. NMR Biomed. 1998;11:266–272.
6. Harris AD et al. 2015;42:1431–1440.
7. Jensen JE et al. 2005;18:570–576.
8. Choi C et al. 2007;58:27–33.
9. Mikkelsen M et al. NMR Biomed. 2016;29:1644–1655.
Figures