1283
Glycine quantification via S-PRESS difference editing of myo-inositol1Dept. of Radiology, Medical Physics, Medical Center - University of Freiburg, Faculty of Medicine, Freiburg, Germany
Synopsis
The quantification of glycine (Gly) with in vivo MRS is challenging due to the strong spectral overlap with myo-inositol (mI) so that only the concentration sum mI+Gly can be accurately measured with standard MRS methods at clinical field strengths. In this work, the distinction and quantification of mI and Gly is demonstrated with S-PRESS difference editing, which enables unequivocal detection of the strongly coupled mI resonances through suppression of the overlapping uncoupled Gly resonance.
Introduction
The quantification of glycine (Gly) with in vivo MRS is challenging due to the strong spectral overlap with myo-inositol (mI) so that only the concentration sum mI+Gly can be accurately measured with standard MRS methods at clinical field strengths. In this work, distinction and quantification of mI and Gly is demonstrated with S-PRESS difference editing1,2, which enables unequivocal detection of the strongly coupled mI resonances through suppression of the overlapping uncoupled Gly resonance.Methods
The single-voxel S-PRESS sequence was implemented on a Prisma 3T system (Siemens Healthineers, Germany), enabling an interleaved spectral acquisition of two shots with constant total echo time TE but different partial echo times TE1 and TE2. The S-PRESS editing scheme was optimized for mI detection with numerical simulations3, varying TE between 26 and 200 ms and simulating all possible combinations of TE1 and TE2. Assuming T2 = 197 ms for mI4, the parameter set with maximum signal yield (area) of mI in the difference spectrum was determined. With the optimized parameters, S-PRESS data were acquired from a grey matter (GM) dominant voxel in the medial occipital (MO) cortex and a white matter (WM) dominant voxel in the left parietal (LP) cortex of five healthy subjects. From the acquired data, sum and difference spectra were calculated. Using LCModel fitting5 with numerically simulated metabolite basis sets, the concentration sum mI+Gly as well as concentrations of other major brain metabolites were quantified from the sum spectrum, using a concomitantly acquired water reference spectrum for absolute quantification. The mI concentration was determined from the difference spectrum and the Gly concentration was then calculated as the difference between the measured mI+Gly and mI concentrations, using total NAA (tNAA=NAA+NAAG), which is coedited in the difference spectrum, as a concentration reference:
$$\left[Gly\right]=\left[mI+Gly\right]_{sum}-\frac{\left[tNAA\right]_{sum}}{\left[tNAA\right]_{diff}}\cdot\left[mI\right]_{diff}$$
Metabolite concentrations were corrected for relaxation effects with relaxation constants obtained from literature. For Gly T2 = 197 ms (same as mI) was assumed.
Results
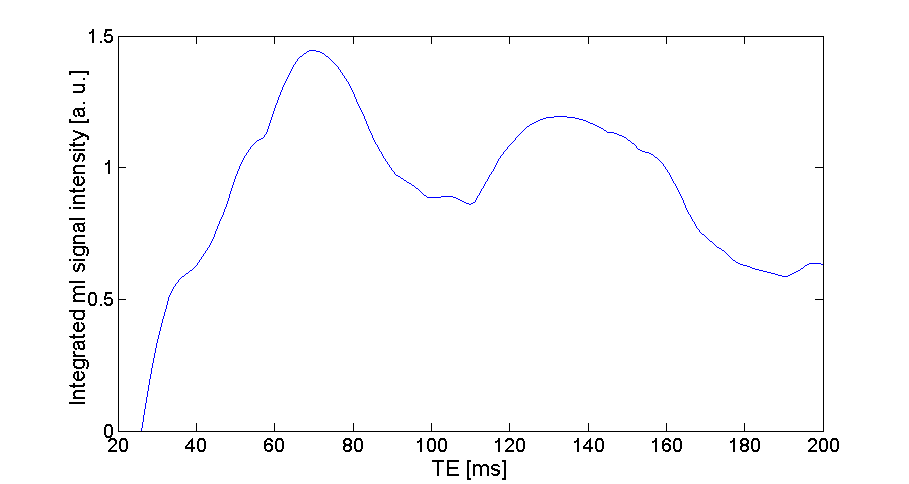
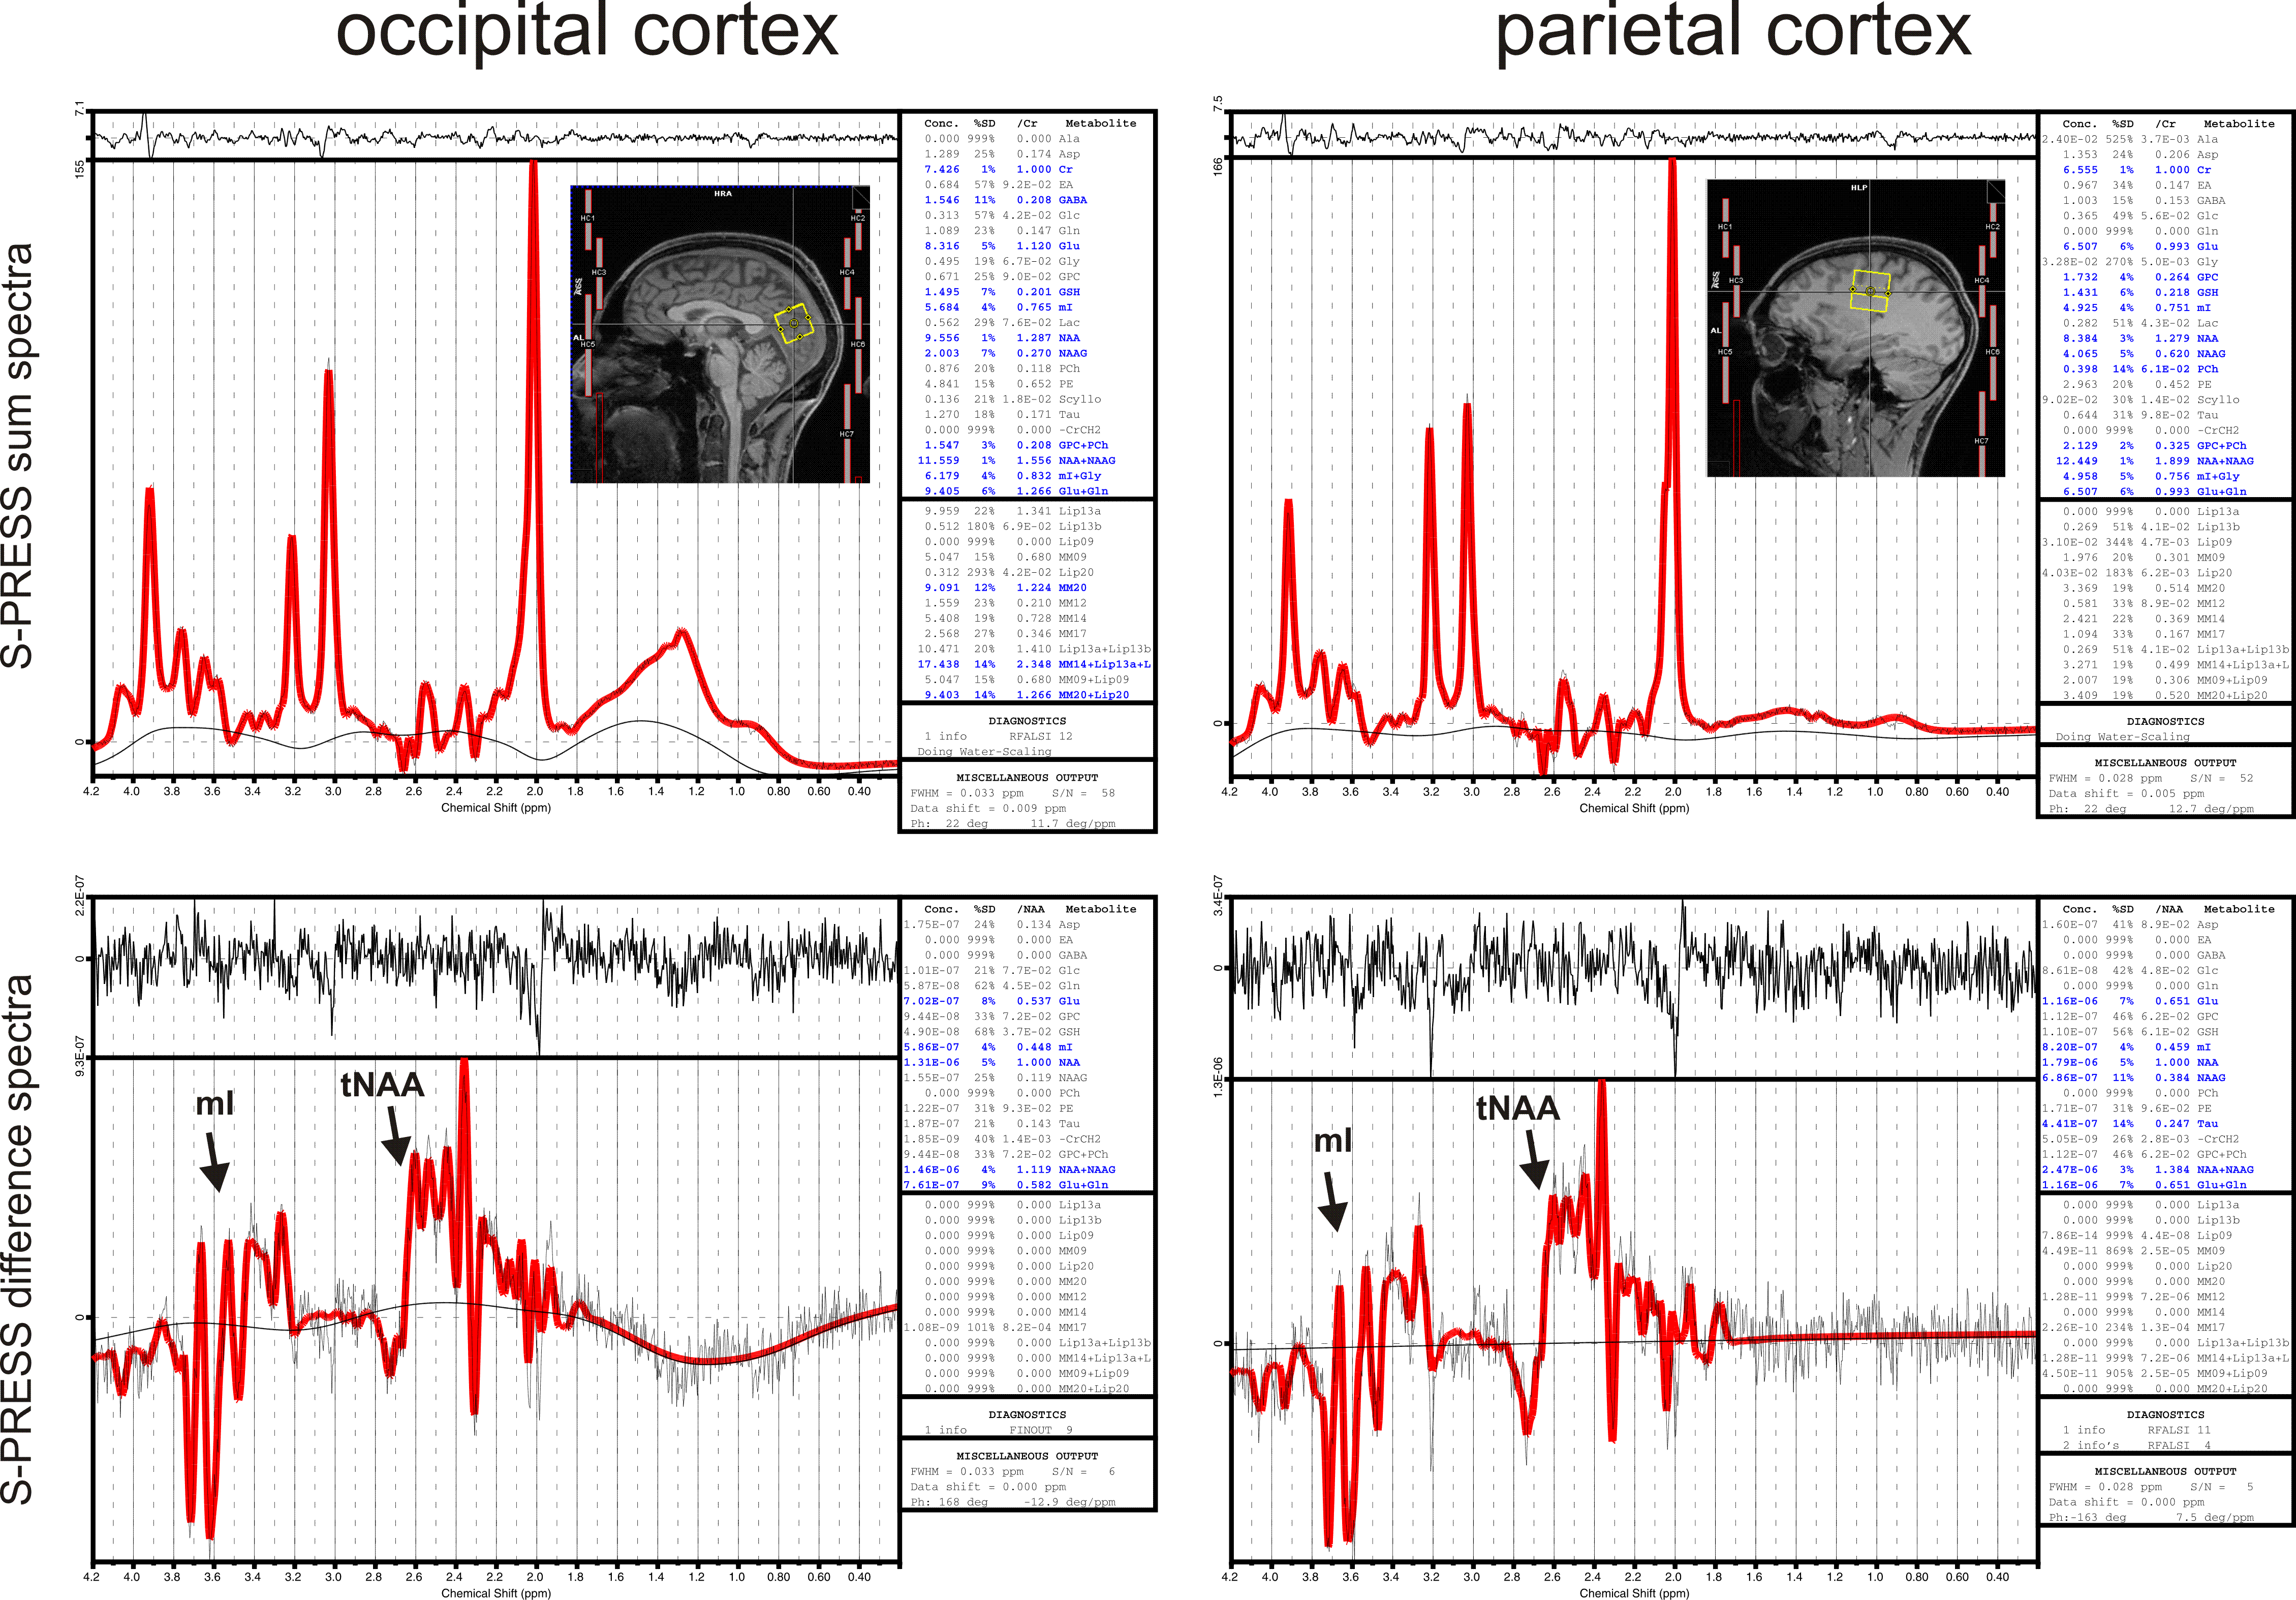
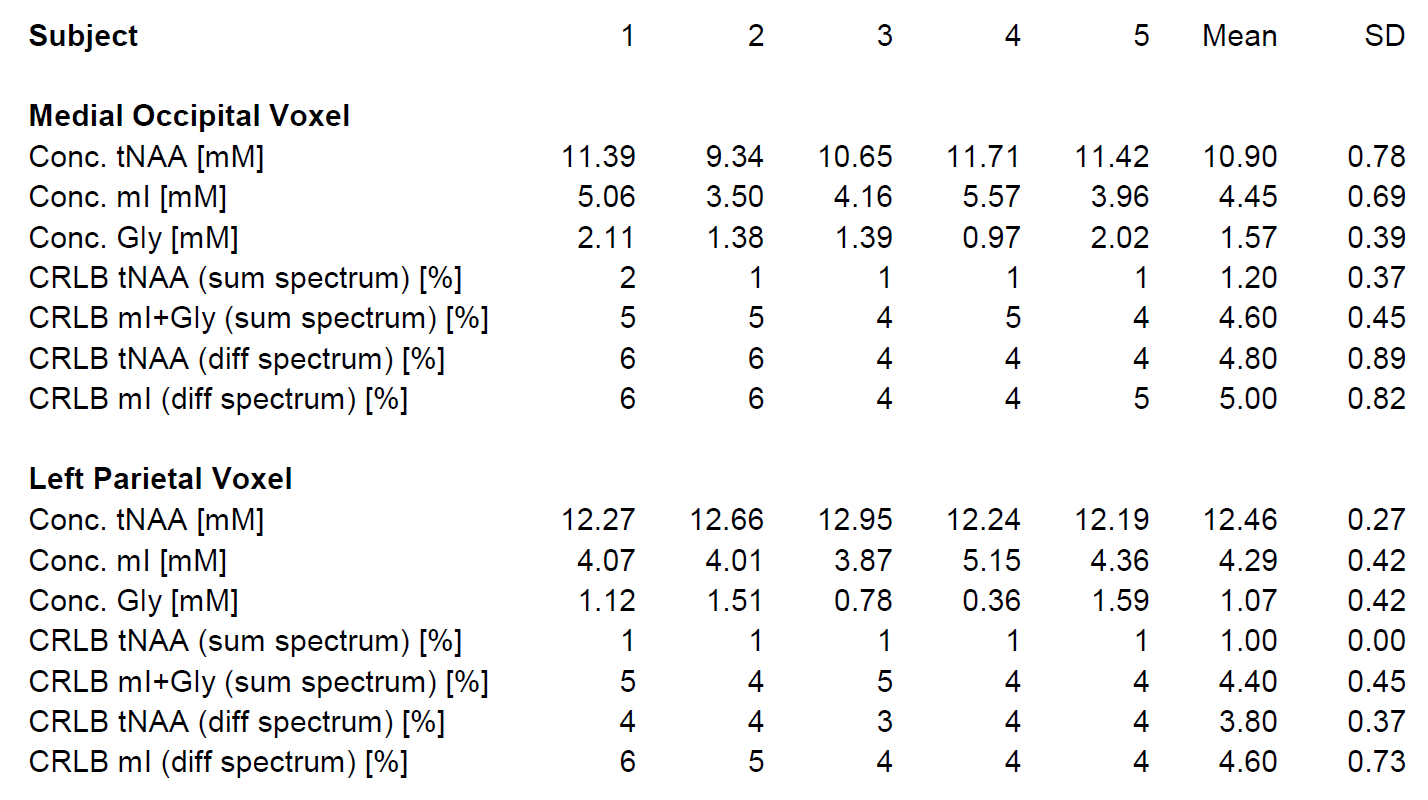
Figure 1 shows the optimal signal yield of mI, derived from simulated S-PRESS difference spectra, as a function of TE, suggesting an optimal echo time of 70 ms. Partial echo times of [TE1,TE2] = [11,59] and [39,31] ms turned out to be optimal for the two shots. S-PRESS sum and difference spectra from the occipital and parietal cortices are presented in Fig. 2, along with the LCModel fits and quantification results. Figure 3 shows the mI and Gly concentrations as measured in the five healthy subjects along with the Cramér-Rao lower bounds (CRLBs) as determined by LCModel. Significantly different mean Gly concentrations of 1.57 mM (MO) and 1.07 mM (LP) were obtained for the two brain regions (p = 0.05).Discussion
While a proper distinction of Gly and mI is not possible with standard MRS methods at clinical field strengths, robust Gly quantification has been demonstrated with dedicated PRESS sequences based on TE1/TE2 optimisation6 and triple refocusing7 for suppression of the mI resonances in the vicinity of the Gly resonance at 3.55 ppm. However, these techniques require echo times of 160 ms and 134 ms, respectively, giving rise to substantially reduced sensitivity due to T2 relaxation. The proposed S-PRESS scheme with an intermediate TE = 70 ms suffers only moderate T2 losses compared to short-TE PRESS. Furthermore, quantification of other typically detectable brain metabolites in the S-PRESS sum spectrum is not compromised by frequency-selective pulses as with many other spectral editing techniques. The measured Gly concentrations are in the upper limit of concentrations reported in literature7-10. However, variations among studies can be partly explained with the different echo times used and the unknown T2 relaxation constant of Gly, which hampers proper relaxation correction. The higher Gly concentration measured in the MO cortex compared to the LP cortex agrees with results obtained by Tiwari et al. whereas the substantial mI concentration difference reported in that work was not observed in our study7. In all S-PRESS difference spectra, mI and tNAA could be quantified with CRLBs of approximately 5%. However, a larger inter-subject variation was observed for the Gly concentration compared to the study performed by Tiwari et al.. It should be noted that with our method the Gly concentration is calculated as a relatively small difference of two larger concentrations (mI+Gly and mI) and therefore even smaller relative error margins in the measured quantities can translate into large relative error margins in the derived quantity. Yet, the proposed S-PRESS approach might be a viable alternative for studies where several (including short-T2) metabolites are to be quantified simultaneously and a long echo time is therefore to be avoided.Acknowledgements
This work was funded in part by NIH grant 2R01DA021146 and in part by the Deutsche Forschungsgemeinschaft (DFG, German Research Foundation, contract grant numbers: LA 3353/2-1 and LA 3353/4-1).References
1. Gambarota G, van der Graaf M, Klomp D, Mulkern RV, Heerschap A. Echo-time independent signal modulations using PRESS sequences: A new approach to spectral editing of strongly coupled AB spin systems. J. Magn. Reson. 2005;177:299–306.
2. Snyder J, Thompson RB, Wilman AH. Difference spectroscopy using PRESS asymmetry: application to glutamate, glutamine, and myo-inositol. Nmr Biomed. 2010;23:41–47. doi: 10.1002/nbm.1424.
3. Simpson R, Devenyi GA, Jezzard P, Hennessy TJ, Near J. Advanced processing and simulation of MRS data using the FID appliance (FID-A)-An open source, MATLAB-based toolkit: The FID-A Toolkit for MRS Processing and Simulation. Magn. Reson. Med. 2017;77:23–33. doi: 10.1002/mrm.26091.
4. Ganji SK, Banerjee A, Patel AM, Zhao YD, Dimitrov IE, Browning JD, Brown ES, Maher EA, Choi C. T2 measurement of J-coupled metabolites in the human brain at 3T. Nmr Biomed. 2012;25:523–529. doi: 10.1002/nbm.1767.
5. Provencher SW. Estimation of Metabolite Concentrations from Localized in-Vivo Proton Nmr-Spectra. Magn. Reson. Med. 1993;30:672–679.
6. Choi C, Ganji SK, DeBerardinis RJ, Dimitrov IE, Pascual JM, Bachoo R, Mickey BE, Malloy CR, Maher EA. Measurement of glycine in the human brain in vivo by 1H-MRS at 3 T: application in brain tumors. Magn. Reson. Med. 2011;66:609–618. doi: 10.1002/mrm.22857.
7. Tiwari V, An Z, Ganji SK, Baxter J, Patel TR, Pan E, Mickey BE, Maher EA, Pinho MC, Choi C. Measurement of glycine in healthy and tumorous brain by triple‐refocusing MRS at 3 T in vivo. NMR Biomed. [epub] 2017. doi: 10.1002/nbm.3747.
8. Ganji SK, Maher EA, Choi C. In vivo 1 HMRSI of glycine in brain tumors at 3T: 1 H MRSI of Glycine at 3T. Magn. Reson. Med. 2016;75:52–62. doi: 10.1002/mrm.25588.
9. Gambarota G, Mekle R, Xin L, Hergt M, van der Zwaag W, Krueger G, Gruetter R. In vivo measurement of glycine with short echo-time 1H MRS in human brain at 7 T. Magn. Reson. Mater. Phys. Biol. Med. 2009;22:1–4. doi: 10.1007/s10334-008-0152-0.
10. Prescot AP, Frederick B deB, Wang L, Brown J, Jensen JE, Kaufman MJ, Renshaw PF. In vivo detection of brain glycine with echo-time-averaged1H magnetic resonance spectroscopy at 4.0 T. Magn. Reson. Med. 2006;55:681–686. doi: 10.1002/mrm.20807.
Figures