1282
Finger tapping induces lactate increase in the human motor cortex detected by J-edited 1H-MRS at 4T1MRRC, Yale University, New Haven, CT, United States
Synopsis
While functional MRI (fMRI) localizes regions of activation, functional MRS (fMRS) provides metabolic response to activation. fMRS, using short echo-time (TE) non-edited 1H-MRS protocols, has been shown to be capable of detecting a lactate increase in sensory-induced activations. Because short TE non-edited lactate spectra are susceptible to functional hyperemia and contamination from lipids/macromolecules, we posited if long TE J-edited 1H-MRS detection of lactate can reliably detect metabolic changes in the motor cortex (MC) during the standard finger-tapping paradigm. Our fMRS results at 4T showed significant physiological modulation of the MC lactate level.
Introduction
While functional MRI (fMRI) is used to localize regions of activation, functional MRS (fMRS) provides metabolic response to functional activation. fMRS, using short echo-time (TE) non-edited 1H-MRS protocols, has detected robust lactate increase in sensory-induced activations1-3. Given that short TE non-edited 1H-MRS is susceptible to functional hyperemic effects as well as contamination from signals attributed to lipids and macromolecules, we posited if long TE J-edited 1H-MRS4 can reliably detect lactate changes.Methods
Ten healthy volunteers (right-handed, 9 male, 1 female, age 36.5±3.8) participated in the experiment that consisted of one fMRI run and 2-4 fMRS runs spanned over 2-4 days (in total 28 runs, 2.8±0.2 runs per subject). The fMRI run consisted of five 97s regulation blocks that were interleaved with five 97s baseline blocks (16.2min). The fMRS run consisted of three 5min finger-tapping blocks interleaved with three 5min fixation blocks (30min). Subjects were asked to perform the visually-cued finger tapping at a rate of 3Hz. Flashing numbers from 1 to 4 for each of four alternated fingers were indicated. Left motor cortex (MC) was identified in the fMRI data using statistical parametric mapping (SPM12). Single voxel for J-edited acquisition protocol was placed around the identified area. The experiments were performed at the MRRC (Yale University) on a 4T Bruker spectrometer using 16 channel transmit-receive head coil and single-shot T2*-weighted FLASH for fMRI (74 scans, TR = 13.135 s, TE = 30 ms, voxel size = 4×4×5 mm), and J-difference editing for fMRS (150 paired spectra, TR = 3330 ms, TE = 144 ms, voxel size = 22×28×22 mm). Prior to fMRS acquisitions, we acquired B0 field map and water spectrum, adjusted basic frequency and shimming globally and locally, and optimized RF power. The acquired spectra were corrected for a basic frequency drift, aligned, phase-corrected, apodized (gaussian 2Hz, exponential 2Hz) and averaged to 30 pairs. On a group-level, individual spectra were centered and aligned to the group average reference NAA peak. The residual BOLD linewidth narrowing was estimated using line-shape differences in NAA peak (0.03±0.02 Hz) between the fixation and tapping conditions and then nulled using exponential linewidth adjustment. The same centering, alignment, and BOLD corrections were applied to the lactate spectra. Lactate and BHB integrals were estimated using LCM quantification. The integrals of the LC modelled lactate and BHB peaks, and noise integral (10.5±0.5 ppm), were normalized to the corresponding NAA integrals (2.01±0.15 ppm).Results
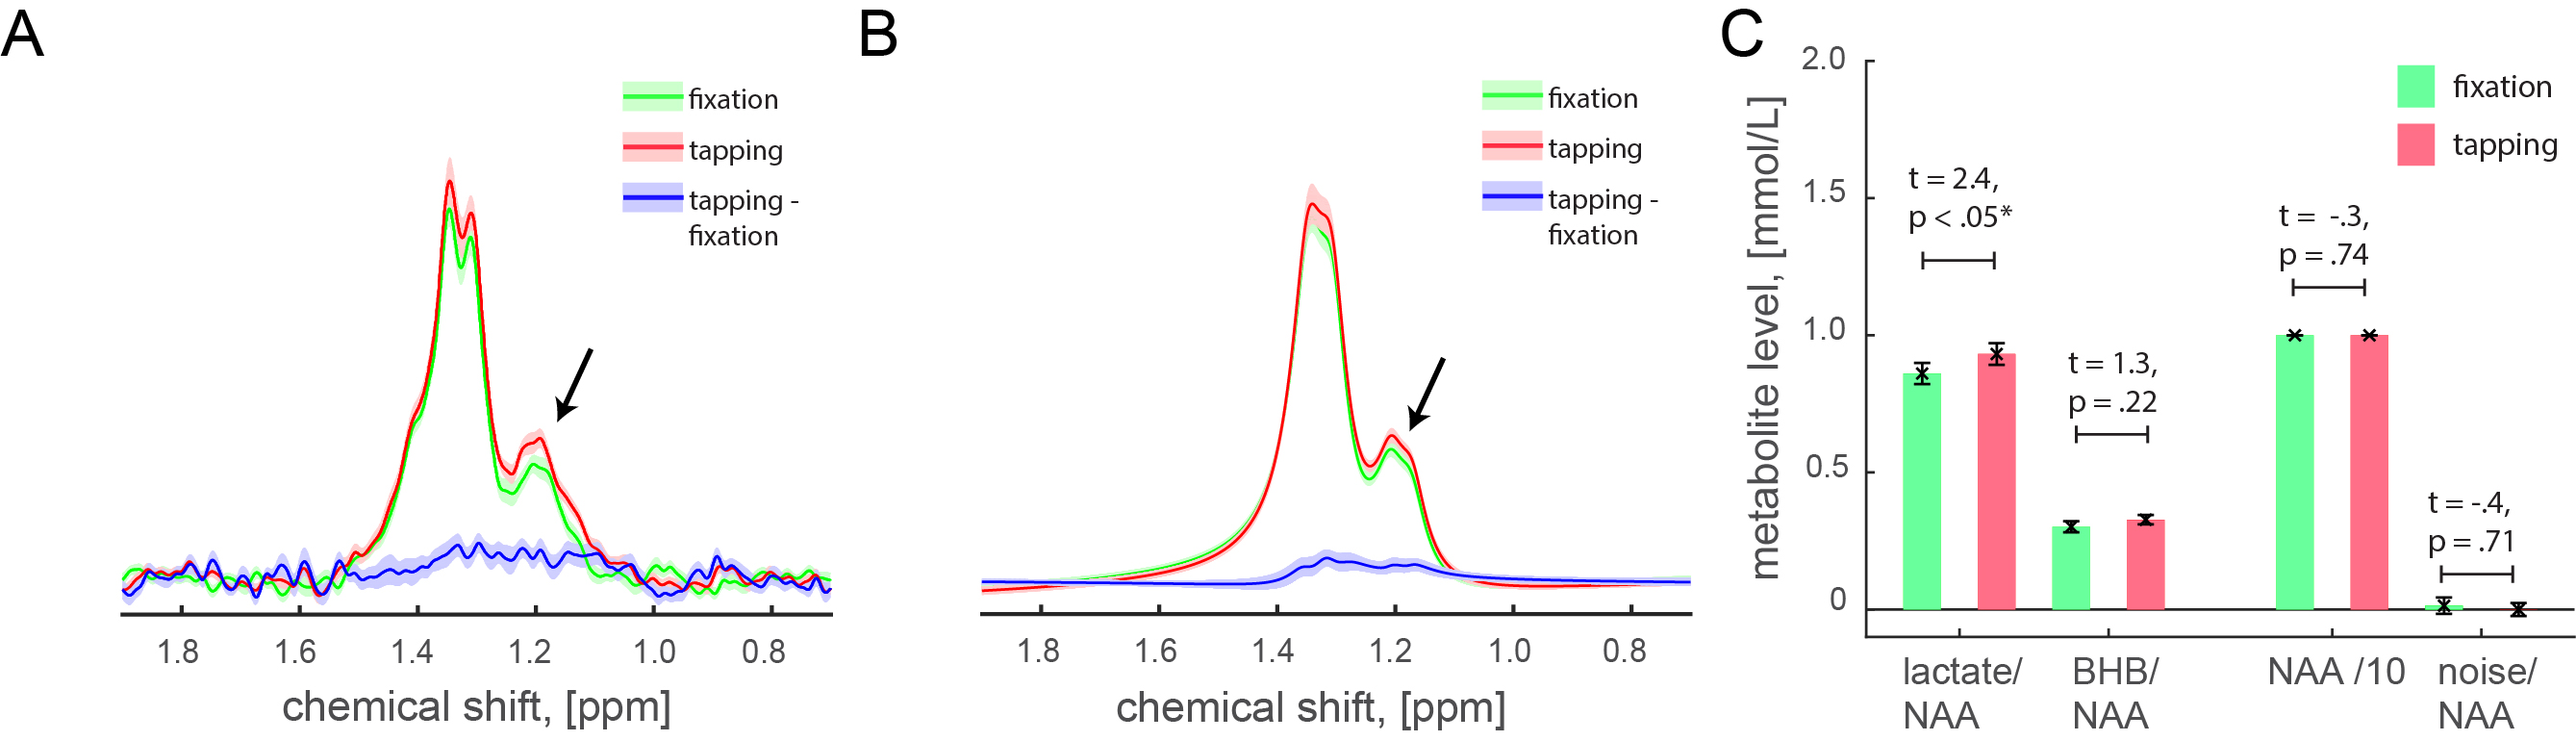
Because β-hydroxybutyrate (BHB) at 1.19ppm has the same J evolution profiles as lactate at 1.32ppm, our J-edited spectra captured both BHB and lactate reliably in all acquisitions. We found significantly higher normalized lactate integrals during tapping than in fixation conditions (Fig. 1A, 1.32±0.15 ppm, t = 3.2, p < 0.01), and significantly higher lactate integrals estimated based on the LCM quantification of the same spectra (Fig. 1B, t = 2.4, p < .05), and no difference between the corresponding NAA and noise integrals (ps > 0.5). BHB levels did not change with stimulation (t = 1.3, p < 0.22). Narrow linewidth for lactate (9.7±0.3 Hz) and water (5.1±1.7 Hz) peaks were estimated using LC modeling, as well as relatively low CRLB for lactate (3.7±0.2) and BHB (14.1±1.3) quantifications ensured the high quality of the acquired data and the reliability of the results. The stimulation-induced lactate changes in our J-edited spectra correspond to 11.2±4.6% from basal levels, which is in good agreement with prior non-edited spectra1-3.Discussion & Conclusion
Our J-edited fMRS results at 4T showed the physiological modulation of the MC lactate level estimates during standard finger-tapping experiment. In summary, these results confirm that previously detected lactate changes are probably devoid of functional hyperemic effects and are not significantly contaminated by spurious lipids/macromolecules signals.Acknowledgements
This study was supported by the Swiss National Science Foundation (P300PB_161083) and the National Institute of Health, USA (R01 NS-100106, R01 MH-067528, R21 MH-110862, P30 NS-052519).References
1. Schaller B, Xin L, O'Brien K, et al. Are glutamate and lactate increases ubiquitous to physiological activation? A (1)H functional MR spectroscopy study during motor activation in human brain at 7Tesla. Neuroimage 2014;93 Pt 1:138-145.
2. Prichard J, Rothman D, Novotny E, et al. Lactate rise detected by 1H NMR in human visual cortex during physiologic stimulation. Proceedings of the National Academy of Sciences of the United States of America 1991;88(13):5829-5831.
3. Mekle R, Kuhn S, Pfeiffer H, et al. Detection of metabolite changes in response to a varying visual stimulation paradigm using short-TE 1 H MRS at 7 T. NMR in biomedicine 2017;30(2).
4. Rothman DL, Behar KL, Hetherington HP, et al. Homonuclear 1H double-resonance difference spectroscopy of the rat brain in vivo. Proceedings of the National Academy of Sciences of the United States of America 1984;81(20):6330-6334.
Figures