1280
Repeatability and reproducibility of GABA quantification using MEGA-PRESS in anterior cingulate cortex as a biomarker for depressionDaniel Alamidi1, Jan Weis2, Christine Nabuurs3, Mats Fredrikson4,5, Andreas Frick4,6, Fredrik Ahs4,5, Jakub Kraus5,7, Jonas Persson8, and Maarten Versluis3
1Philips, Stockholm, Sweden, 2Department of Medical Physics, Uppsala University Hospital, Uppsala, Sweden, 3Philips, Best, Netherlands, 4Department of Psychology, Uppsala University, Uppsala, Sweden, 5Department of Clinical Neuroscience, Karolinska Institutet, Stockholm, Sweden, 6Department of Psychology, Stockholm University, Stockholm, Sweden, 7Centre for Neuroscience, Central European Institute of Technology, Masaryk University, Brno, Czech Republic, 8Department of Neuroscience, Psychiatry, Uppsala University, Uppsala, Sweden
Synopsis
Proton MRS of the anterior cingulate cortex (ACC) is an attractive biomarker as it provides non-invasive methods to quantify GABA levels that are linked with several psychiatric disorders. This study validates a MEGA-PRESS sequence that combines phase cycling with real time frequency drift correction to measure GABA spectra in phantom and human brain. The GABA levels of the ACC were repeatable and reproducible at two different scanning sites. Consequently, the technique is appropriate for future longitudinal psychiatric studies.
Purpose
The anterior cingulate cortex (ACC) acts as a central node in the brain and is important for regulation of advanced brain functions1. Lowered γ-aminobutyric acid (GABA) levels in the ACC region have been associated with psychiatric disorders such as depression2. 1H MRS at 3T is able to quantify GABA, which is the most important inhibitory neurotransmitter in the brain, with MEGA-PRESS. From an MRS perspective the dorsal ACC is a suitable region to focus on, as it is located far away from bone and air inhomogeneities with high SNR potential. To make MEGA-PRESS more robust to subtraction artefacts, the ON-OFF acquisitions were acquired pair-wise while keeping phase cycling schemes for PRESS localization. Before investigating longitudinal changes or response to therapy the accuracy of GABA detection in the ACC needs to be assessed. The aim of this study was to validate a modification of the MEGA-PRESS sequence for GABA detection with repeatability and reproducibility measurements in phantom and in the ACC on two different 3T MRI scanners.Materials and methods
Three consecutive 1H-MRS MEGA-PRESS acquisitions were acquired in a GABA phantom (200 mM) and in six healthy male volunteers at two 3T (Philips, Best, the Netherlands) MRI scanners with different receiver coils (site A: Ingenia CX; 16 channel head coil, site B: Achieva dStream; 32 channel head coil). The voxel (3.2 cm3) was placed in the center of the phantom and in the ACC (Fig.1A) using the following parameters: TR/TE = 2000/68 ms, 320 alternating ON-OFF spectra, 14 ms editing pulses at 1.9 (ON) and 7.5 (OFF) ppm, 1024 points with a total scan time ~12 min. Acquisition was divided into 40 dynamic scans; each dynamic started with one water reference, used for prospective frequency correction3, and four pairs of water suppressed ON-OFF spectra (phase cycling 4) (Fig.2). GABA phantom concentration [mM] was estimated according to the equation: C = RGABAx(2/NGABA)x(WH2O/eff), where RGABA is relaxation times corrected GABA/H2O spectral intensity ratio, NGABA = 2 is number of protons contributing to the spectral intensity at 3 ppm, WH2O = 55 550 mM is water concentration, eff = 0.5 is editing efficiency4,5, T1GABA=2770 ms6, T2GABA=260 ms7 and T1H2O (2850 ms); T2H2O (200 ms) were measured with IR-mixed-TSE8. Phantom spectra were processed using jMRUI9 and in vivo data using Gannet 2.110, applying 3 Hz line-broadening. GABA in vivo levels were estimated relative to Cr. The repeatability and reproducibility of GABA were evaluated with repeated measures ANOVA, paired t-test and coefficient of variation (CV).Results
A typical spectrum of the phantom is shown in Fig.3. The GABA concentration measurements in the phantom were 206 ± 2 mM (mean ± SD) at site A and 189 ± 4 mM at site B and the CVs were 1.0% and 2.3%, respectively. A representative spectrum of one volunteer is provided in Fig.1B. Mean GABA+/Cr levels of the volunteers were 0.09 ± 0.01 at both sites and the CV was 19% at site A and 9% at site B (Fig.4). Repeatability of the three measurements showed no significant GABA+/Cr changes within each volunteer at either site (p>0.05). The measurements were reproducible as no significant GABA+/Cr differences were found between the scanning sites (p>0.05) (Fig.4).Discussion and conclusion
The present study demonstrates good repeatability and reproducibility of GABA quantification in phantoms and in the ACC brain region at two scanning sites. The ability of the technique to assess GABA levels was confirmed in phantoms, indicating stable, accurate and reproducible results. The mean GABA+/Cr levels were the same on both sites and correspond to recently reported values in the medial parietal lobe11. Site A had an increased GABA+/Cr CV that might be explained by the lower RF coil homogeneity and sensitivity due to fewer coil elements. The phase cycling scheme improves robustness of the MEGA-PRESS technique to motion artefacts and to certain hardware imperfections such as imperfect RF pulse flip angles and unwanted FIDs from non-ideal slice profiles. Acquisition of unsuppressed water spectra at the start of each dynamic and its real time processing enables updating of the offset frequency and thereby an efficient real time frequency drift correction. Also, the subsequent ON/OFF acquisition and pair-wise rejection in the data processing increases the accuracy of the GABA ratios. Only a small, if any, frequency and phase correction is needed before ON-OFF spectra subtraction. In conclusion, GABA quantification of the ACC with MEGA-PRESS is suited for future longitudinal studies and is an attractive MRS biomarker of psychiatric diseases.Acknowledgements
No acknowledgement found.References
- Allman JM, Hakeem A, Erwin JM et al. The Anterior Cingulate Cortex. The Evolution of an Interface between Emotion and Cognition. Ann NY Acad Sci. 2001;935:107-17.
- Lusher B, Shen Q, Sahir N. The GABAergic deficit hypothesis of major depressive disorder. Molecular Psychiatry. 2011;16:383–406.
- Edden RAE, Oeltzschner G, Harris AD et al. Prospective frequency correction for macromolecule-suppressed GABA editing at 3T. J Magn Reson Imaging. 2016;44:1474-1482.
- Grewal M, Dabas A, Saharan S et al. GABA quantitation using MEGA-PRESS: Regional and hemispheric differences. J Magn Reson Imag. 2016;44:1619-1623.
- Mullins PG, McGonigle DJ, O’Gorman RL et al. Current practice in the use of MEGA-PRESS spectroscopy for the detection of GABA. Neuroimage. 2014;86:43-52.
- Puts NAJ, Barker PB, Edden RAE. Measuring the longitudinal relaxation time of GABA in vivo at 3 Tesla. J Magn Reson Imag. 2013;37:999-2013.
- Edden RAE, Intrapiromkul J, Zhu H et al. Measuring T2 in vivo with J-difference editing: Application to GABA at 3 T. J Magn Reson Imag. 2012;35:229-234.
- In den Kleef JJ, Cuppen JJ. RLSQ: T1, T2, and rho calculations, combining ratios and least squares. Magnetic Resonance in Medicine. 1987:513-24.
- Naressi A, Couturier C, Devos JM et al. Java-based graphical user interface for the MRUI quantitation package. MAGMA. 2001;12:141-152.
- Eden RAE, Puts NAJ, Harris AD, et al. Gannet: A batch-processing tool for the quantitative analysis of gamma-aminobutyric acid-edited MR spectroscopy spectra. J Magn Reson Imag. 2014;40:1445-1452.
- Mikkelsen M, Barker PB, Bhattacharyya PK et al. Big GABA: Edited MR spectroscopy at 24 sites. Neuroimage. 2017;159:32-45.
Figures
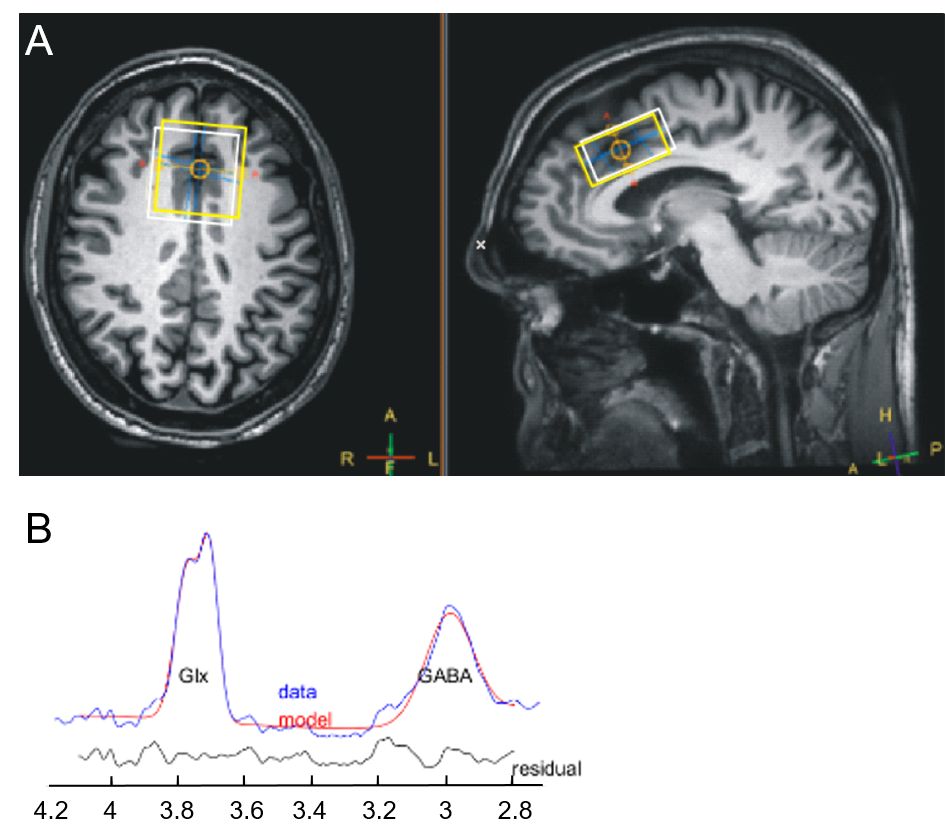
Fig.1 (A) Voxel position
(40x40x20 mm3) in anterior cingulate cortex.
White and yellow boxes show GABA (3 ppm) and NAA (2 ppm) MEGA-PRESS voxels in
transversal and sagittal plane.
(B) Representative
GABA spectrum in anterior cingulate cortex (ACC) with fit and residual.
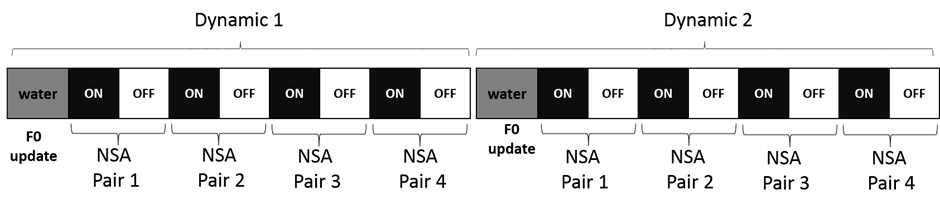
Fig.2 Schematic of the MEGA-PRESS acquisition order. Each dynamic started
with one water reference, used for prospective frequency correction, and four
pairs of water suppressed ON-OFF spectra (phase cycling 4).
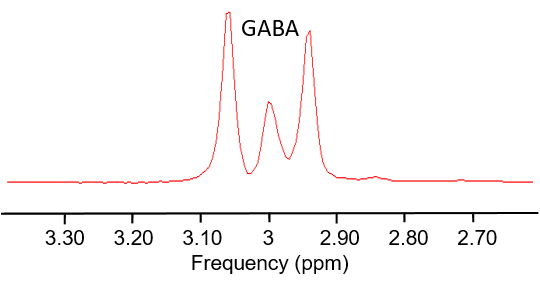
Fig.3 Typical spectrum of 200 mM GABA phantom solution.

Fig.4
GABA+/Cr ratio in anterior cingulate cortex of
all volunteers measured at scanning site A and B. Presented per subject (A), with
mean and standard deviation (B) and through Bland-Altman plot (C) comparing
the difference in GABA+/Cr at site A and B to the average of both sites. The
average difference was close to zero and is shown as a solid line together
with 95% confidence intervals (1.96σ) as dashed lines. The measured GABA
levels were stable, repeatable and reproducible with good agreement within
and across the scanning sites.