1279
ISIS based Relaxation Enhanced MR spectroscopy (iRE-MRS) for downfield spectroscopy at short echo timesSonia I. Goncalves1 and Noam Shemesh1
1Neuroplasticity and Neural Activity Lab, Champalimaud Foundation, Lisbon, Portugal
Synopsis
MRS is a versatile technique that allows for the non-invasive in-vivo exploration of tissue metabolism. In most MRS pulse sequences based on broadband excitation, the acquisition is preceded by water saturation pulses that suppress the water bulk signal and implicitly also exchangeable protons downfield of water. We introduce a new method for short-TE downfield MRS and show that it detects multiple peaks in-vivo that extend beyond 9 ppm.
Purpose
Magnetic resonance spectroscopy (MRS) is a versatile technique that allows for the non-invasive in-vivo exploration of tissue metabolism. Most MRS pulse sequences rely on broadband excitation and water saturation. Although the water bulk signal is suppressed such that millimolar-level metabolites can be observed, the spontaneous exchange between saturated water and labile protons, resonating downfield of the water peak, deems the latter virtually unobservable in conventional water-suppressed techniques. Downfield spectroscopy has been achieved using high dynamic range MRS [1-4]. Relaxation-Enhanced MRS [5, 6] (RE-MRS) has been proposed as an alternative technique for downfield spectroscopy. RE-MRS employs frequency-selective excitation targeting resonances of interest, while avoiding the excitation of bulk water. Although RE-MRS outperformed other methods [1] in revealing downfield resonances, the sequences involved very long echo times (>40 ms); since downfield resonances are nearly invariably broad, the long TE may reduce the sensitivity to detect low-concentration metabolites. Here, we introduce a new method for downfield spectroscopy that combines RE-MRS principles and Image-Selective-In-Vivo-Spectroscopy ISIS [8] localization, abbreviated iRE-MRS. We obtain TEs as low as 13 ms at 9.4 T and as low as 7.5 ms at 16.4 T, validate our method in phantoms, and show that, even at this lower field strength, multiple new downfield resonances can be detected in-vivo.Methods
Figure 1 illustrates the proposed sequence for one ISIS cycle. The localization module is followed by acquisition: a 90ºx-180ºy spin-echo pulse combination. The 180º refocusing pulse is surrounded by spoiler gradients along the three physical axis. The pulses used to acquire phantom data were generated by the shape algorithm implemented in Paravision 6.0.1. For in-vivo experiments, RF pulses were designed using the Shinar LeRoux algorithm [9]. The downfield metabolites were excited using an 8 ms equiripple single-band pulse with a 4 ppm bandwidth whereas for upfield excitation an 8 ms equiripple single-band 3 ppm bandwidth pulse was used. A 4 ms equiripple refocusing pulse was designed with 4 or 3 ppm bandwidth for downfield and upfield spectral regions, resepectively. Phantom validations were performed using a 10 mm NMR tube filled with Fluorinert and containing three 3 mm tubes with a 100 mM solution (in PBS) of Glutamate, NAA and GABA, on a 16.4T vertical scanner equipped with a micro5 probe. In-vivo experiments were carried out on 6 Long-Evans male rats weighting 250 g and aged ~3 months on a 9.4T horizontal bore scanner (Bruker-Biospin, Billerica, MA). For all experiments, reference spectra were acquired with a PRESS sequence placed on identical voxels and with identical TEs/TRs. All spectra were preprocessed by first applying zero filling (32k) to the averaged time-domain signal, apodization with a 10 Hz factor.Results
Figure 2 shows representative spectra obtained in the tube containing NAA. The excitation was centered at 0.4 ppm and ranged from -2.6 to 3.4 ppm. The comparison of both spectra shows that iRE-MRS correctly reproduces the gold-standard PRESS spectrum for frequencies falling within the RF pulses’ passband. Figure 3 shows representative downfield spectra for three representative animals.. In addition to the observation of the NAA peak at ~7.85 ppm, other peaks at ~6.4, 6.8 and 8.3 ppm are clearly visible. To investigate whether the iRE-MRS offers benefits over RE-MRS the echo times were gradually increased (Figure 4). Clearly, longer echo times dramatically decrease the sensitivity in peak detection. Figure 5 shows the spectra obtained for one animal, when the excitation was centred at 10 ppm and ranged from 8 to 12 ppm. To our knowledge, peaks at this region have never been reported, but iRE-MRS shows several peaks beyond 9.5 ppm which to this point remain unidentified.Discussion
Downfield MRS can significantly benefit from TE reductions, which have here been achieved with a new pulse sequence based on ISIS and RE-MRS (iRE-MRS). Compared to previous work [1-4], iRE-MRS avoids broadband excitation therefore precluding the use of water suppression pulses or the necessity of using e.g. calibration factors to exclude the water peak [2]. Apart from the increased sensitivity, iRE-MRS reveals multiple peaks that extend beyond 9 ppm, which afford an exciting new vista for characterizing more metabolites in the brain than currently possible. Some of these signals are likely carboxylic acid or nucleotide/nucleoside signals resonating around these frequencies.Conclusion
We demonstrate that short-TE iRE-MRS provides spectra that are able to unravel multiple metabolite resonances, even beyond 9ppm, in-vivo at 9.4T. The application of short echo time iRE- MRS at higher field strengths has the potential to open-up new directions in the investigation of in-vivo downfield resonances.Acknowledgements
The authors thank Prof. Jean-Nicolas Dumez for assistance with the SLR algorithm. This study was funded by the European Union’s Horizon 2020 research and innovation programme (Starting Grant, agreement No. 679058).References
[1] Piotto et al., J. Biomol. NMR, 2, 661-665, 1992; [2] Dreher and Leibfritz, Magn. Res. Med., 54, 190-195, 2005. [3] MacMillan et al., 65, 1239-1246, 2011; [4] MacMillan et al., 70, 916-924, 2013; [5] Emir et al., NMR Biomed., 30(7), doi: 10.1002/nbm.3714; [6] Shemesh et al., Chem. Eur. J., 19, 13002-13008, 2013; [7] Shemesh et al., Nat Commun, doi: 10.1038/ncomms5958, 2014; [8, 6] Ordidge et al., J. Magn. Res., 66, 283, 1986; [9, 5] Pauly et al., IEEE Trans. Med. Imaging, 10, 53-65, 1991;Figures
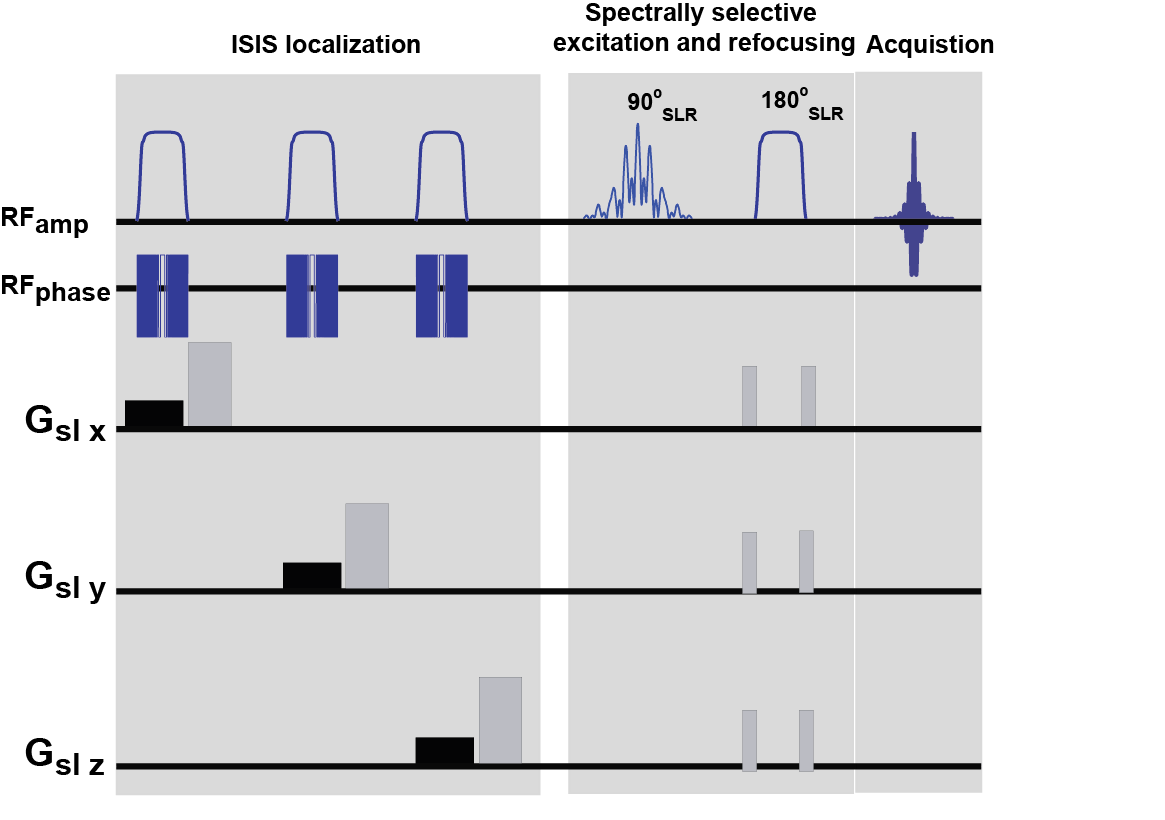
Figure 1. Pulse sequence
diagram.
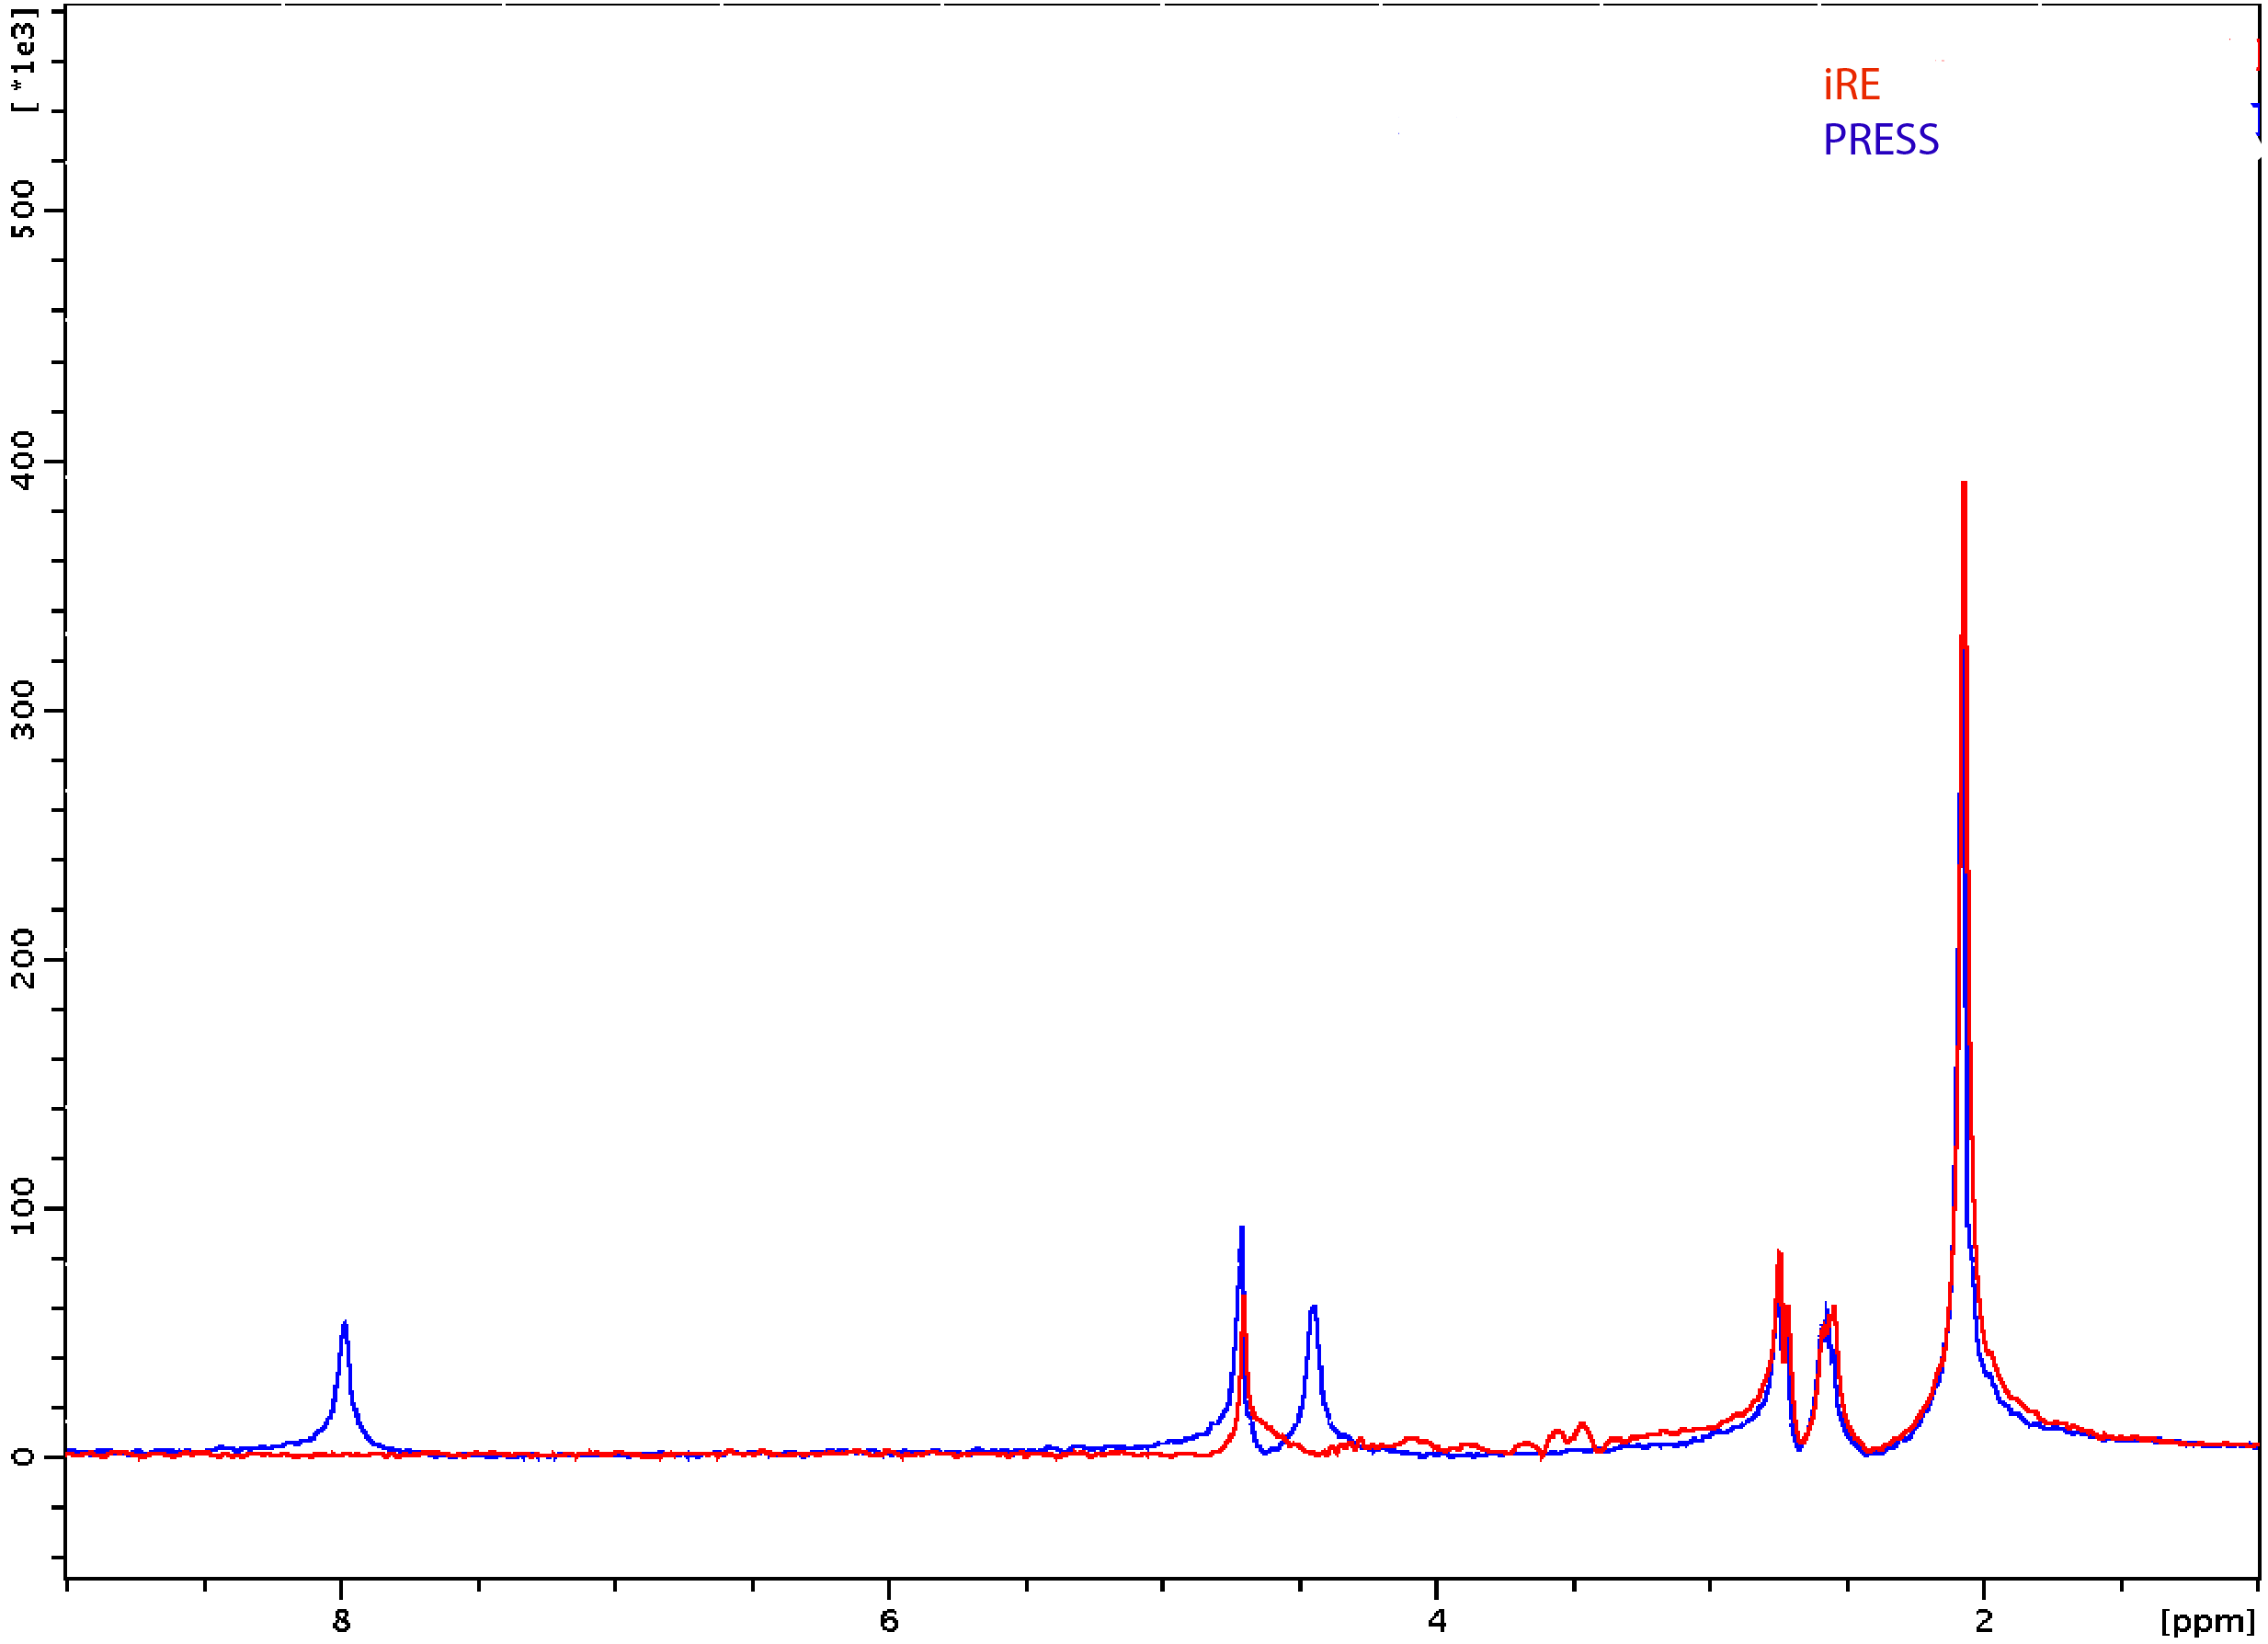
Figure 2. Spectra obtained in
the NAA tube. Sequence parameters were TR/TE=25000/7.5 ms, 1×1×3 mm3 voxel, acquisition bandwidth=14098
Hz, 8 averages. In iRE, spoiler gradient was 7.8% of the maximum amplitude and the duration
was 300 µs.
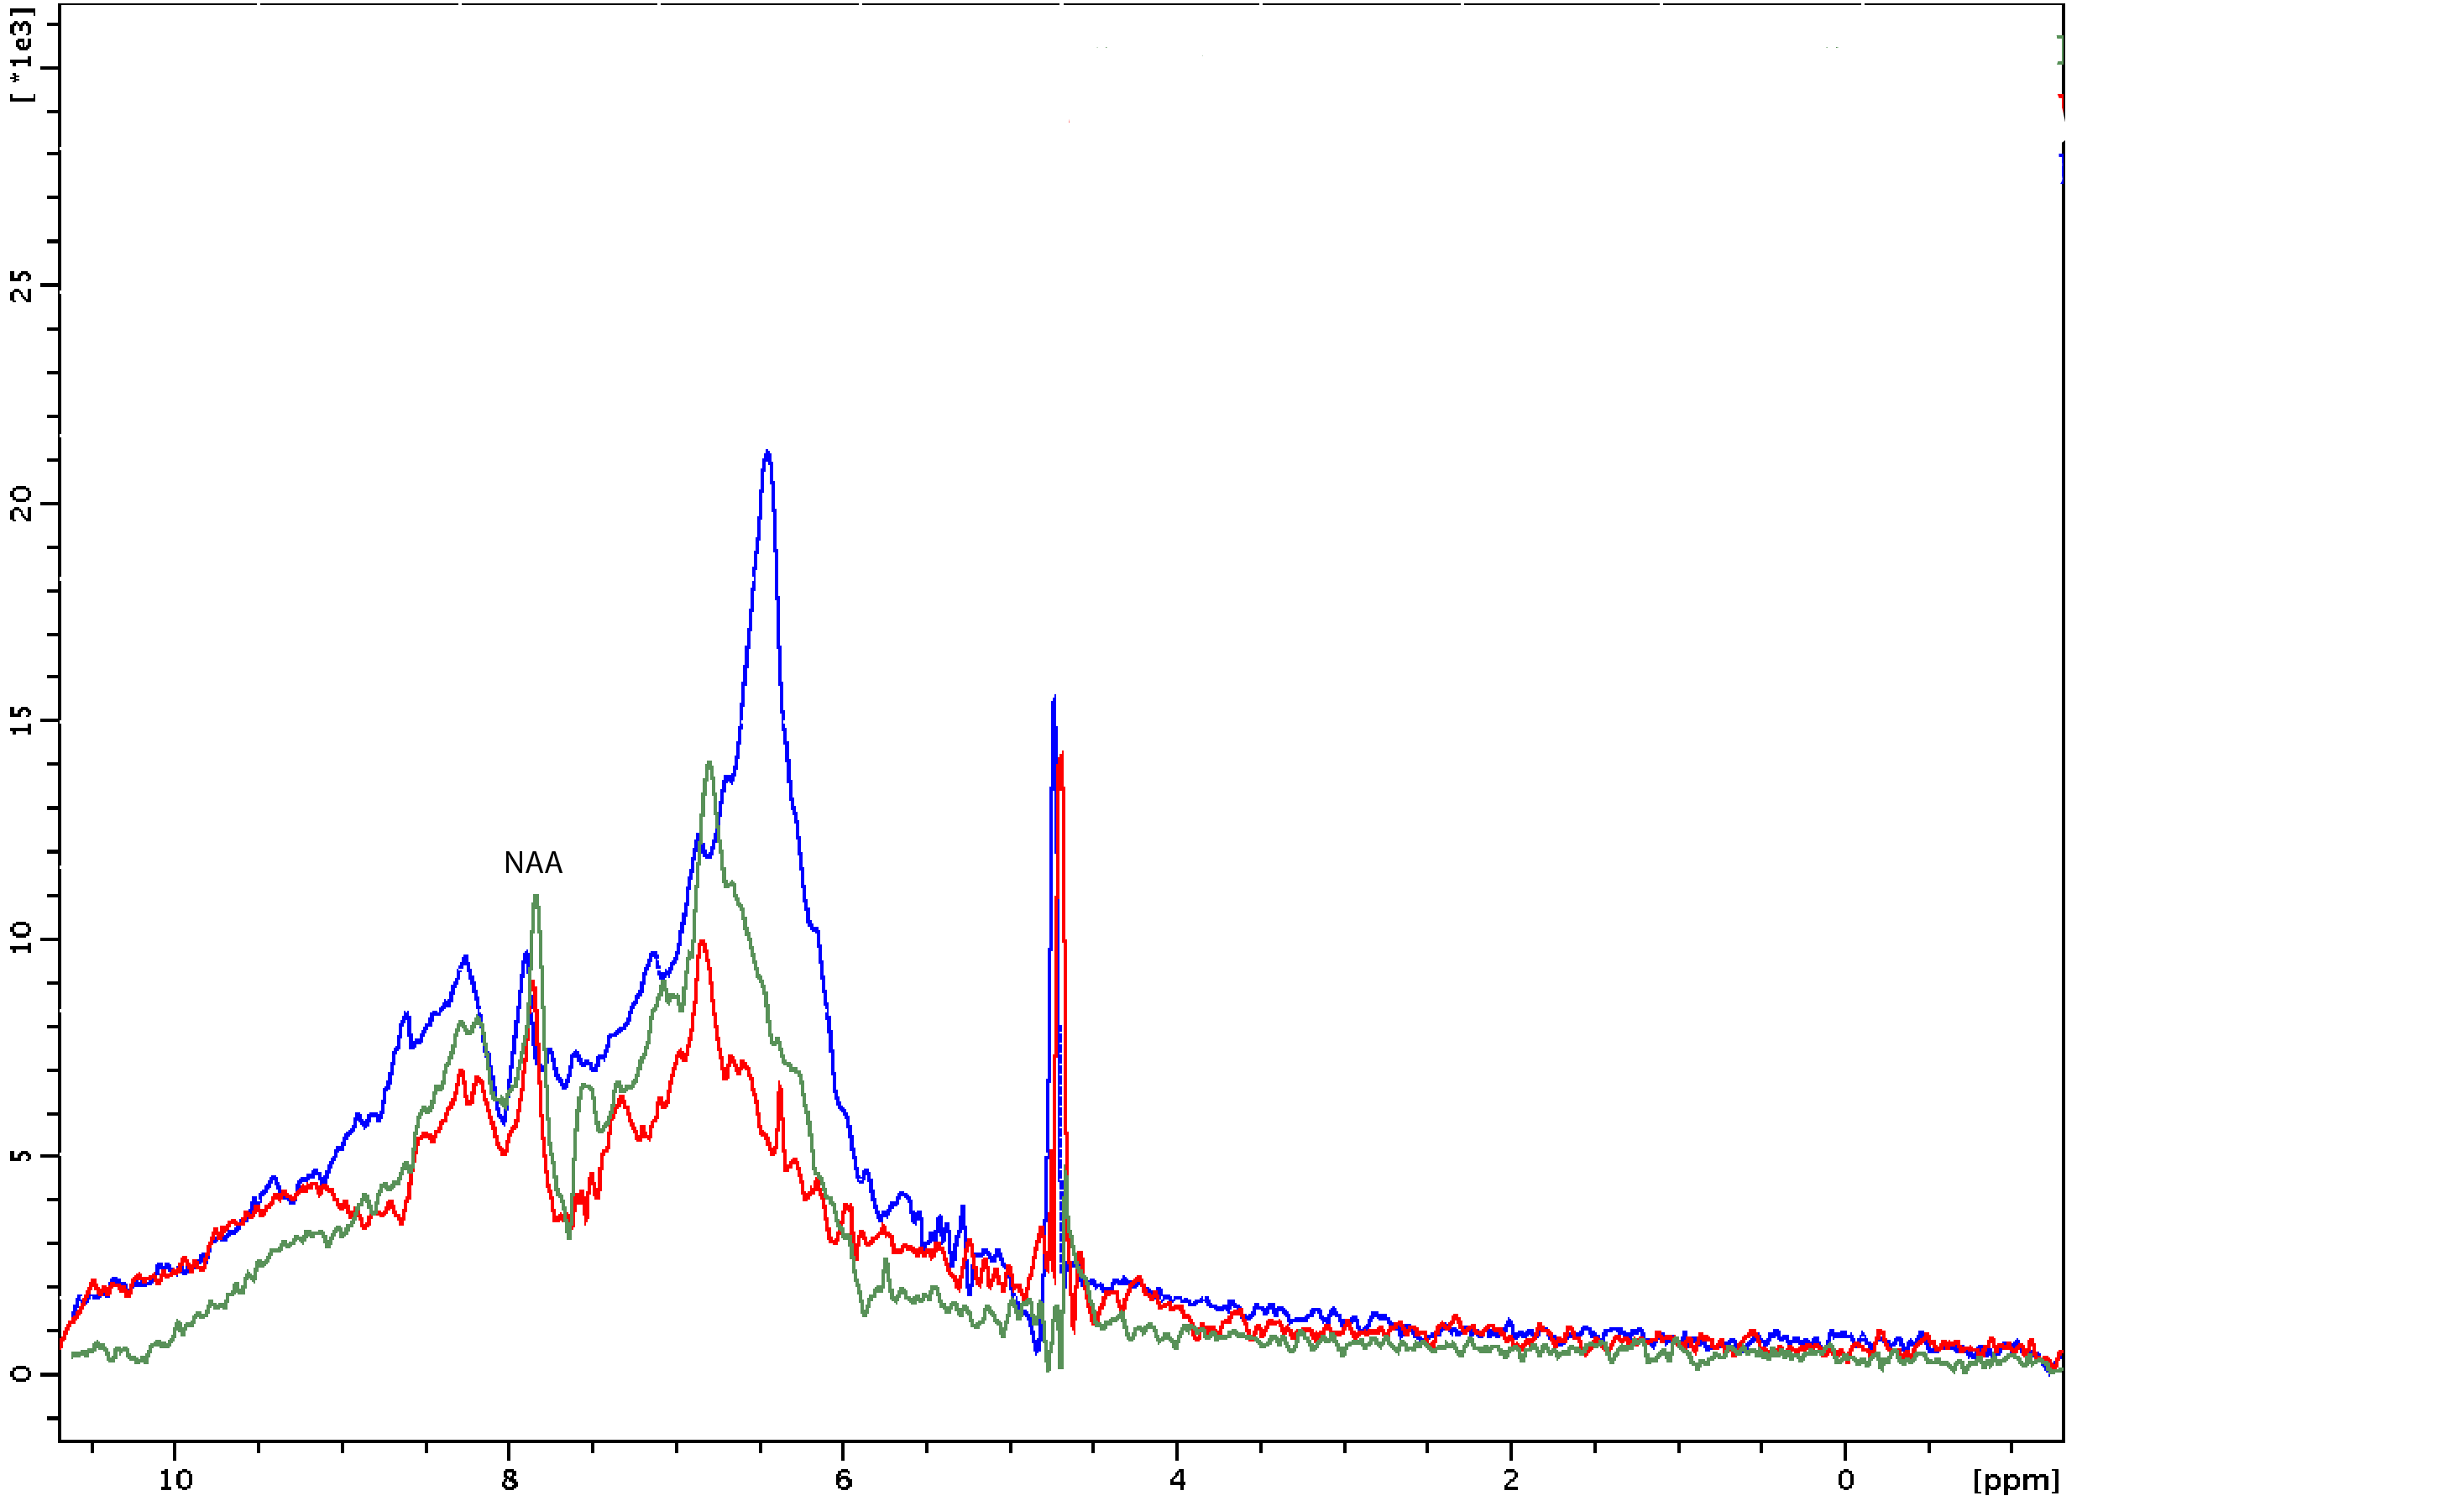
Figure 3. Representative downfield spectra for 3 different
animals. Sequence parameters were TR/TE=6000/13 ms, 6.0×2.5×3.5 mm3
voxel positioned centrally and including the cortex and slightly the
caudate-puntamen, acquisition bandwidth=4808 Hz, 80 averages, spoiler gradient
was 13.33% of the maximum amplitude and the duration was 300 µs. Data was
acquired with OVS and respiratory triggering.
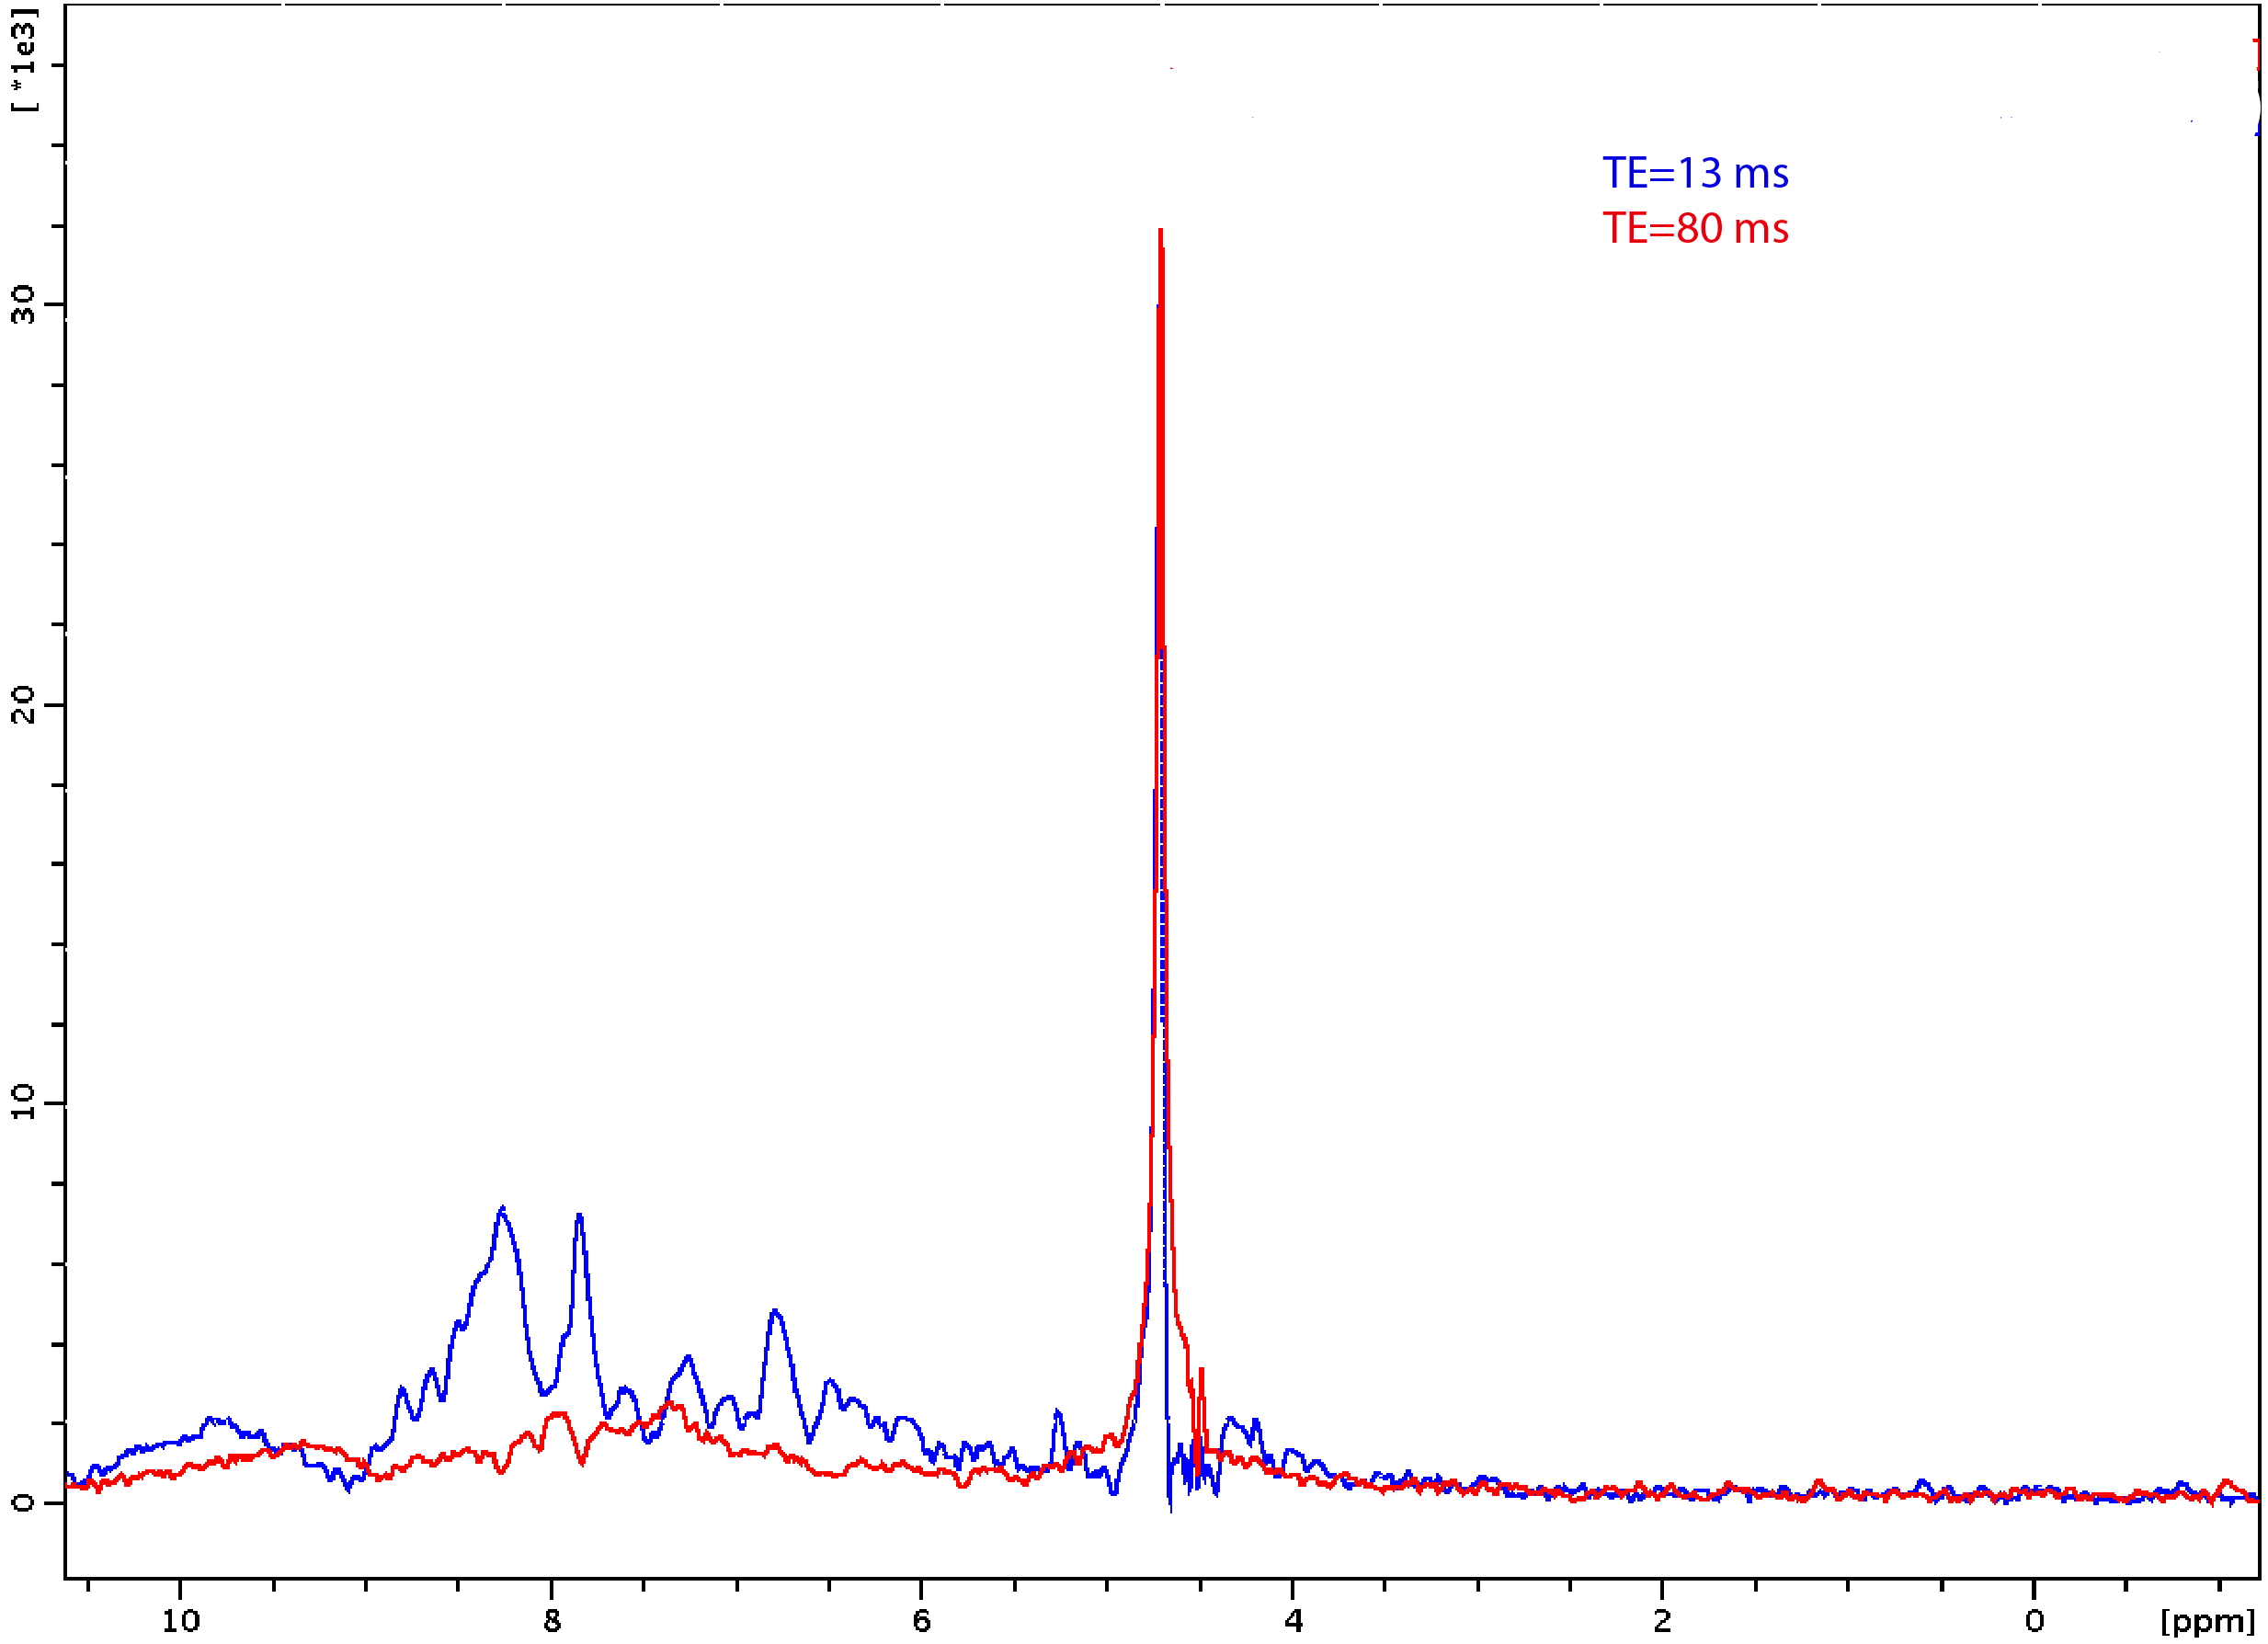
Figure 4. Downfield spectra acquired in one animal at two TEs.
Acquisition details as in fig. 3.
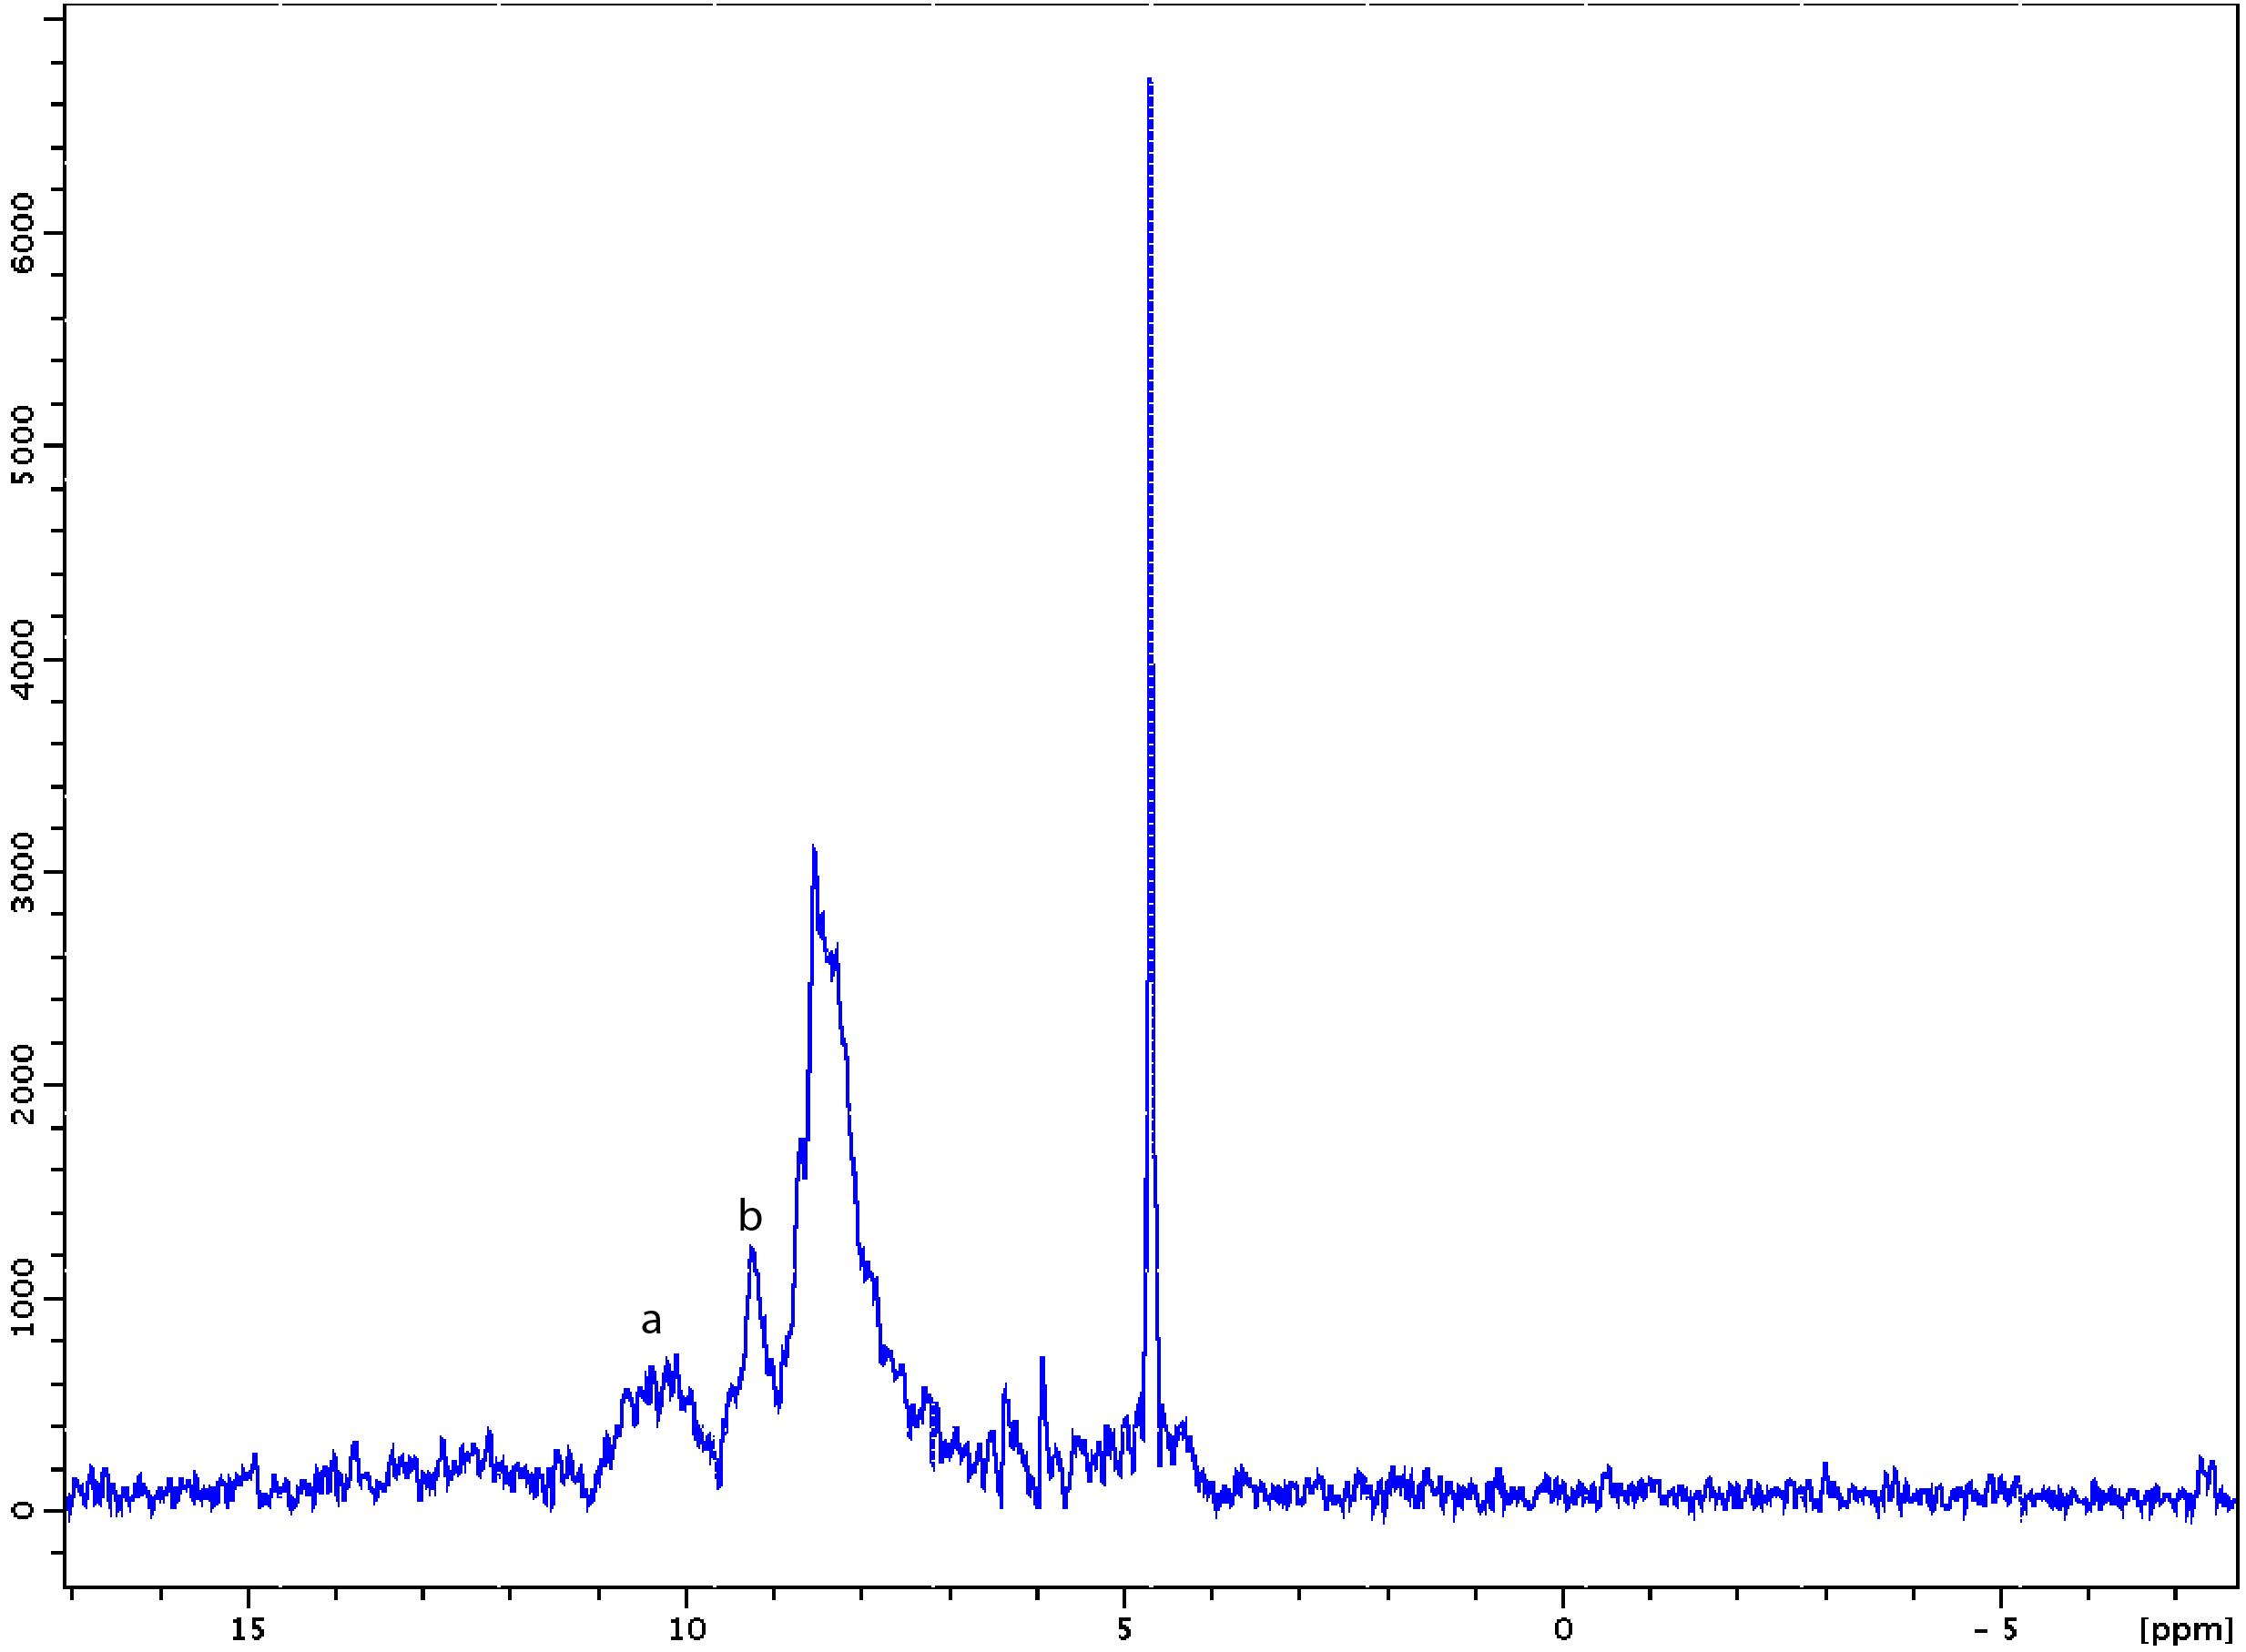
Figure 5. Downfield spectra acquired in one animal with
excitation centred at 10 ppm. Sequence parameters as in fig.3, but acquisition
bandwidth=10000 Hz and 600 averages were acquired. Peaks a and b, not identified, are located beyond 9
pm.