1277
Intrinsic inversion recovery-based macromolecular nulling in MEGA-PRESS 1H-MR brain spectraAlexander Gussew1, Andreas Masek1, Martin Krämer1, and Jürgen R. Reichenbach1
1Medical Physics Group, Institute of Diagnostic and Interventional Radiology, Jena University Hospital - Friedrich Schiller University Jena, Jena, Germany
Synopsis
The reliability of 1H-MRS MEGA-PRESS measurements of inhibitory neurotransmitter GABA in the human brain typically suffers from macromolecular (MM) contaminations of GABA resonances. In this work, we present a novel MM suppression approach, which relies on adiabatic inversion of the longitudinal magnetization of both metabolites and MMs prior to playing out the MEGA-PRESS editing scheme, which is applied after an inversion time delay (TI) corresponding to the zero-crossing of MM magnetization. As demonstrated in healthy subjects, this new approach ensures appropriate MM suppression and provides additional GABA signal gain compared to the commonly applied approach with symmetrical MM editing.
Purporse
MEGA-PRESS
1H-MRS measurements of inhibitory neurotransmitter GABA allow
investigations of neurochemical processes modulating neuronal activity in the
brain1. Applying a standard MEGA-PRESS sequence with alternating
editing pulses at 1.9 ppm (edited spectra, ed) and 7.5 ppm (non-edited spectra, ned), the GABA intensities at 3 ppm in the difference spectrum
(ed–ned) are, however, overlapped by co-edited
macromolecular resonances (MM), which vary depending on physiologic factors or
disease state. The MM resonances can be suppressed by alternating narrow-band editing
pulses at 1.9 ppm and 1.5 ppm, providing similar MM modulation in both
ed and ned spectra, whereas GABA will be edited only in ed scans (‘Henry method’2). The editing efficiency for MM (and also
for GABA) can, however, be compromised by gradient heating or movement related
rf frequency drifts. In this study, we present a novel MM suppression approach relying
on an adiabatic inversion of the longitudinal magnetization of both metabolites
and MMs prior to playing-out the standard MEGA-PRESS editing scheme, which is
applied after an inversion time delay (TI) corresponding to the zero-crossing
of the MM magnetization.Material and Methods
A conventional MEGA-PRESS sequence (Siemens IDEA, VE11B) was modified by inserting a spatially non-selective, adiabatic inversion pulse (BIR4). The TI time for MM nulling (TI0,MM(T1,MM) = T1,MM × ln(2)) was set to 0.173 s, according to the previously reported T1 of 0.25 s for MM in the human brain3. Six healthy males (32.5±5.8 years) were measured on a whole-body 3T MR scanner (Magnetom PRISMA, 64-channel head-matrix coil). The protocol comprised a 3D T1-weighted MP-RAGE scan, followed by three 1H-MEGA-PRESS water-suppressed scans (TR: 4.5 s, 64 ned/ed averages) in the posterior cortex (PC, 18 ml, see Fig. 1). The first scan was performed with a conventional editing scheme to determine the MM contaminated GABA+ intensities (‘ConvMEGA’, TE: 68 ms, Gaussian editing pulse duration: 17 ms), whereas the second scan was conducted by using the Henry Method to quantitate ‘pure’ GABA intensities (‘HenryMEGA’, TE: 80ms, alternating editing pulses at 1.5 and 1.9 ppm, editing pulse duration: 23ms). Finally, the novel MEGA-PRESS sequence with adiabatic MM nulling was applied during the third scan (‘MMnulMEGA’, TE/TI: 68/173 ms, editing pulse duration: 17ms). GABA+ (ConvMEGA) and GABA (HenryMEGA and MMnullMEGA) intensities were quantified from the particular difference spectra (jMRUI4) and normalised with the creatine intensities obtained from corresponding ned spectra (GABA+/tCr, GABA/tCr and Glx/tCr ratios).Results
Figs.1 and 2 show representative ned and difference spectra acquired with HenryMEGA (blue graphs), MMnulMEGA (red graphs) and ConvMEGA (black graphs) scans. Due to progressing signal recovery during the TI delay, the tNAA, tCr and tCho resonances are distinctly lower in the MMnullMEGA compared to the ConvMEGA spectrum. On the other hand, the ned and difference MMnullMEGA spectra yield the most flat baseline between 0.5 and 1.9 ppm, which evidences appropriate MM suppression. Similar to the MMnullMEGA ned spectrum, the corresponding difference spectrum reveals an apparent, T1-weighting related decrease of the GABA and Glx peaks. The GABA peaks in the MMnulMEGA and HenryMEGA difference spectra are lower than in the ConvMEGA spectrum due to suppressed MM multiplet fraction. Interestingly, the MMnullMEGA GABA resonance is higher than in the HenryMEGA spectrum, where the editing at 1.5 ppm particularly co-edits GABA at 1.9 ppm, leading to a GABA signal reduction in the difference spectrum. These method-specific GABA signal modifications are also replicated in the GABA/tCr subject group distributions (Fig. 3). Fig. 4 shows associations between GABA and GABA+ intensities obtained in scans with and without MM suppression. Considering the Henry method to be the gold standard approach for pure GABA measurements, the significant correlation between the MMnulMEGA and HenryMEGA GABA levels (Fig. 4a) indicates appropriate GABA quantitation with the novel MMnulMEGA method. On the other hand, the weaker associations between the GABA+ (ConvGABA) and pure GABA levels (MMnulMEGA or HenryMEGA, Fig. 4b) illustrate the GABA+ uncertainty arising due to inter-individually varying MM levels.Discussion and Conclusion
We propose a novel method, which combines MEGA-PRESS 1H-MRS with adiabatic MM nulling and provides appropriate GABA quantitation without macromolecular contaminations. Besides being less dependent on rf-frequency drifts, our method avoids GABA co-editing and provides a GABA signal gain compared to the Henry method. In addition, our method allows more flexible editing pulse frequency selection in ned scans, which can be exploited for advanced editing strategies as they are applied, for example, in the HERMES approach5.Acknowledgements
Alexander Gussew and Martin Krämer acknowledge funding from the German Research Foundation (DFG, GU 1108/3-1; RE 1123/22-1). Andreas Masek is supported by a graduate scholarship from the Friedrich‐Schiller‐University Jena (Landesgraduiertenstipendium).References
- Mullins PG et al. Current practice in the use of MEGA-PRESS spectroscopy for the detection of GABA. NIMG 2014, 86: 43-52.
- Henry PG et al., Brain GABA Editing Without Macromolecule Contamination. Magn. Res. Med. 2001, 45: 517-520.
- Behar KL et al, Analysis of macromolecule resonances in 1H NMR spectra of human brain. Magn. Res. Med. 1994, 32: 294-302.
- Stefan D et al., Quantitation of magnetic resonance spectroscopy signals: the jMRUI software package. Meas. Sci. Technol. 2009, 20(10): 104035. Oeltzschner G et al, Hadamard editing of glutathione and macromolecule-suppressed GABA. NMR Biomed. 2017, Epub ahead of print
Figures
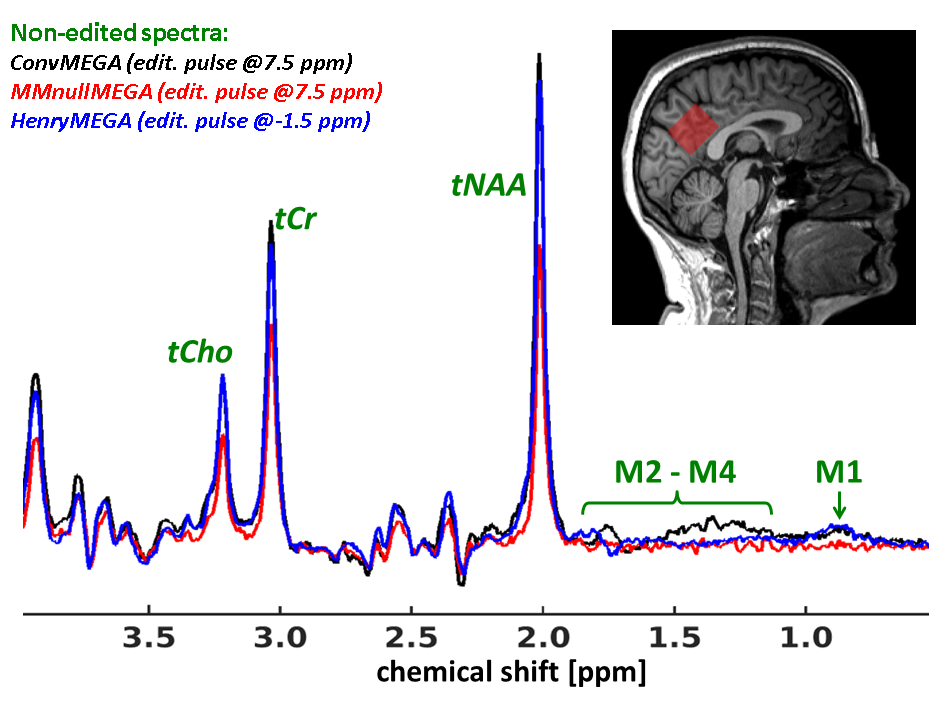
Fig.1. Representative
MEGA-PRRSS 1H-MR non-edited spectra acquired in the posterior cortex
of a male subject (see red box in the sagittal brain slice) without (ConvMEGA: black graph) and with MM
suppression (HenryMEGA: blue graph; MMnulMEGA: red graph). Besides revealing
lowest tNAA, tCr and tCho signal intensities, the MMnulMEGA spectrum yields a considerable flat baseline between 0.5
and 1.9 ppm, which indicates appropriate suppression of macromolecular resonances
(indexed by ‘M1’ and ‘M2 - M4’). For better comparison, the MMnulMEGA spectrum was inverted by
applying a constant phase shift of 180°.
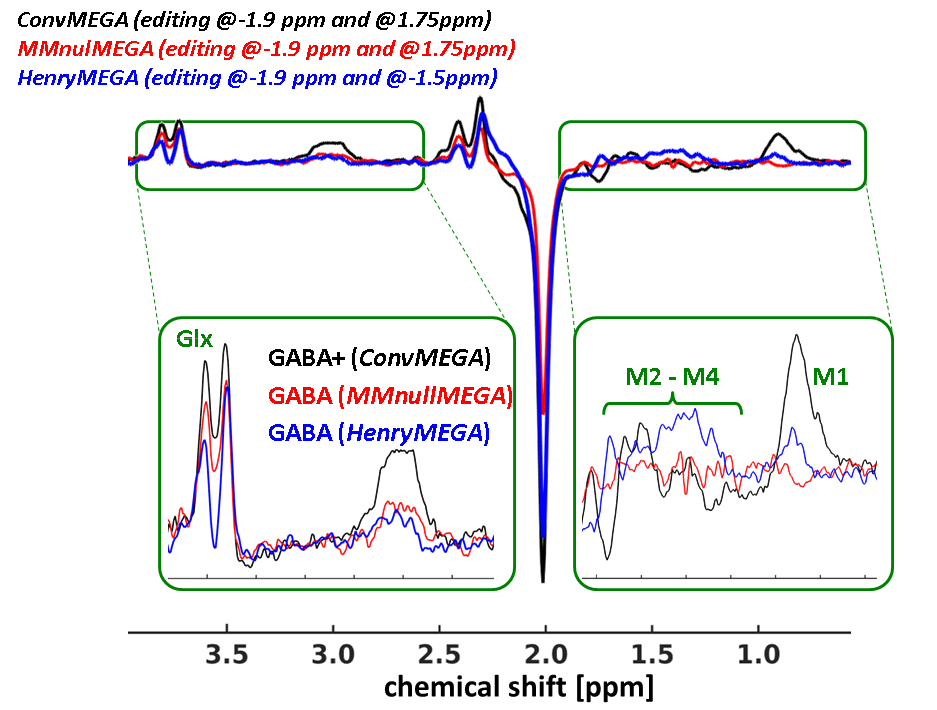
Fig.2 Representative
difference spectra from ConvMEGA (black),
HenryMEGA (blue) and MMnulMEGA (red) scans. Green boxes
illustrate zoomed GABA-Glx (2.6-4ppm) and MM (0.5-1.8ppm) bands. While
the flat baseline within the MM-band of the MMnulMEGA
spectrum indicates appropriate MM suppression, the corresponding HenryMEGA spectrum reveals MM residuals
(‘M1’ and ‘M2-M4’). Compared to MMnulMEGA,
the HenryMEGA spectrum has slightly
lower GABA and Glx signals, which may be ascribed to the GABA and Glx co-editing
during ned scans (editing at 1.5ppm).
GABA and Glx attenuations in the MMnulMEGA
spectrum are related only to the MM suppression and to the T1-weighting
at the selected TI.
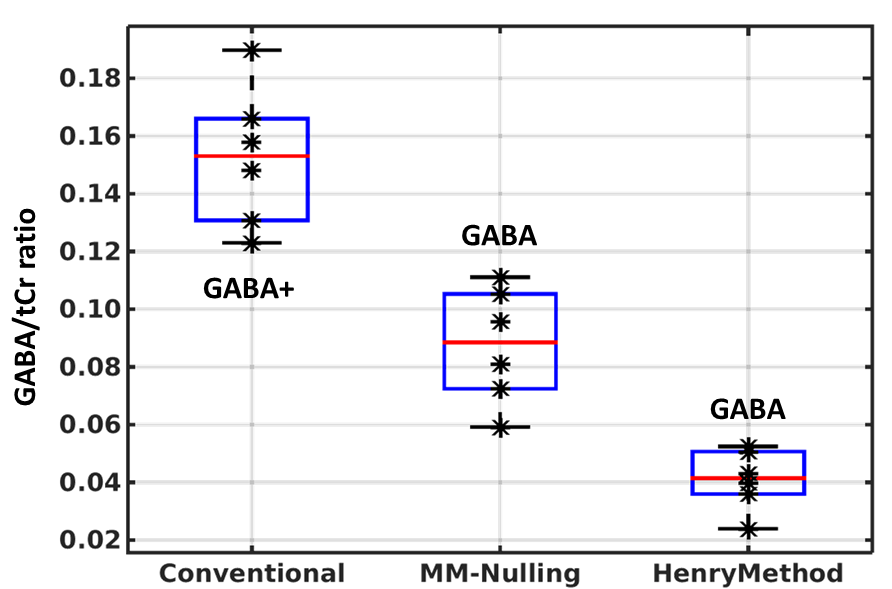
Fig.3 Distributions
of GABA+/tCr and pure GABA/tCr ratios for six subjects without (ConvMEGA, left boxplot) and with MM
suppression (MMnullMEGA: middle
boxplot; HenryMEGA: right boxplot). Compared
to the ConvMEGA scan, the MMnullMEGA and HenryMEGA scans reveal lower GABA/tCr ratios, primarily due to the
suppressed MM signal fraction in the GABA+ multiplet at 3 ppm. An
additional reduction of GABA signal in the HenryMEGA
scans may be related to the GABA co-editing while applying the editing pulse at
1.5 ppm in ned scans. In MMnulMEGA scans, the lower GABA/tCr
ratios are associated with the T1-weighting at the selected TI time.
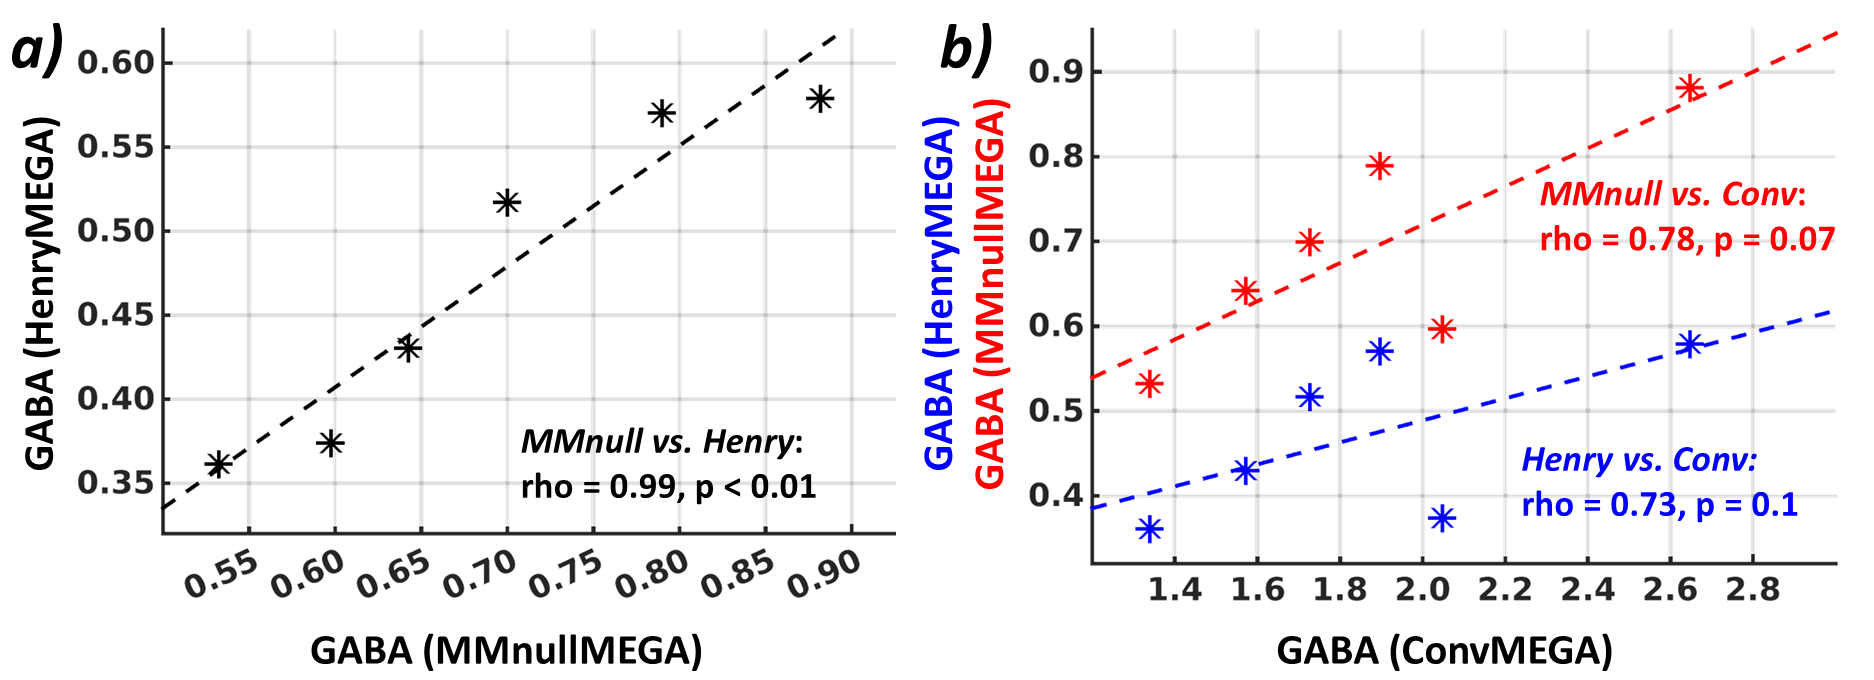
Fig.4. (a) Association
between non-normalized GABA intensities extracted from the MMnullMEGA and HenryMEGA
scans. (b) Associations between non-normalized GABA and GABA+ intensities
obtained with and without MM suppression (blue asterisks: GABA+ (ConvMEGA) vs. GABA (HenryMEGA); red
asterisks: GABA+ (ConvMEGA) vs. pure GABA (MMnullMEGA)).