1275
Optimisations for ultra-high resolution MRSI of the brain at 7 T: Towards even higher resolutions and faster measurements1High Feld MR Centre, Medical University of Vienna, Vienna, Austria, 2Christian Doppler Laboratory for Clinical Molecular MR Imaging, Vienna, Austria, 3Athinoula A. Martinos Center for Biomedical Imaging, Department of Radiology, Massachusetts General Hospital, Harvard Medical School, Boston, MA, United States, 4Russell H. Morgan Department of Radiology and Radiological Science, The Johns Hopkins University School of Medicine, Baltimore, MD, United States, 5F. M. Kirby Research Center for Functional Brain Imaging, Kennedy Krieger Institute, Baltimore, MD, United States
Synopsis
Recently, ultra-high resolution (UHR-) MRSI of the brain at 7 T was successfully demonstrated, allowing metabolic mapping at near-anatomical resolution. With this work, we propose further optimised sequences, one for shorter measurement times of under 5 min and one for even higher in-plane resolutions down to 12 µL, which will allow a more flexible application of UHR_MRSI, and show their possibilities and limitations. Furthermore, the effects of slice thickness for UHR-MRSI were investigated with a second set of measurements.
Purpose
The development of ultra-high resolution (UHR)-MRSI sequences for ultra-high fields [1,2] made it possible to increase the resolution for brain MRSI to 1.7×1.7 mm² in-plane for a 128×128 matrix. Using parallel imaging [3,4], this is feasible at clinically applicable measurement times. A matter of interest are the limits of performance of UHR-MRSI. Therefore, we tested a protocol optimised for measurement time and another protocol for a higher resolution of 1.3×1.3×7 mm³. Both make use of sequence optimisations in order to achieve a TR of 150 ms. With such high in-plane resolutions, the slice thickness is now the largest voxel dimension. This could lead to through-plane partial volume effects that blur the boundaries of smaller structures. Therefore, we further evaluated the effects of different slice thicknesses for UHR-MRSI regarding spectral quality and anatomical correspondence.Methods
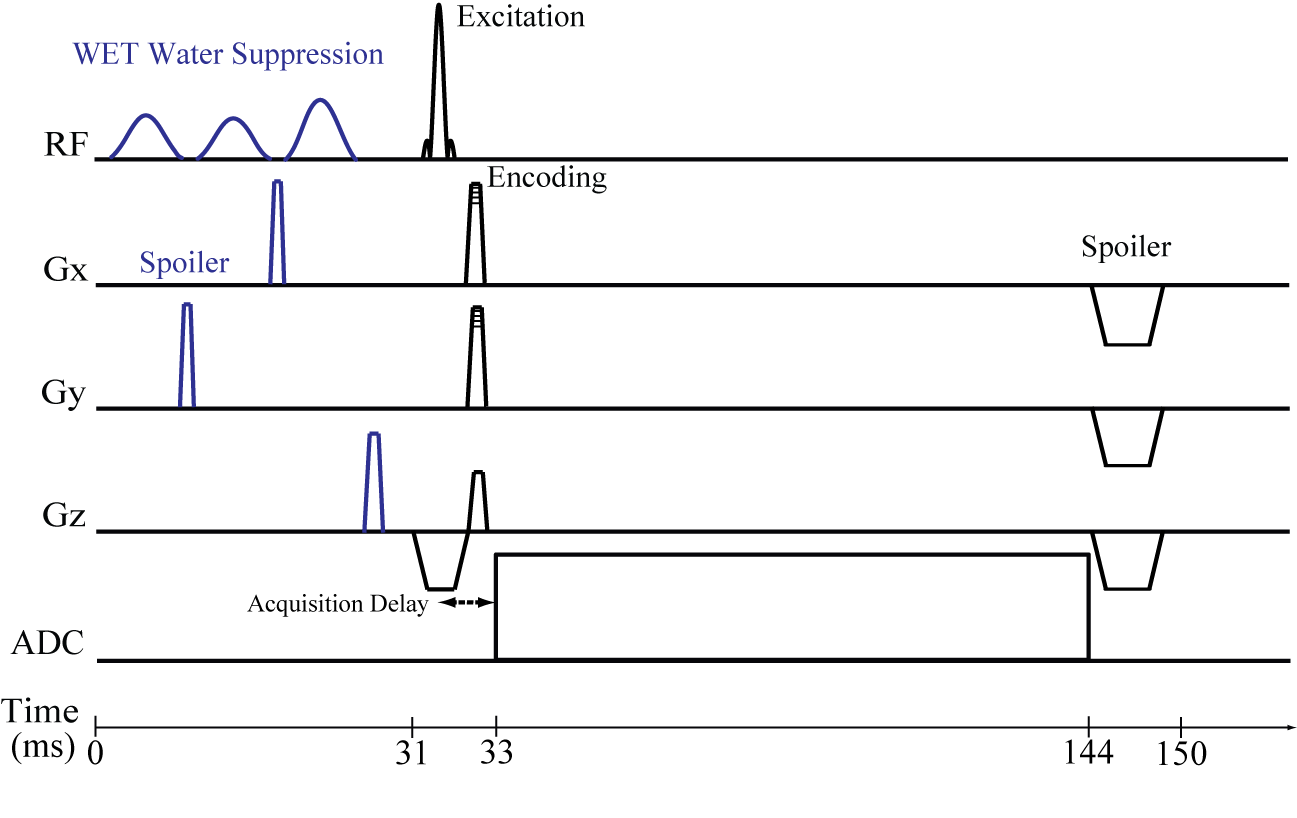
Three volunteers (two male, 27,26; one female, 26) were measured with a Siemens 7 T Magnetom scanner and a 32-channel head coil (Nova Medical). Written informed consent and approval of the institutional review board were obtained. MP2RAGE (4:39 min) and B1+-mapping sequences were acquired. All MRSI scans shared FID acquisition (Fig. 1) with an acquisition delay of 1.3 ms, FOV of 200×200 mm², 1024 readout points, CAIPIRINHA [3] acceleration and elliptical encoding and integrated GRE prescans for MUSICAL [5] coil combination. All MRSI sequences were placed transversally above the ventricles.
The first session consisted of a reference, time-optimised, and resolution-optimised scan, all with 7 mm slice thickness. The reference scan with a 64×64 matrix and a voxel volume of 3.1×3.1×7 mm³, a TR of 200 ms, a flip angle of 29°, 6000 Hz readout bandwidth, and 4×acceleration took 2.5 min. The time-optimised scan with a 100×100 matrix and a voxel volume of 2×2×7 mm³, and 4×acceleration took 4.5 min. The resolution-optimised scan with a 160×160 matrix and a voxel volume of 1.3×1.3×7 mm³, and 2×acceleration took 25 min. Both had a TR of 150 ms, a flip angle of 25°, and 9200 Hz readout bandwidth.
The second session consisted of four MRSI scans with voxel sizes of 2×2×5/10/15/20 mm³. Further parameters were a 100×100 matrix, TR 200 ms, 6600 Hz receiver bandwidth, 29° flip angle and 4×acceleration resulting in 6:08 min per MRSI scan.
Data processing used an in-house routine [6] with lipid signal removal [7], and spatial Hamming filter. The spectra were fitted between 1.8-4.2 ppm using LCModel. The spectra were evaluated for SNR (pseudo-replica method), FWHM and CRLBs for NAA. For the first session, the metabolite maps were compared to the reference scan. For the second session, metabolic maps were compared to T1-weighted images and between the different slice thicknesses as indicators for local B0-homogeneity and partial volume effects.
Results
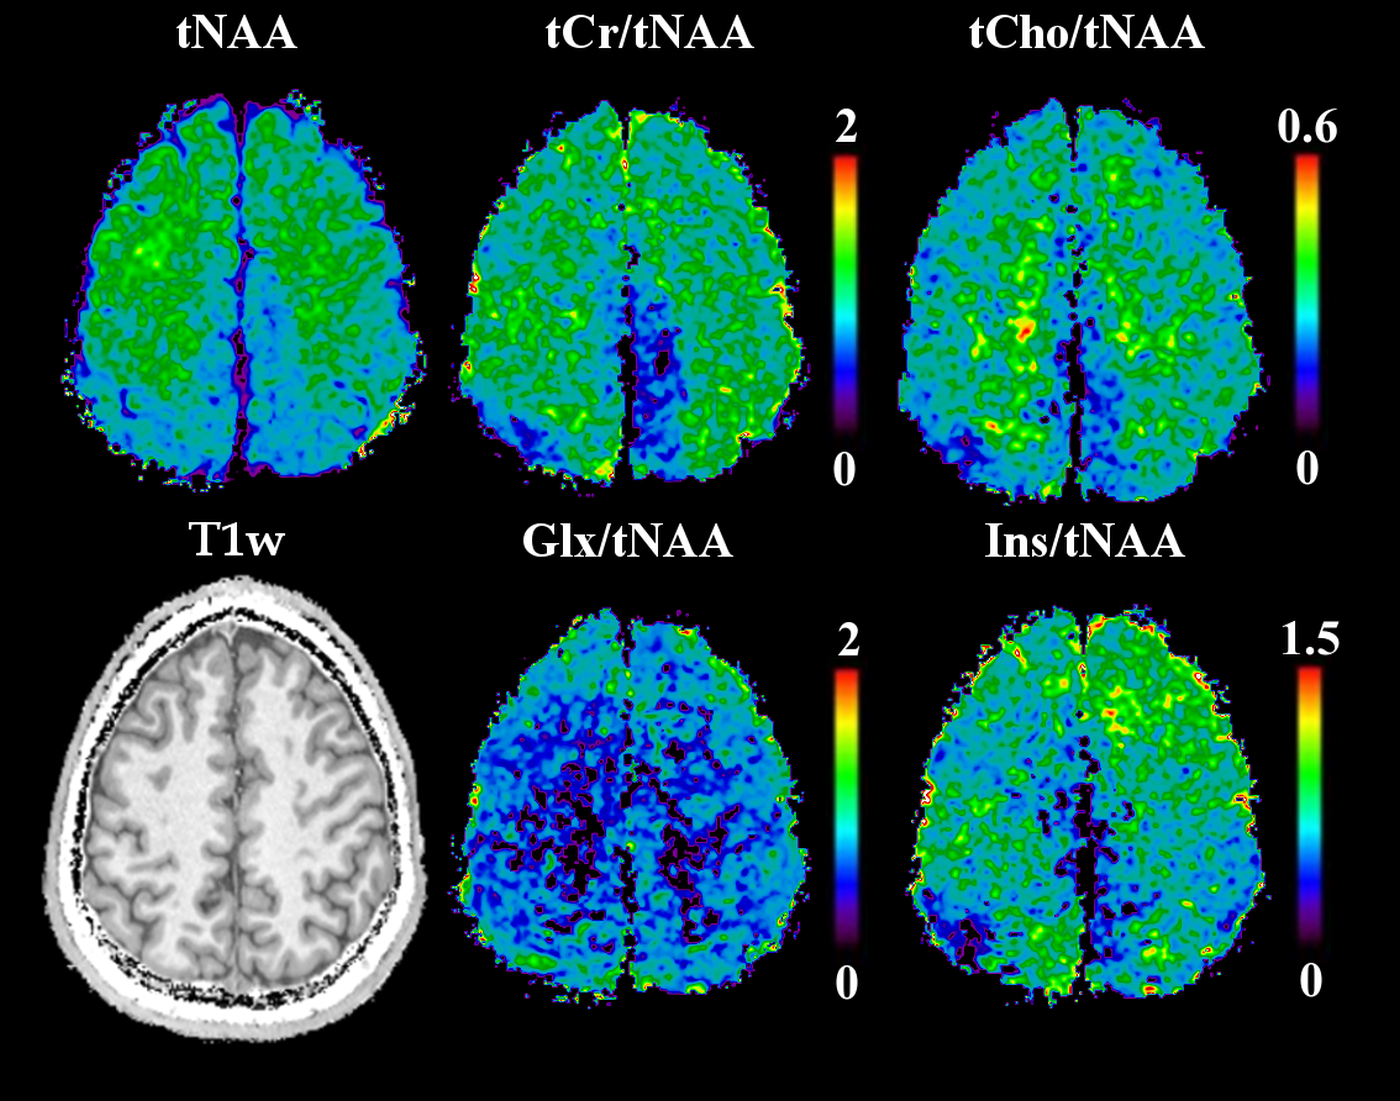
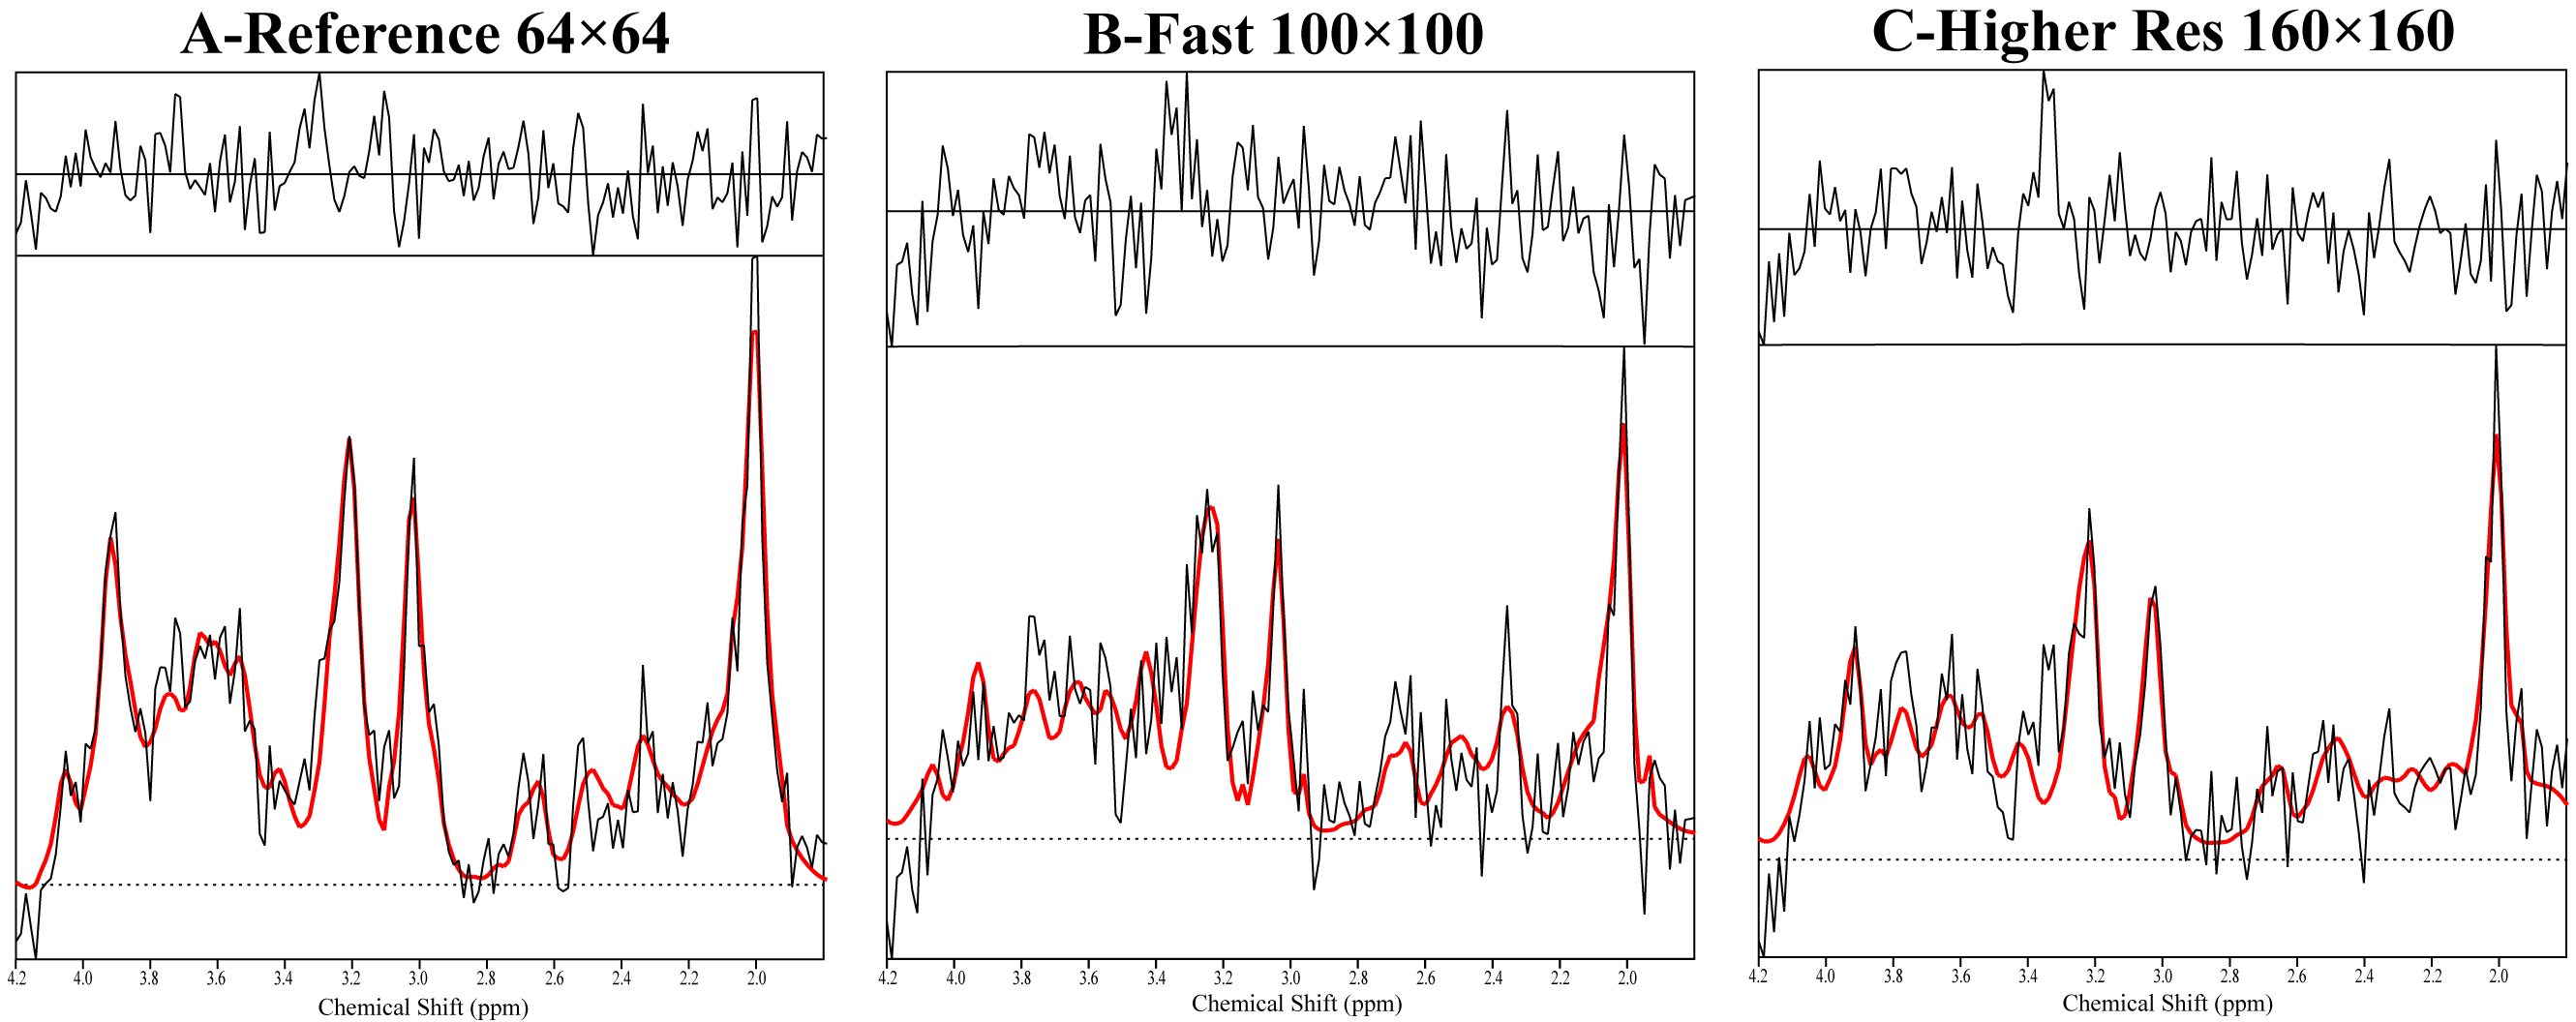
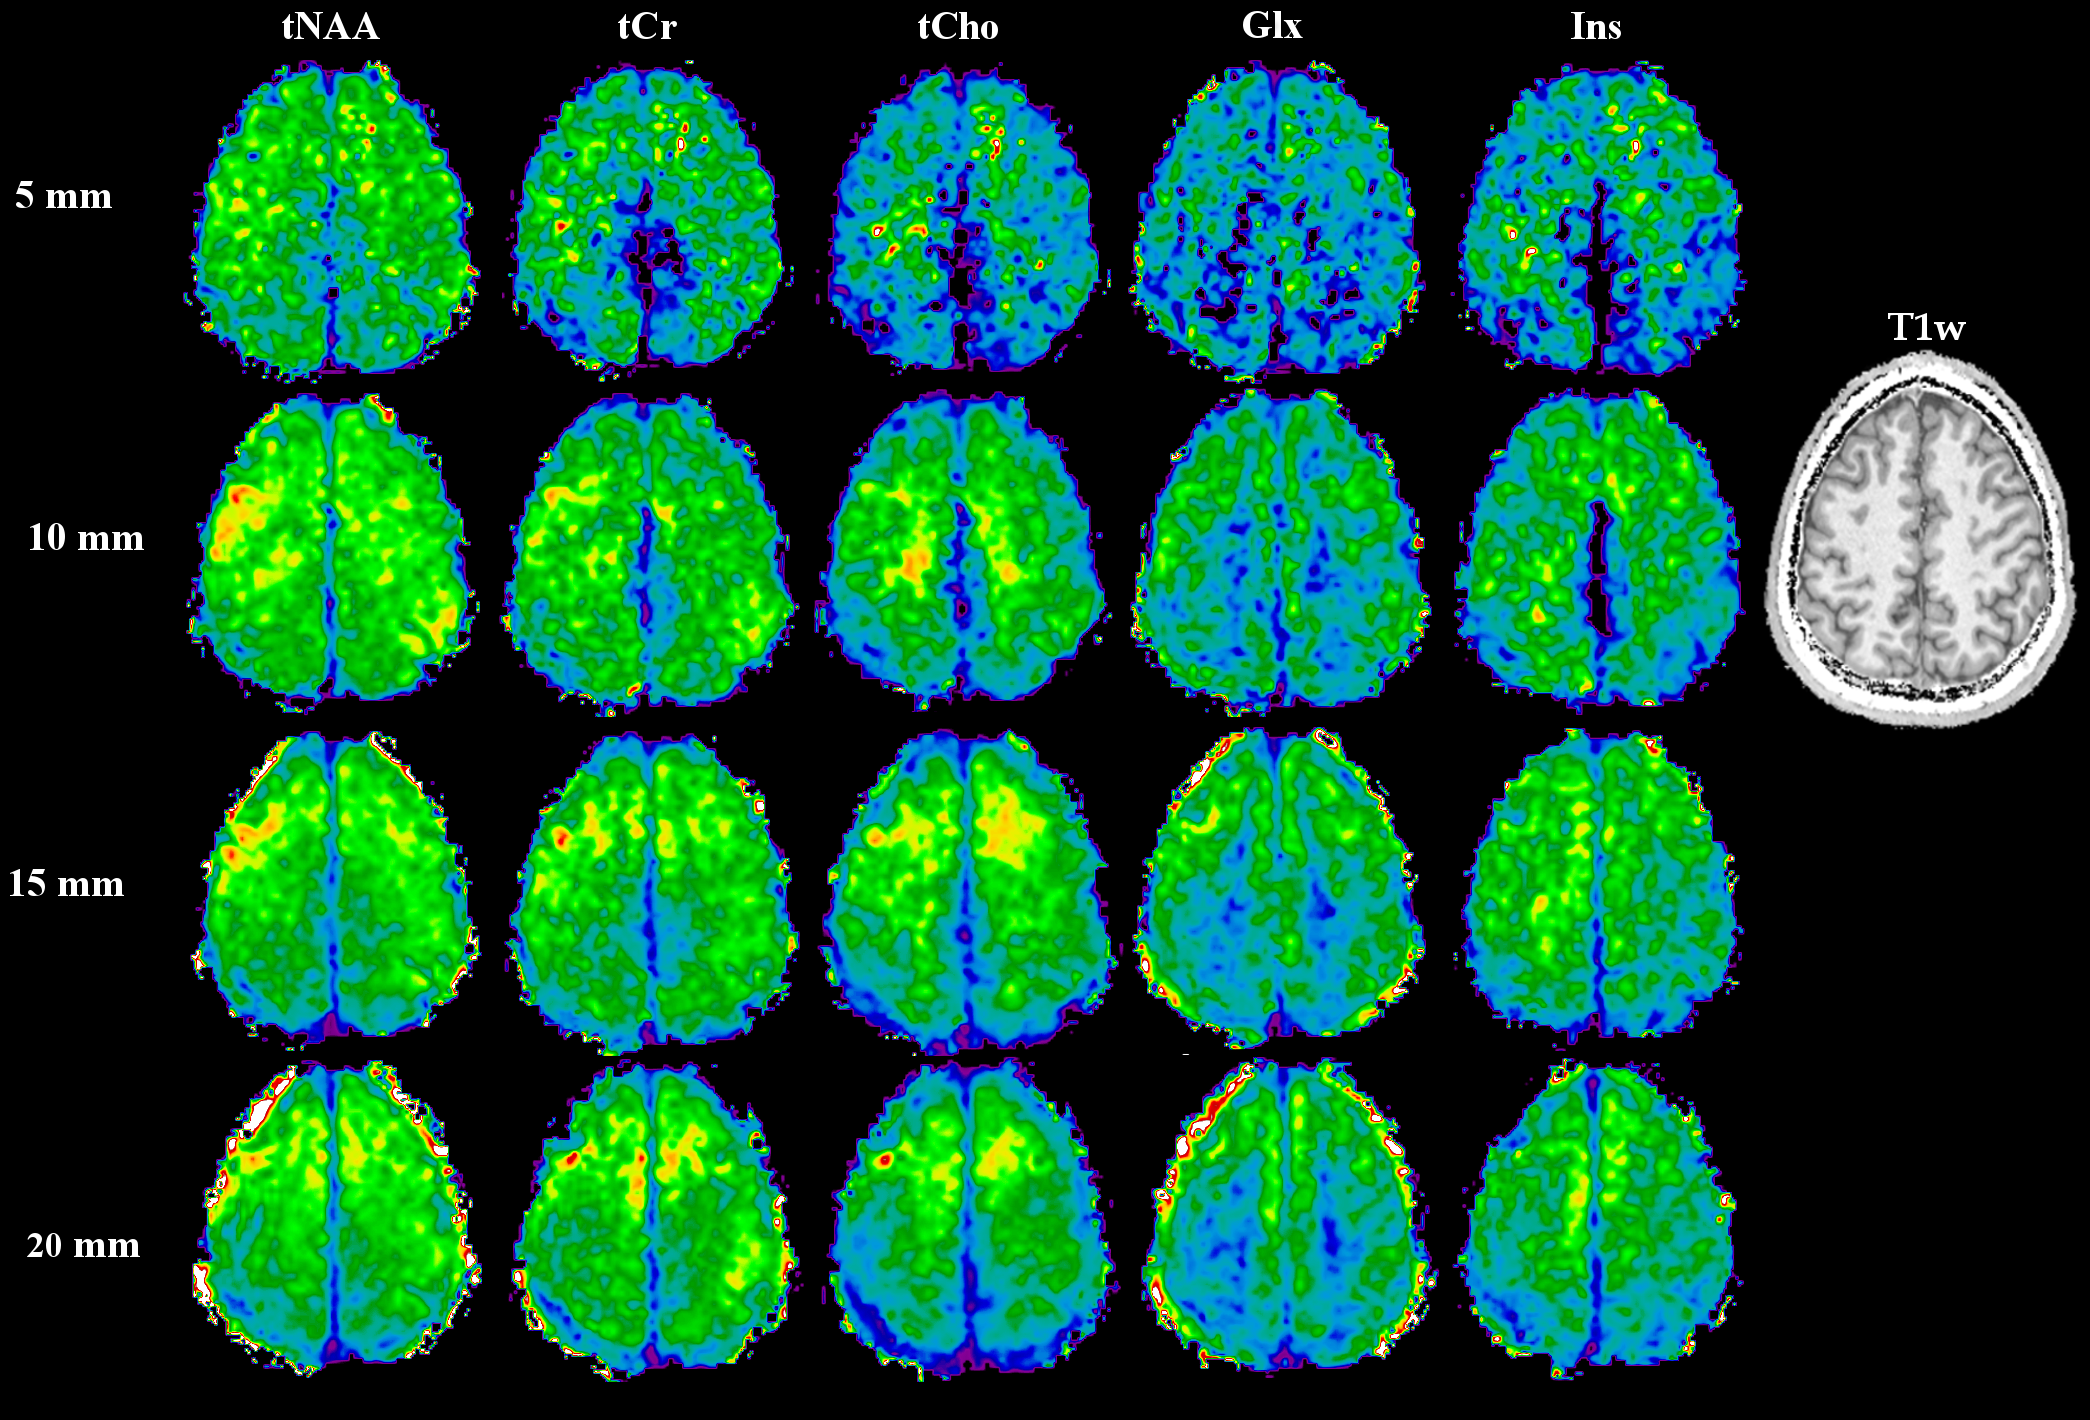
While the reference scan had an SNR of 14±4, both the time-optimised and resolution-optimised protocol had an SNR of 7±2. The according CRLBs of NAA were 14±5 % for the reference, 20±6 % for the time-optimised and 21±7 % for the resolution-optimised protocols, with respective FWHMs of 19±5/23±5/23±4 Hz. Comparing the metabolite maps of all protocols in a volunteer (Fig.2) shows that despite the lower SNR, the high resolution protocols are able to display much more anatomical details, especially the tNAA-map of the resolution-optimised protocol. The resolution-optimised maps (Fig 3.) show more structural details, but are also more affected by low signal for metabolites other than NAA. Individual spectra (Fig. 4) remain comparable between the different protocols. Regarding the slice thickness scans, the average NAA SNR values were 7±2/12±3/16±4/20±6 for 5/10/15/20 mm and 1.33±0.40/1.18±0.30/1.07±0.29/0.98±0.29 per mm thickness. FWHMs were 19±4/17±4/18±5/18±5 Hz, showing no significant differences. In the metabolite maps (Fig. 5), the 5 mm scan shows the closest anatomical correspondence to the T1w-image.Discussion
Our results confirm that it is possible to enhance the performance of UHR-MRSI with minimised TRs. The time-optimised protocol allows UHR-MRSI to be applied to clinical questions like the measurement of MS lesions. The resolution-optimised protocol, achieving the unprecedented resolution of 12 µL, can be applied to basic research of the brain. An alternative to these techniques could be the use of modern interpolation strategies such as patch-based superresolution [8] with lower-resolution MRSI sequences.
The slice thickness protocol showed a positive effect on voxel homogeneity volume for the smallest thickness (highest relative SNR) as well as the best correspondence to anatomical imaging. Therefore, smaller slice thicknesses or approaches for 3D-coverage of the brain could lead to a major improvement of 7 T brain MRSI applications compared to only increasing in-plane resolutions.
Acknowledgements
This study was supported by the Austrian Science Fund (FWF): KLI 646 and P 30701 as well as the FFG Bridge Early Stage Grant #846505.References
[1] Hangel et al., NeuroImage 2016, doi: 10.1016/j.neuroimage.2016.10.043[2] Nassirpour et al., NeuroImage 2016, doi: 10.1016/j.neuroimage.2016.12.065
[3] Hangel et al., NMR in Biomed 2015; 28(11): 1413-25
[4] Strasser et al., MRM 2016; 78(2):429-440
[5] Strasser et al.; NMR in Biomed 2013; 26(12): 1796-805
[6] Považan et al., Proc. Intl. Soc. MRM 23 (2015): 1973
[7] Bilgic et al., JMRI 2014; 40(1):181-191
[8] Jain et al., Front Neurosci 2017, doi: 10.3389/fnins.2017.00013
Figures