1266
The presence of brown adipose tissue is associated with thyroid function in subjects with low and normal BMI1Department of Diagnostic and Interventional Radiology, Technical University of Munich, Munich, Germany, 2Else Kröner Fresenius Center for Nutritional Medicine, Technical University of Munich, Munich, Germany, 3Department of Diagnostic and Interventional Neuroradiology, Technical University of Munich, Munich, Germany, 4Philips Research Laboratory, Hamburg, Germany
Synopsis
Brown adipose tissue (BAT) is important for energy and glucose metabolism in humans. Thyroid hormones regulate BAT development and function. Proton density fat fraction (PDFF) mapping based on a multi-echo gradient echo acquisition enables spatially-resolved fat quantification and can be indicative of the presence of BAT in adults. This study investigates the relationship between supraclavicular PDFF as surrogate marker for BAT, and serum levels of free thyroxine and free triiodothyronine with body mass index (BMI) as grouping variable.
Purpose
Recent studies suggest that brown adipose tissue (BAT) plays a role in energy and glucose metabolism in humans1. Thyroid hormones are main regulators of BAT development and function2 and they have been linked with increased BAT activity3,4 as well as with browning of white adipose tissue (WAT)5. On the other hand, thyroid hormones have been shown to impact on all components of the metabolic syndrome6,7 and to be associated with body mass index (BMI)8. Proton density fat fraction (PDFF) mapping based on a multi-echo gradient echo acquisition has recently enabled spatially-resolved fat quantification in multiple organs. Liver PDFF has been emerging as a major metabolic phenotyping parameter9. In addition, recent reports have suggested that PDFF values in the supraclavicular fossa can be indicative of the presence of brown fat in adults10,11. However, it remains unknown how the PDFF of adipose tissue relates to thyroid hormones. Therefore, the purpose of this study was to investigate the relationship between supraclavicular PDFF as surrogate marker for BAT, and serum levels of free thyroxine (FT4) and free triiodothyronine (FT3) with BMI as grouping variable.Methods
Subjects & measurements: For this prospective study, 62 healthy subjects (40 females and 22 males; median BMI 24.1 kg/m², range 17.2-35.6 kg/m²; median age 29.2 years, range 21.2-77.3 years) were recruited. Exclusion criteria were thyroid disease, thyroid hormone use, and contraindications to MRI. Subjects underwent an MRI of the neck and the abdomen/ pelvis on a 3T scanner (Ingenia, Philips Healthcare). In order to measure the supraclavicular and gluteal PDFF, a six-echo multi-echo gradient echo sequence with bipolar gradients was used: TR = 12 ms, TE1 = 1.24 ms, ΔTE = 1.0, flip angle = 5°, bandwidth = 1413 Hz/pixel, 268x200x93 acquisition matrix size, FOV = 400x300x140 mm³, 1.5 mm isotropic voxel size, SENSE with R = 2.5.
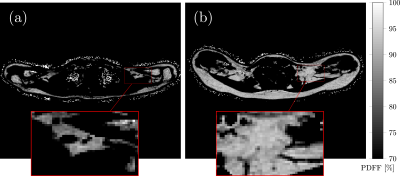
Data analysis: PDFF maps were generated using the online complex-based fat quantification algorithm, accounting for known confounding factors including the presence of multiple fat peaks, a single T2* correction and phase errors (Figure 1). For segmentation of the supraclavicular and subcutaneous fat, a custom-built MATLAB-algorithm was used, delineating the deep supraclavicular and gluteal subcutaneous fat pockets bilaterally12. Blood samples were collected and FT3 (pg/ml) and FT4 levels (ng/dl) were determined. BMI was calculated as weight in kg divided by height squared in m² and subjects were divided into two groups: BMI < 25 kg/m² (n=36) and BMI ≥ 25 kg/m² (n=26).
Results
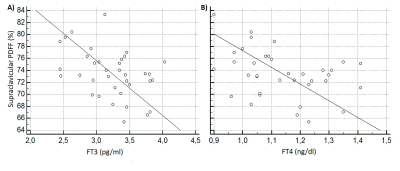
PDFF in the supraclavicular fossa was 75.8 ± 4.9 (65.4-85.2) % and the PDFF of subcutaneous gluteal fat was 89.2±3.3 (81.4-94.1) %, resulting in a highly significant difference in PDFF between the supraclavicular fat and subcutaneous gluteal fat (p < 0.0001). PDFF in supraclavicular fat was positively associated with FT3 and FT4 in the BMI <25 group (r=-0.42, p=0.011 and r=-0.37, p=0.025) (Figure 2). No correlation could be found between PDFF in gluteal subcutaneous fat and FT3 or FT4 in the BMI <25 group. No correlation was found between adipose tissue PDFF and the thyroid hormones in the BMI ≥ 25 group.Discussion & Conclusion
The present study shows a highly significant difference between the PDFF in different fat regions, pointing towards brown fat being present in the supraclavicular adipose tissue in adults. Furthermore, PDFF in the supraclavicular fat correlates with FT3 and FT4 in subjects with low to normal BMI (<25 kg/m²). Therefore, the present findings suggest that (1) adipose tissue PDFF can not only identify the presence of brown fat in the supraclavicular adipose tissue, but (2) might also serve as new biomarker for the effects of thyroid hormones on adipose composition at rest, BAT activation and WAT browning.Acknowledgements
The present work was supported by the European Research Council (grant agreement No 677661 – ProFatMRI) and Philips Healthcare.References
1. Chondronikola M, Volpi E, Borsheim E, Porter C, Saraf MK, Annamalai P, et al. Brown Adipose Tissue Activation Is Linked to Distinct Systemic Effects on Lipid Metabolism in Humans. Cell Metab. 2016;23(6):1200-6. DOI: 10.1016/j.cmet.2016.04.029
2. Lahesmaa M, Orava J, Schalin-Jantti C, Soinio M, Hannukainen JC, Noponen T, et al. Hyperthyroidism increases brown fat metabolism in humans. J Clin Endocrinol Metab. 2014;99(1):E28-35. DOI: 10.1210/jc.2013-2312
3. Broeders EP, Vijgen GH, Havekes B, Bouvy ND, Mottaghy FM, Kars M, et al. Thyroid Hormone Activates Brown Adipose Tissue and Increases Non-Shivering Thermogenesis--A Cohort Study in a Group of Thyroid Carcinoma Patients. PLoS One. 2016;11(1):e0145049. DOI: 10.1371/journal.pone.0145049
4. Bianco AC, Silva JE. Intracellular conversion of thyroxine to triiodothyronine is required for the optimal thermogenic function of brown adipose tissue. J Clin Invest. 1987;79(1):295-300. DOI: 10.1172/JCI112798
5. Martinez-Sanchez N, Moreno-Navarrete JM, Contreras C, Rial-Pensado E, Ferno J, Nogueiras R, et al. Thyroid hormones induce browning of white fat. J Endocrinol. 2017;232(2):351-62. DOI: 10.1530/JOE-16-0425
6. Roos A, Bakker SJ, Links TP, Gans RO, Wolffenbuttel BH. Thyroid function is associated with components of the metabolic syndrome in euthyroid subjects. J Clin Endocrinol Metab. 2007;92(2):491-6. DOI: 10.1210/jc.2006-1718
7. Iwen KA, Schroder E, Brabant G. Thyroid hormones and the metabolic syndrome. Eur Thyroid J. 2013;2(2):83-92. DOI: 10.1159/000351249
8. Knudsen N, Laurberg P, Rasmussen LB, Bulow I, Perrild H, Ovesen L, et al. Small differences in thyroid function may be important for body mass index and the occurrence of obesity in the population. J Clin Endocrinol Metab. 2005;90(7):4019-24. DOI: 10.1210/jc.2004-2225
9. Hu HH, Kan HE. Quantitative proton MR techniques for measuring fat. NMR Biomed. 2013;26(12):1609-29. DOI: 10.1002/nbm.3025
10. Franz D, Karampinos DC, Rummeny EJ, Souvatzoglou M, Beer AJ, Nekolla SG, et al. Discrimination Between Brown and White Adipose Tissue Using a 2-Point Dixon Water-Fat Separation Method in Simultaneous PET/MRI. J Nucl Med. 2015;56(11):1742-7. DOI: 10.2967/jnumed.115.160770
11. Franssens BT, Eikendal AL, Leiner T, van der Graaf Y, Visseren FL, Hoogduin JM. Reliability and agreement of adipose tissue fat fraction measurements with water-fat MRI in patients with manifest cardiovascular disease. NMR Biomed. 2016;29(1):48-56. DOI: 10.1002/nbm.3444
12. Franz D, Weidlich D, Freitag F, Holzapfel C, Drabsch T, Baum T, et al. Association of proton density fat fraction in adipose tissue with imaging-based and anthropometric obesity markers in adults. Int J Obes (Lond). 2017. DOI: 10.1038/ijo.2017.194
Figures

