1264
Multiphase Hepatocyte-Specific Contrast Enhanced MRI of Liver in a Non-Human Primate Model of Ebola1Integrated Research Facility, National Institute of Allergy and Infectious Diseases, National Institute of Health, Frederick, MD, United States, 2Clinical Research Directorate/Clinical Monitoring Research Program, NCI Campus at Frederick, Leidos Biomedical Research, Inc., Frederick, MD, United States, 3Emerging Viral Pathogens Section, National Institute of Allergy and Infectious Diseases, National Institute of Health, Frederick, MD, United States
Synopsis
The purpose of this experiment was to assess the impact of Ebola virus infection on liver function during the acute phase of Ebola virus disease (EVD) in the rhesus macaque model in vivo imaging in a Biosafety level-4 facility. Multiphase liver-specific contrast, Eovist, enhanced MRI technique could detect the EVD liver failure. We observed a decreasing trend of Eovist uptake in the liver and biliary execution, and an increasing trend of liver volume with disease progression. Our findings highlight the spatiotemporal differences in Eovist uptake in a non-human primate model of Ebola.
Introduction
Ebola virus disease (EVD) is a viral hemorrhagic fever with 100% morbidity rate and approximately 41% fatality rate. Previous work with both aerosol and intramuscular infections of Ebola virus in non-human primates have shown that the lymph nodes, liver, lung, and spleen are involved early, and such findings are often based on viral titers with histological correlation [1, 2]. The purpose of this study was to use multiphase contrast-enhanced MRI to determine if structural or functional alterations occur in the liver of rhesus macaques exposed to Ebola virus via intramuscularly. This experiment evaluated the acute impact of EVD on liver contrast uptake function, as assessed using contrast-enhanced dynamic MRI.Methods
Three rhesus monkeys were exposed to 1000 pfu of EBOV Makona c05 by intramuscular injection. Animals underwent MR imaging pre-exposure (Baseline (BL)) and post-exposures (day 2 (D2), day 5 and at terminal timepoint (days 6 or 9)). Subjects were anesthetized with isoflurane, and positioned supine on the scanner bed. Images were acquired both pre- and post-gadoxetate disodium (Gd-EOB-DTPA, Eovist, Bayer Pharma AG, Berlin, Germany) administration at a dose of 0.1ml/kg per imaging session. The work was approved by the NIAID Division of Clinical Research Animal Care and Use Committee. Abdominal imaging was performed using a Philips Achieva 3 Tesla clinical MR scanner (Philips Healthcare, Cleveland, OH, USA) and an 8-channel pediatric SENSE torso coil. T1 High Resolution Isotropic Volume Excitation (THRIVE) sequences were performed in axial and coronal planes. Series with breath holds were taken before and after contrast administration (pre, 10s, 70s, minutes 3, 5, 10, 15, 20, 25, 30, 35, 40 post) in-plane resolution of 1.8x1.8x1.5mm3, FOV 145x145x120mm3, 80 slices. Other parameters include TR/TE=3.1/1.49ms, NSA=1, flip angle= 0o, TFE factor = 50, 13 seconds per breath hold. To characterize the Eovist kinetics during rhesus EVD, liver volumetric regions of interest (VOI) on liver (14mm diameter) were manually defined over the THRIVE phases at each time point and the signal intensity (SI) values were plotted against time. In addition, we collected blood serum samples and measured liver function enzymes, alanine aminotransferase (ALT) and aspartate aminotransferase (AST) and necropsy data.Results
Qualitative inspection of MR data found that the enhancement of normal liver was substantially greater with Gd-EOB-DTPA compare to diseased liver and revealed time-dependent enhancement in the liver and biliary tract that decreased with disease progression. MR images of the liver were consistent with fulminant, acute hepatitis and hepatic failure (Fig1). Post-contrast T1-weighted images on D5, D6 (not shown) and D9 support progression of acute hepatitis and fulminant liver failure (Fig1). Liver no longer became hyperintense relative to intrahepatic vessels. There was a marked decrease in diffuse SI and degree of enhancement following Gd-EOB-DTPA administration. Decreased SI was observed during disease progression with a peak change from 10 min at BL to 70 seconds at D6 post-exposure. Quantitative assessment demonstrated a63±7% decrease in the area under the curve (Fig2). and an increase in liver volume from 72.0±3.6ml at BL to 134.1±11.6ml at the terminal timepoint. Table 1 shows the values of ALT and AST. AST/ALT ratio increased 150% compare to the baseline. Necropsy showed hepatocellular degeneration and necrosis, multifocal, diffuse, moderate with intracytoplasmic eosinophilic viral inclusion bodies and congestion.Discussion
MRI and other imaging modalities can augment traditional methodologies by providing real-time evaluation of organ system changes. The clinical course and MRI findings of a case of human EVD with sequential multi-organ failure has been reported [3]. Gd-EOB-DTPA has been used to evaluate other virus induced liver diseases including Hepatitis B infection [4]. Our results are consistent with a previous non-human primate study [5]. The onset of liver failure is rapid, and the MR imaging can detect advanced liver failure in EVD using hepatocyte-specific contrast agents before changes in serum tests. There was prolonged retention of contrast material in hepatic vessels and aorta, which remained hyperintense throughout the examination, indicating lack of extraction secondary to hepatic and renal failure (Fig1-d, h and Fig2). Decreasing trend with disease progression and the quick washout on the D6 (Fig2) indicate the liver failure which were confirmed ALT and AST values.Conclusion
Advanced abdominal imaging during Ebola virus infection using multiphase contrast-enhance MRI demonstrates the ability to identify changes associated with acute liver failure in EVD. We demonstrated diagnostic findings with the MR imaging that correlated well with clinical, laboratory and necropsy data. Use of hepatocyte-specific contrast material was very useful in this setting and provided important results. The imaging findings may be diagnostic and have therapeutic and prognostic implications.Acknowledgements
Animal Ethics Statement: Animals were housed in an AAALAC-International-accredited facility. All experimental procedures were approved by the NIAID Division of Clinical Research (DCR) Animal Care and Use Committee and were in compliance with the Animal Welfare Act regulations, Publish Health Service policy, and the Guide for the Care and Use of Laboratory Animals recommendations.
Funding: This work was supported by NIAID Division of Intramural Research and NIAID DCR and was performed under Battelle Memorial Institute contract (No. HHSN272200700016I) with NIAID. Additional support was provided by the NCI Contract No. HHSN261200800001E.
References
1. Geisbert, T.W., et al., Pathogenesis of Ebola hemorrhagic fever in cynomolgus macaques: evidence that dendritic cells are early and sustained targets of infection. Am J Pathol, 2003. 163(6): p. 2347-70.
2. Twenhafel, N.A., et al., Pathology of experimental aerosol Zaire ebolavirus infection in rhesus macaques. Vet Pathol, 2013. 50(3): p. 514-29.
3. Chertow, D.S., et al., Severe Meningoencephalitis in a Case of Ebola Virus Disease: A Case Report. Ann Intern Med, 2016. 165(4): p. 301-4.
4. Lee, G.M., et al., Quantitative Measurement of Hepatic Fibrosis with Gadoxetic Acid-Enhanced Magnetic Resonance Imaging in Patients with Chronic Hepatitis B Infection: A Comparative Study on Aspartate Aminotransferase to Platelet Ratio Index and Fibrosis-4 Index. Korean Journal of Radiology, 2017. 18(3): p. 444-451.
5. Runge, V.M., A comparison of two MR hepatobiliary gadolinium chelates: Gd-BOPTA and Gd-EOB-DTPA. J Comput Assist Tomogr, 1998. 22(4): p. 643-50.
Figures
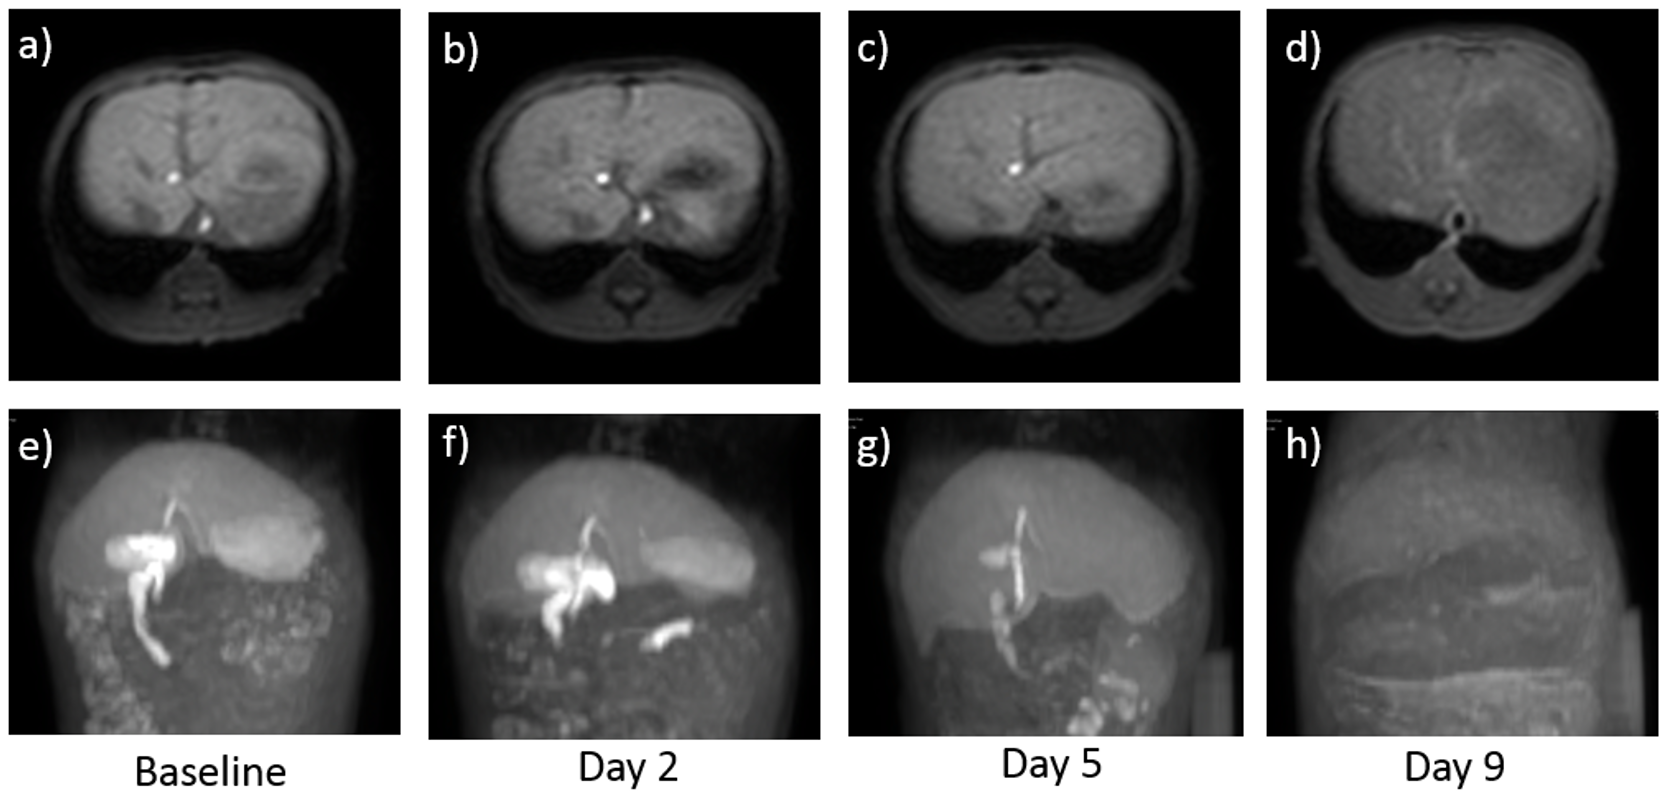
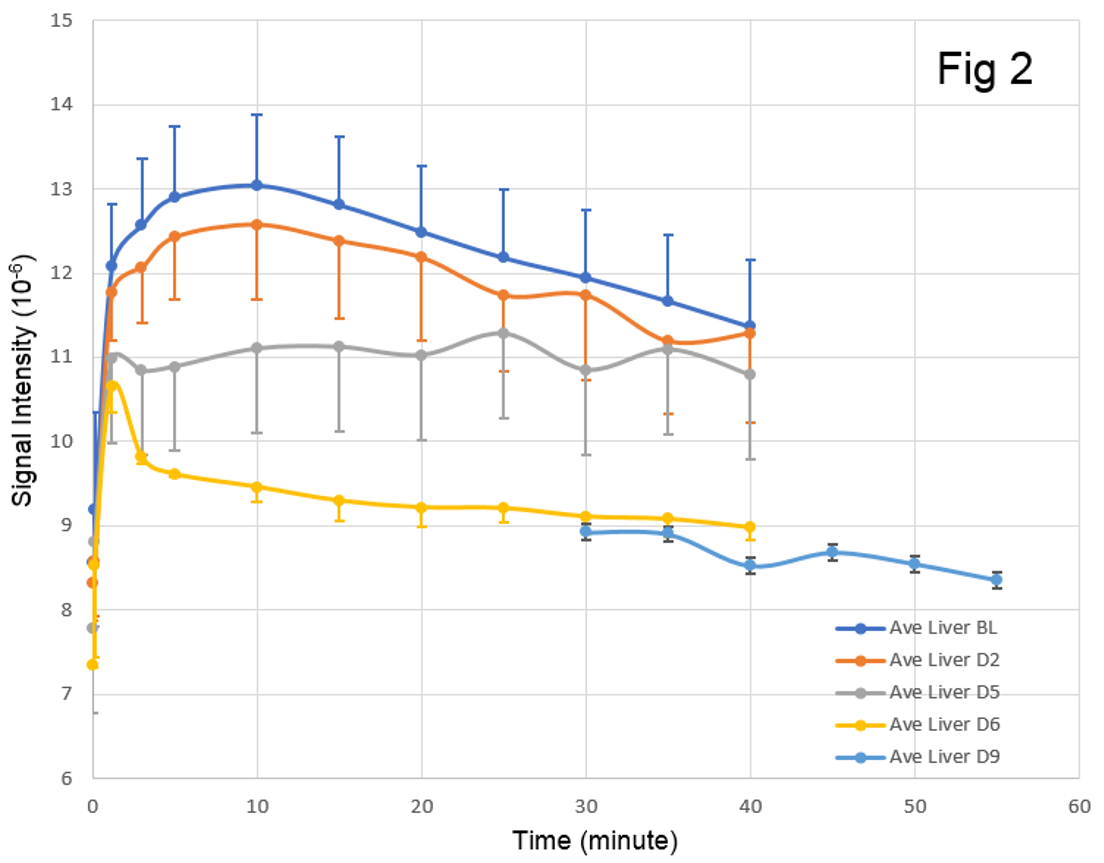
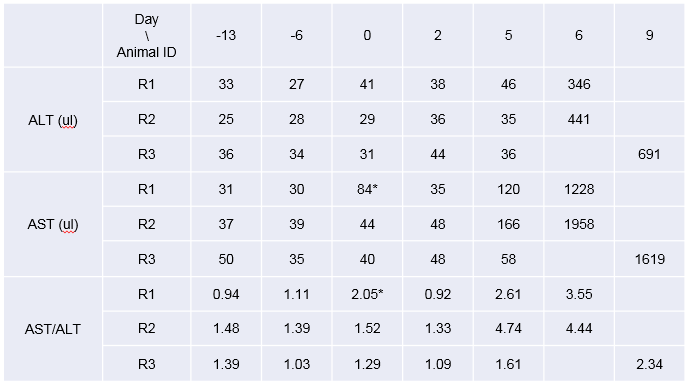
Table 1. Alanine Aminotrasferase (ALT) and Aspartate Aminotrasferase (AST) values
* data is high due to hemolysis