1263
Principles for measuring whole kidney nephron endowment in mice with in vivo MRI1Physics, University of Hawaii at Manoa, HONOLULU, HI, United States, 2Pediatrics, University of Virginia, Charlottesville, VA, United States, 3Biology, University of Hawaii at Manoa, Honolulu, HI, United States
Synopsis
Nephron endowment is a strong predictor for renal health and nephron loss is a hallmark of early development of chronic kidney disease, but there are no techniques to measure nephron endowment in vivo. Here, we performed CFE-MRI in rats and mice to determine the limits of in vivo measurements of nephron endowment in vivo. We correlated in vivo measurements with measurements from ex vivo, high-resolution images of same kidneys. This work lays the foundation for consistent and accurate whole kidney glomerular number and size measurements in the mouse and rat kidney, in vivo.
Background
Kidney disease is a rapidly growing epidemic affecting a significant percent of the population in both cause of death and cause of disability1. Nephron endowment is a strong predictor for renal health and nephron loss is a hallmark of early development of chronic kidney disease, but there are no techniques to measure nephron endowment in vivo. A recently developed method using cationic ferritin enhanced MRI (CFE-MRI) has revealed the ability of measuring whole kidney nephron endowment in the live rat2. However, many genetic models of human renal disease have been developed in the mouse, which represents a more challenging problem in imaging due to the size of the glomeruli ( ~80um) and image sensitivity and motion. Here, we performed CFE-MRI in rats and mice to determine the limits of in vivo measurements of nephron endowment in vivo. We correlated in vivo measurements with measurements from ex vivo, high-resolution images of same kidneys.Methods
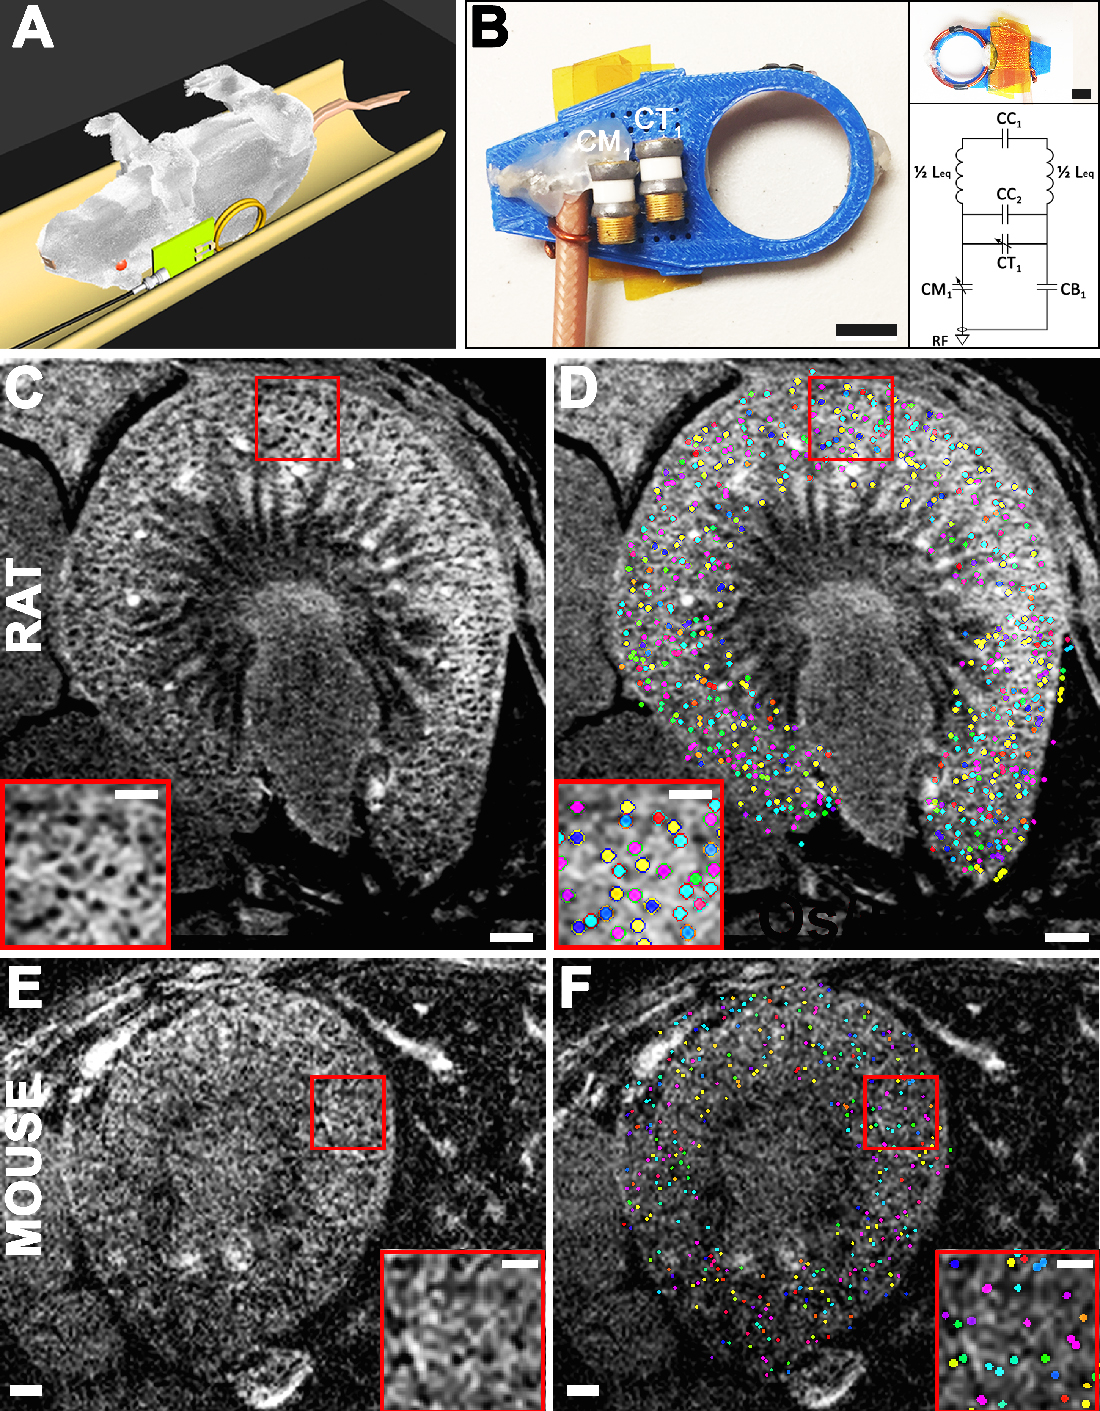
Hardware - Custom TxRx RF probes with differing coil diameters were created for each species (26mm for rats and 16mm for mice) to optimize single kidney imaging and reduce coverage over other tissue. In vivo MRI - Adult male Sprague-Dawley rats (Charles River, 200-300g, n = 4) and adult male C57Bl/6 mice (Charles River, 20-26g, n=1) received IV injections of CF (Sigma Aldrich) at 90-minute intervals. Varying amounts of CF was administered to test contrast against background. CF was given at a dose of 19.2 mg/kg/injection and for rats in 3 (n=3) and 4 (n=1) total injections and 28.8 mg/kg/injection for mice with 3 total injections. Ninety minutes after the final injection, animals were sedated and in vivo MRI was performed on a Bruker ClinScan 7T/30 MRI (Bruker). The RF probe was positioned over the right kidney (Fig. 1, A-B). Breathing was monitored and gated for imaging. A susceptibility weighted imaging 3(SWI) protocol was used and comprising a T2*-weighted 3D gradient recalled echo (GRE) sequence (Rats: TE/TR = 14/70; Flip Angle (FA) = 25 degrees; resolution = 70.2 x 70.2 x 140 μm3| Mice: TE/TR = 14/70; FA = 30 degrees; resolution = 47 x 47 x 100 μm3). with flow compensation in the readout direction. After in vivo imaging, kidneys were resected and stored in 2% gluteraldehyde in 0.1M sodium cacodylate for high-resolution ex vivo MRI. Ex vivo MRI - For ex vivo imaging, kidneys were imaged with a high-resolution SWI protocol composed of a T2* weighted, 3D-GRE sequence (TE/TR = 20/80; FA = 30; resolution(Rats) = 50.8 x 50.8 x 90 μm3; resolution(Mice) = 45 x 45 x 70 μm3). Image processing - Custom software was created in MATLAB (The Mathworks) based on a previously published algorithms to identify and measure glomeruli in 3D MRI data sets for both in vivo and ex vivo images2,4.Results
We were able to identify glomeruli with CFE-MRI within the rat and mouse kidney, in vivo (Fig. 1, C-F), and also measure whole kidney glomerular number and size distribution. Ex vivo MRI also confirmed dark punctate labeling in the kidney cortex in all kidneys. Average Nglom in rats measured in vivo, was 36,972 ± 2,141, compared with an ex vivo average of 35,682 ± 2,135. Average glomerular size (aVglom) in the same rats was 4.47 ± 1.70 and 4.68 ± 1.92, x 10-4 mm3 in in vivo and ex vivo experiments, respectively. Nglom and aVglom measured in the mouse was 13,883 / 12,262 and 2.80±0.66 / 2.62±0.73 x 10⁻⁴ mm3 for in vivo / ex vivo experiments, respectively.Discussion
Here we used the method of CFE-MRI to detect and measure glomerular number and morphology in vivo in the rat and mouse kidney. Measured values of Nglom and aVglom did not deviate more than 10% between in vivo and ex vivo measurements. The combination of a custom coil and respiratory gating enabled such sensitive structural identification and measurement. We found that the signal-to-noise ratio (SNR) in rat 3D images were over 30% greater than mouse 3D images. A significant cause for this is the 3-fold increase in resolution needed to detect the smaller mouse glomeruli. Although respiratory motion was gated for, motion artifact was still present to a minor degree in mouse 3D images compared to almost none in the rat and thus contributed to the noise in the images. Further work is needed to account for residual motion in the mouse and improve the imaging protocol along with SNR. This work lays the foundation for consistent and accurate whole kidney glomerular number and size measurements in the mouse and rat kidney, in vivo.Acknowledgements
No acknowledgement found.References
1. Perico N, Remuzzi G. Chronic kidney disease: a research and public health priority. Nephrology Dialysis Transplantation 2012; 27: iii19–iii26.
2. Baldelomar EJ, Charlton JR, Beeman SC et al. Measuring rat kidney glomerular number and size <em>in vivo</em> with MRI. Am. J. Physiol. Renal Physiol. 2017.
3. Haacke EM, Xu Y, Cheng Y-CN et al. Susceptibility weighted imaging (SWI). Magn. Reson. Med. 2004; 52: 612–618.
4. Baldelomar EJ, Charlton JR, Beeman SC et al. Phenotyping by magnetic resonance imaging nondestructively measures glomerular number and volume distribution in mice with and without nephron reduction. Kidney Int 2016; 89: 498–505.
Figures