1262
Applying T2 Relaxation Under Spin Tagging (TRUST) to assess renal oxygenation in the kidney1Sir Peter Mansfield Imaging Centre, The University of Nottingham, Nottingham, United Kingdom
Synopsis
T2 Relaxation Under Spin Tagging (TRUST) provides a method to measure oxygenation in venous vessels within the brain. Here, a TRUST scheme is adapted for use within the body, specifically to assess oxygenation in the renal vein, using a respiratory-triggered Flow-sensitive Alternating Inversion Recovery (FAIR) labelling technique. This FAIR-TRUST variant has been tested in the brain, its reproducibility assessed in the kidney, and used to measure a change in blood oxygenation during an oxygen challenge. Changes in renal vein oxygenation could be measured more robustly than changes in BOLD T2*, the current MRI standard tissue oxygenation assessment within the kidney.
Purpose
The current method to assess renal oxygenation is BOLD T2* mapping. However, cortical and medullary T2* maps1 are sensitive to other factors such as susceptibility effects, baseline blood flow, and volume. This could potentially limit the ability to draw quantitative conclusions2, with variable conclusions in the literature as to whether these maps can measure changes in response to increased oxygen intake3. Susceptibility-based oximetry has been used within the body to measure oxygen saturation, however the angle of the renal vein (RV) to the B0 field limits its use in the kidneys4. T2 Relaxation Under Spin Tagging (TRUST) is an alternative method to measure blood oxygenation which has successfully been applied in the brain, and presented in the liver5. This uses a combination of labelled and control images at different T2-weightings to measure T2, from which blood oxygenation can be derived using an empirical calibration curve6. Here, we develop a modified TRUST sequence for use in the body, where, in combination with renal vein and artery flow, the rate of metabolism in the kidneys can be calculated.Methods
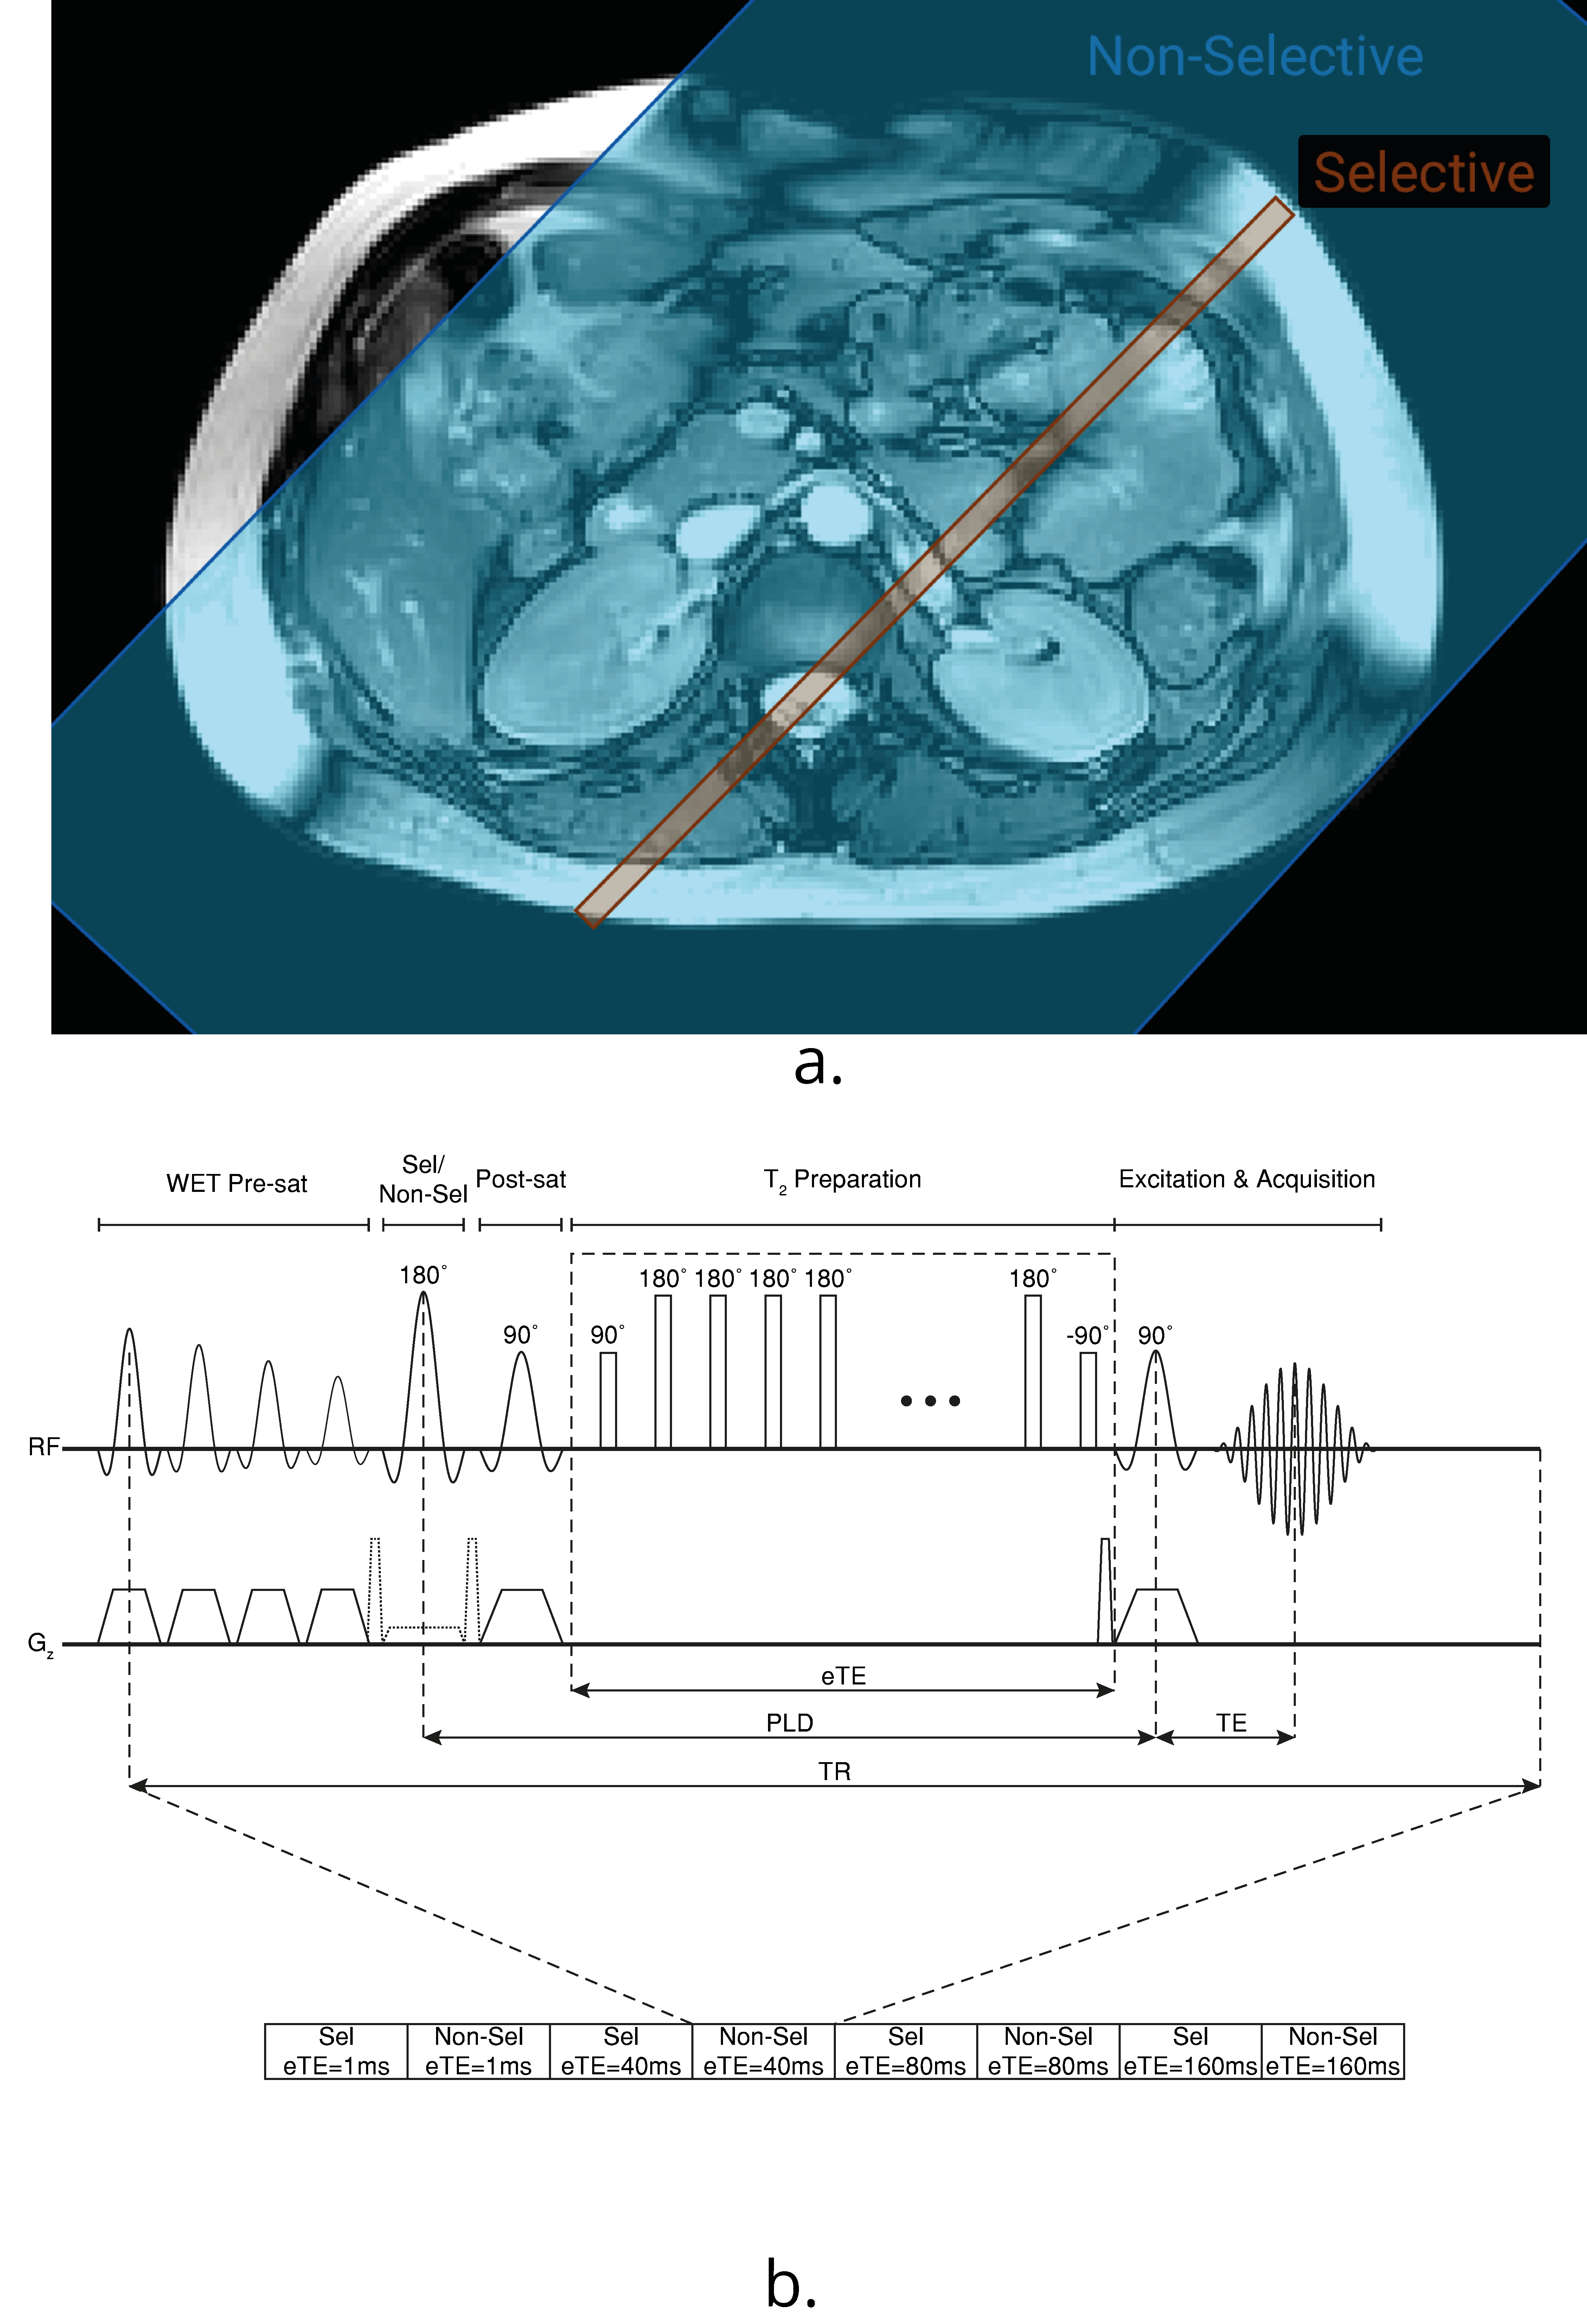
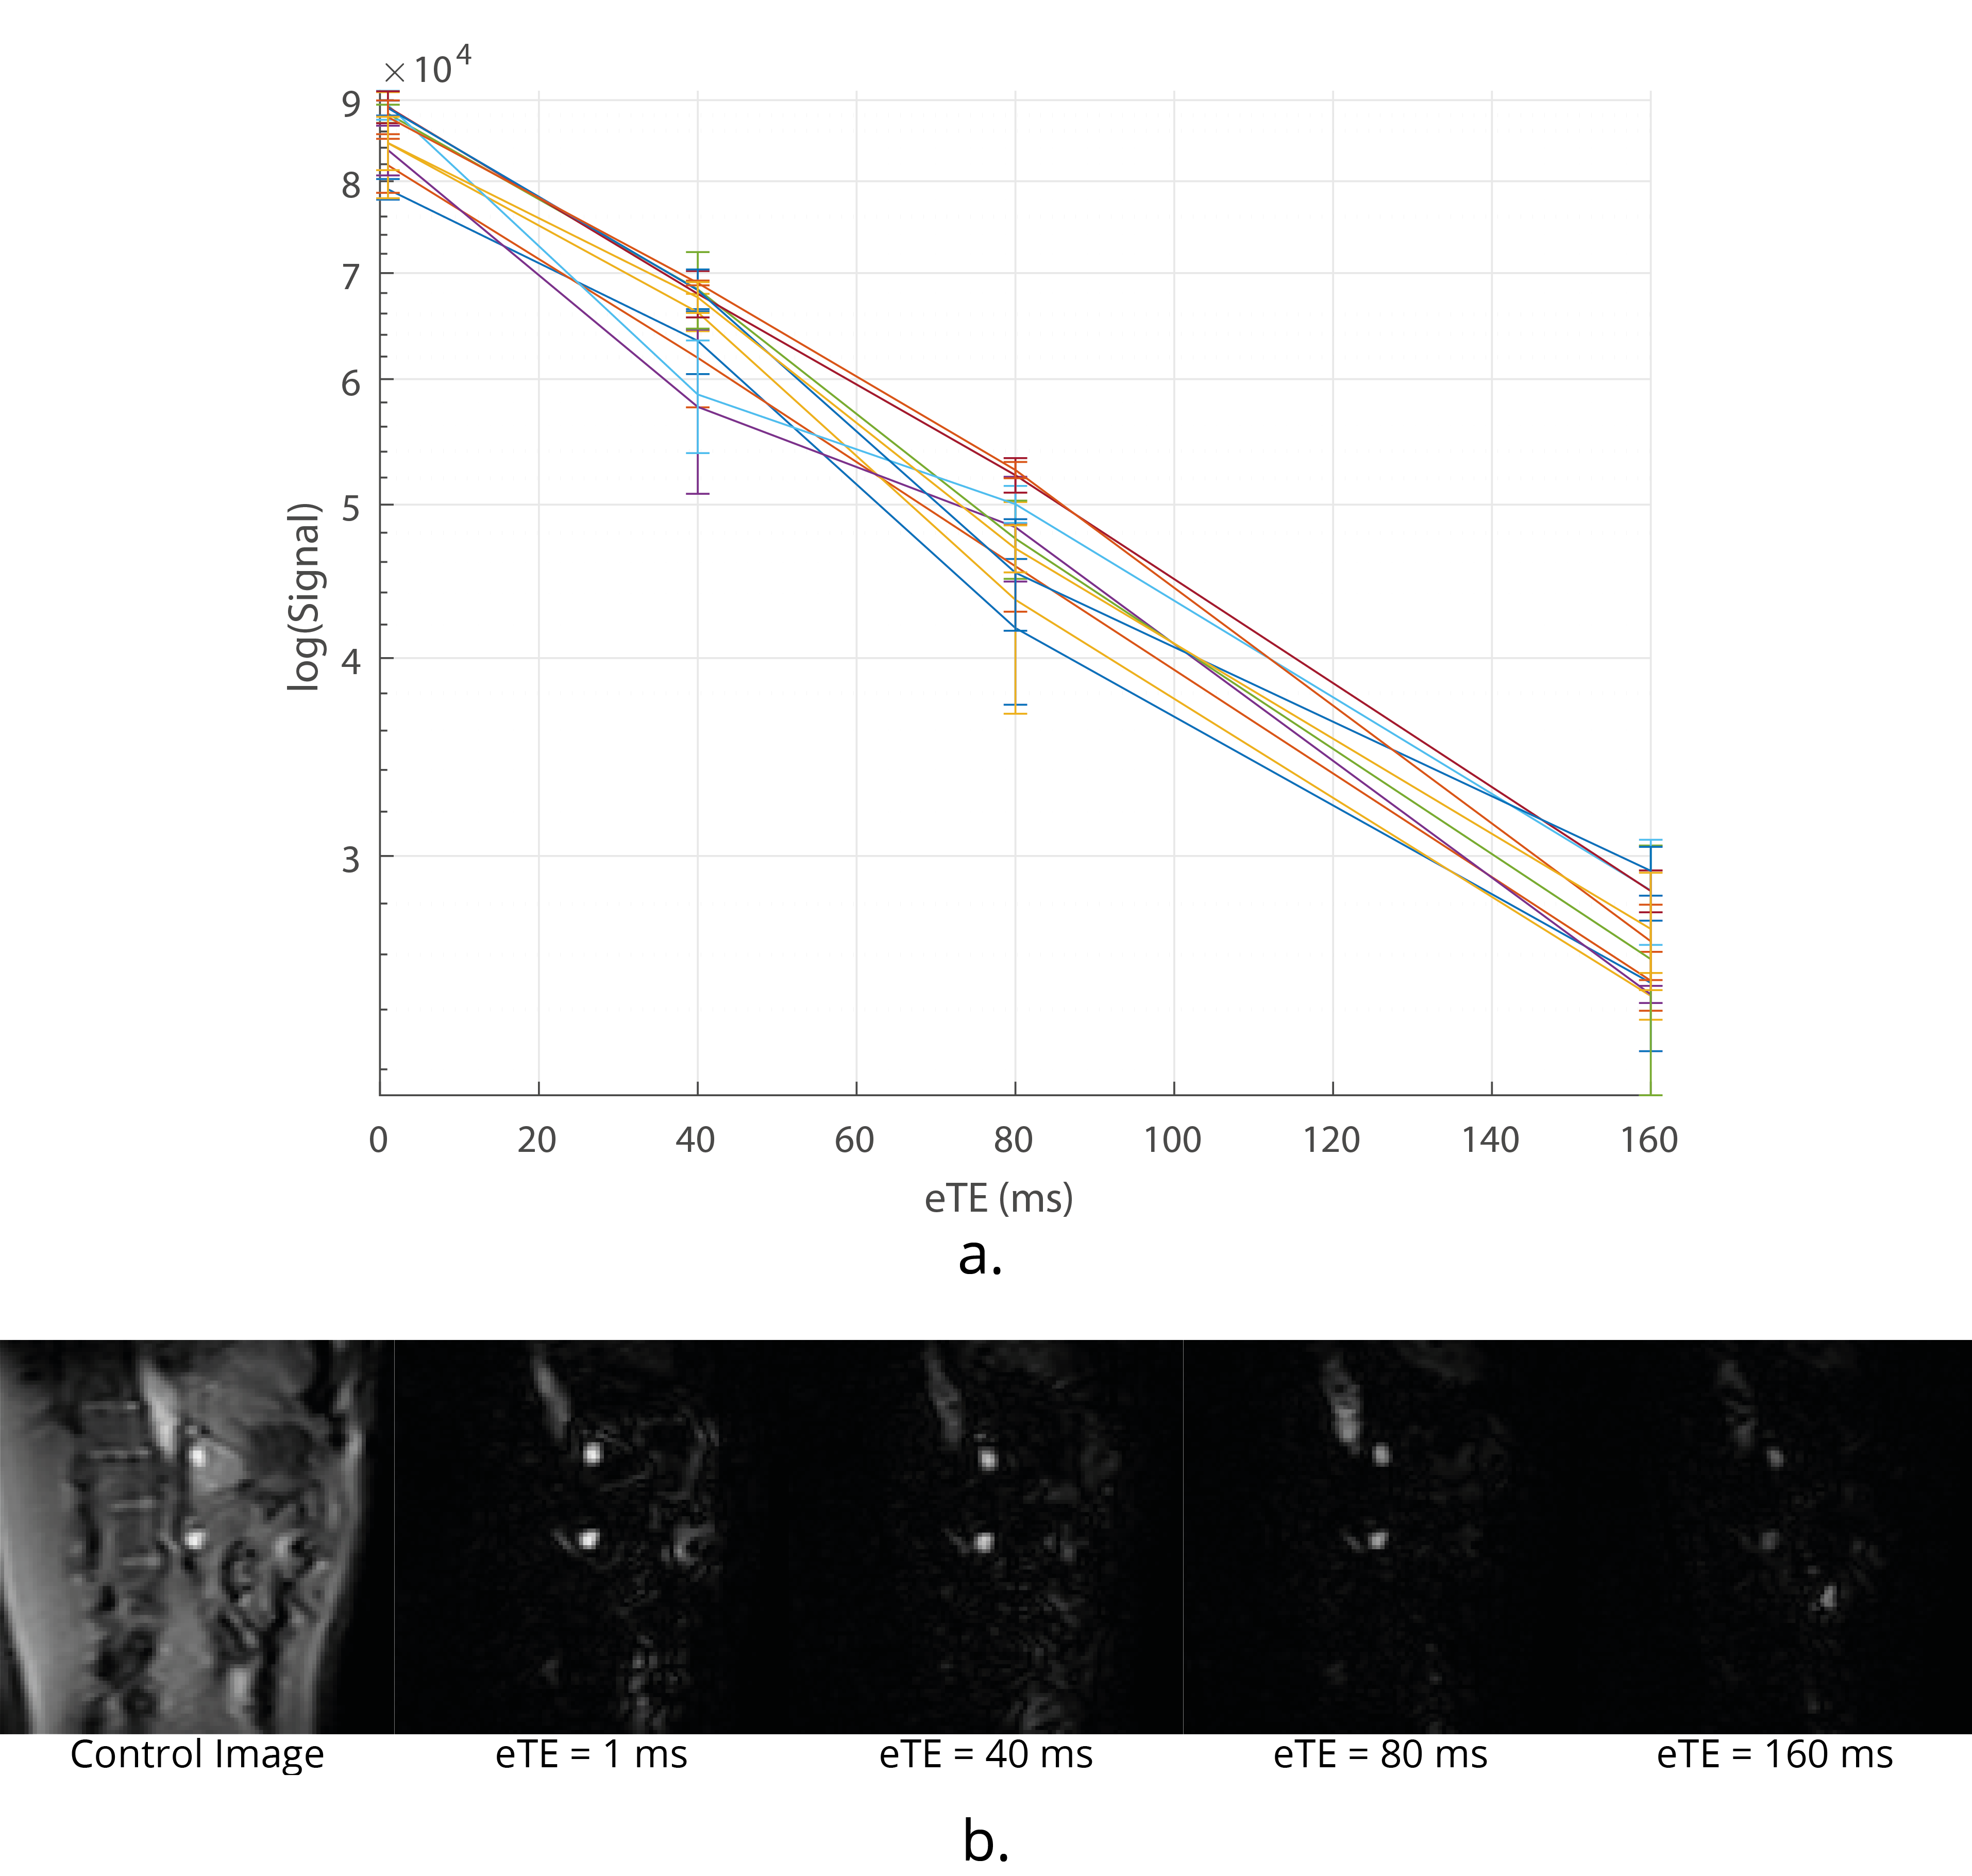
Data Acquisition: TRUST in the brain uses a Transfer Insensitive Labelling Technique (TILT) scheme. However, Flow-sensitive Alternating Inversion Recovery (FAIR) labelling is optimal for use in the body7 (Fig.1A). A respiratory triggered FAIR-based TRUST scheme was developed and data collected with eTEs of 1 ms, 40 ms, 80 ms and 160 ms, three selective/non-selective image pairs acquired at each, an outline of the sequence (Fig.1B). The FAIR-TRUST scheme was validated in the brain on the superior sagittal sinus (SSS) (Fig.2) and reproducibility assessed in the renal vein (RV) by repeating the scan ten times across a single session (Fig.4). To determine the optimal parameters, data was collected at a range of post-label delay (PLD) times from 400 to 1400 ms. To assess sensitivity to detect a change in RV oxygenation, subjects were scanned using BOLD T2* imaging, FAIR-TRUST and T1 mapping while breathing room air and pure oxygen delivered at 15 litres per minute.
Data Analysis: TRUST analysis was performed by subtracting each label from control at each eTE and averaging (RV data was inspected for respiratory motion). Nine voxels with greatest intensities within the vessel were averaged for each eTE (including repeats) and fit to $$$\Delta S = S_0 e^{eTE \left(\dfrac{1}{T_1} + \dfrac{1}{T_2} \right )}$$$ where S is the signal intensity and T1 was assumed to be 1624 ms to compute T2 from which to estimate blood oxygen saturation using a calibration curve6,8. BOLD R2* and R1 maps were generated and regions of interest defined in the renal cortex and medulla and the mean values computed during air and oxygen.
Results
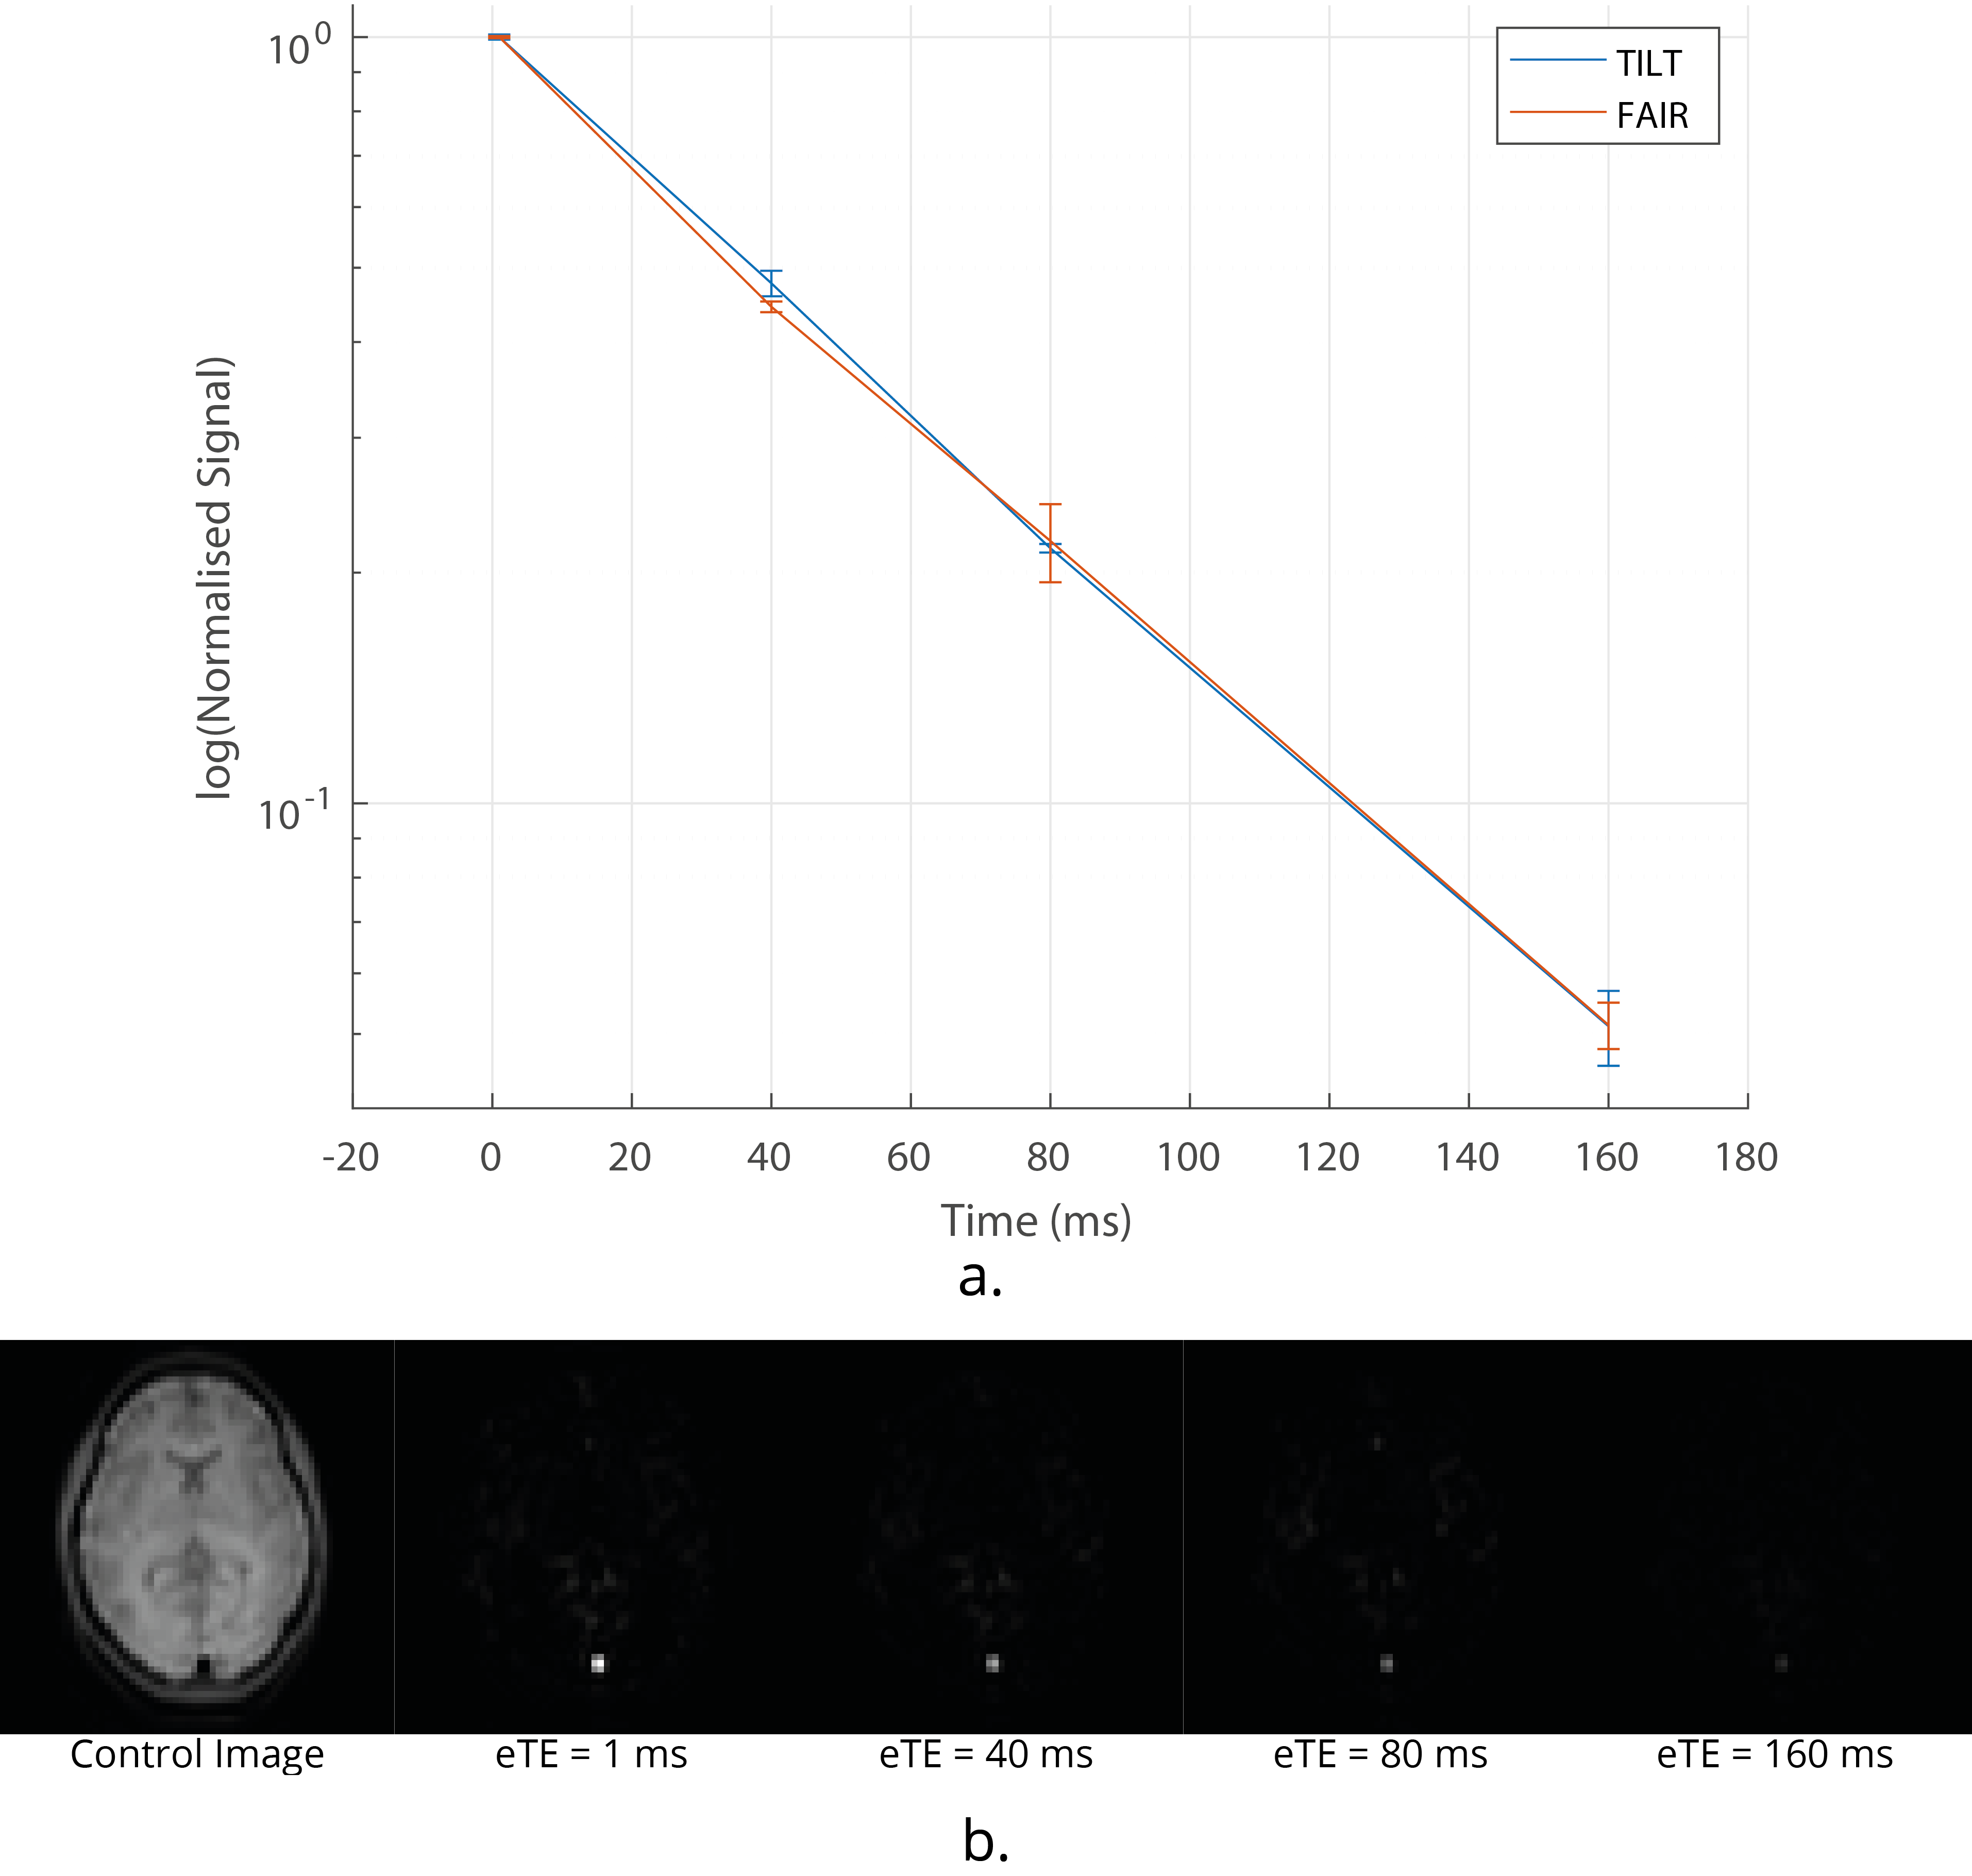
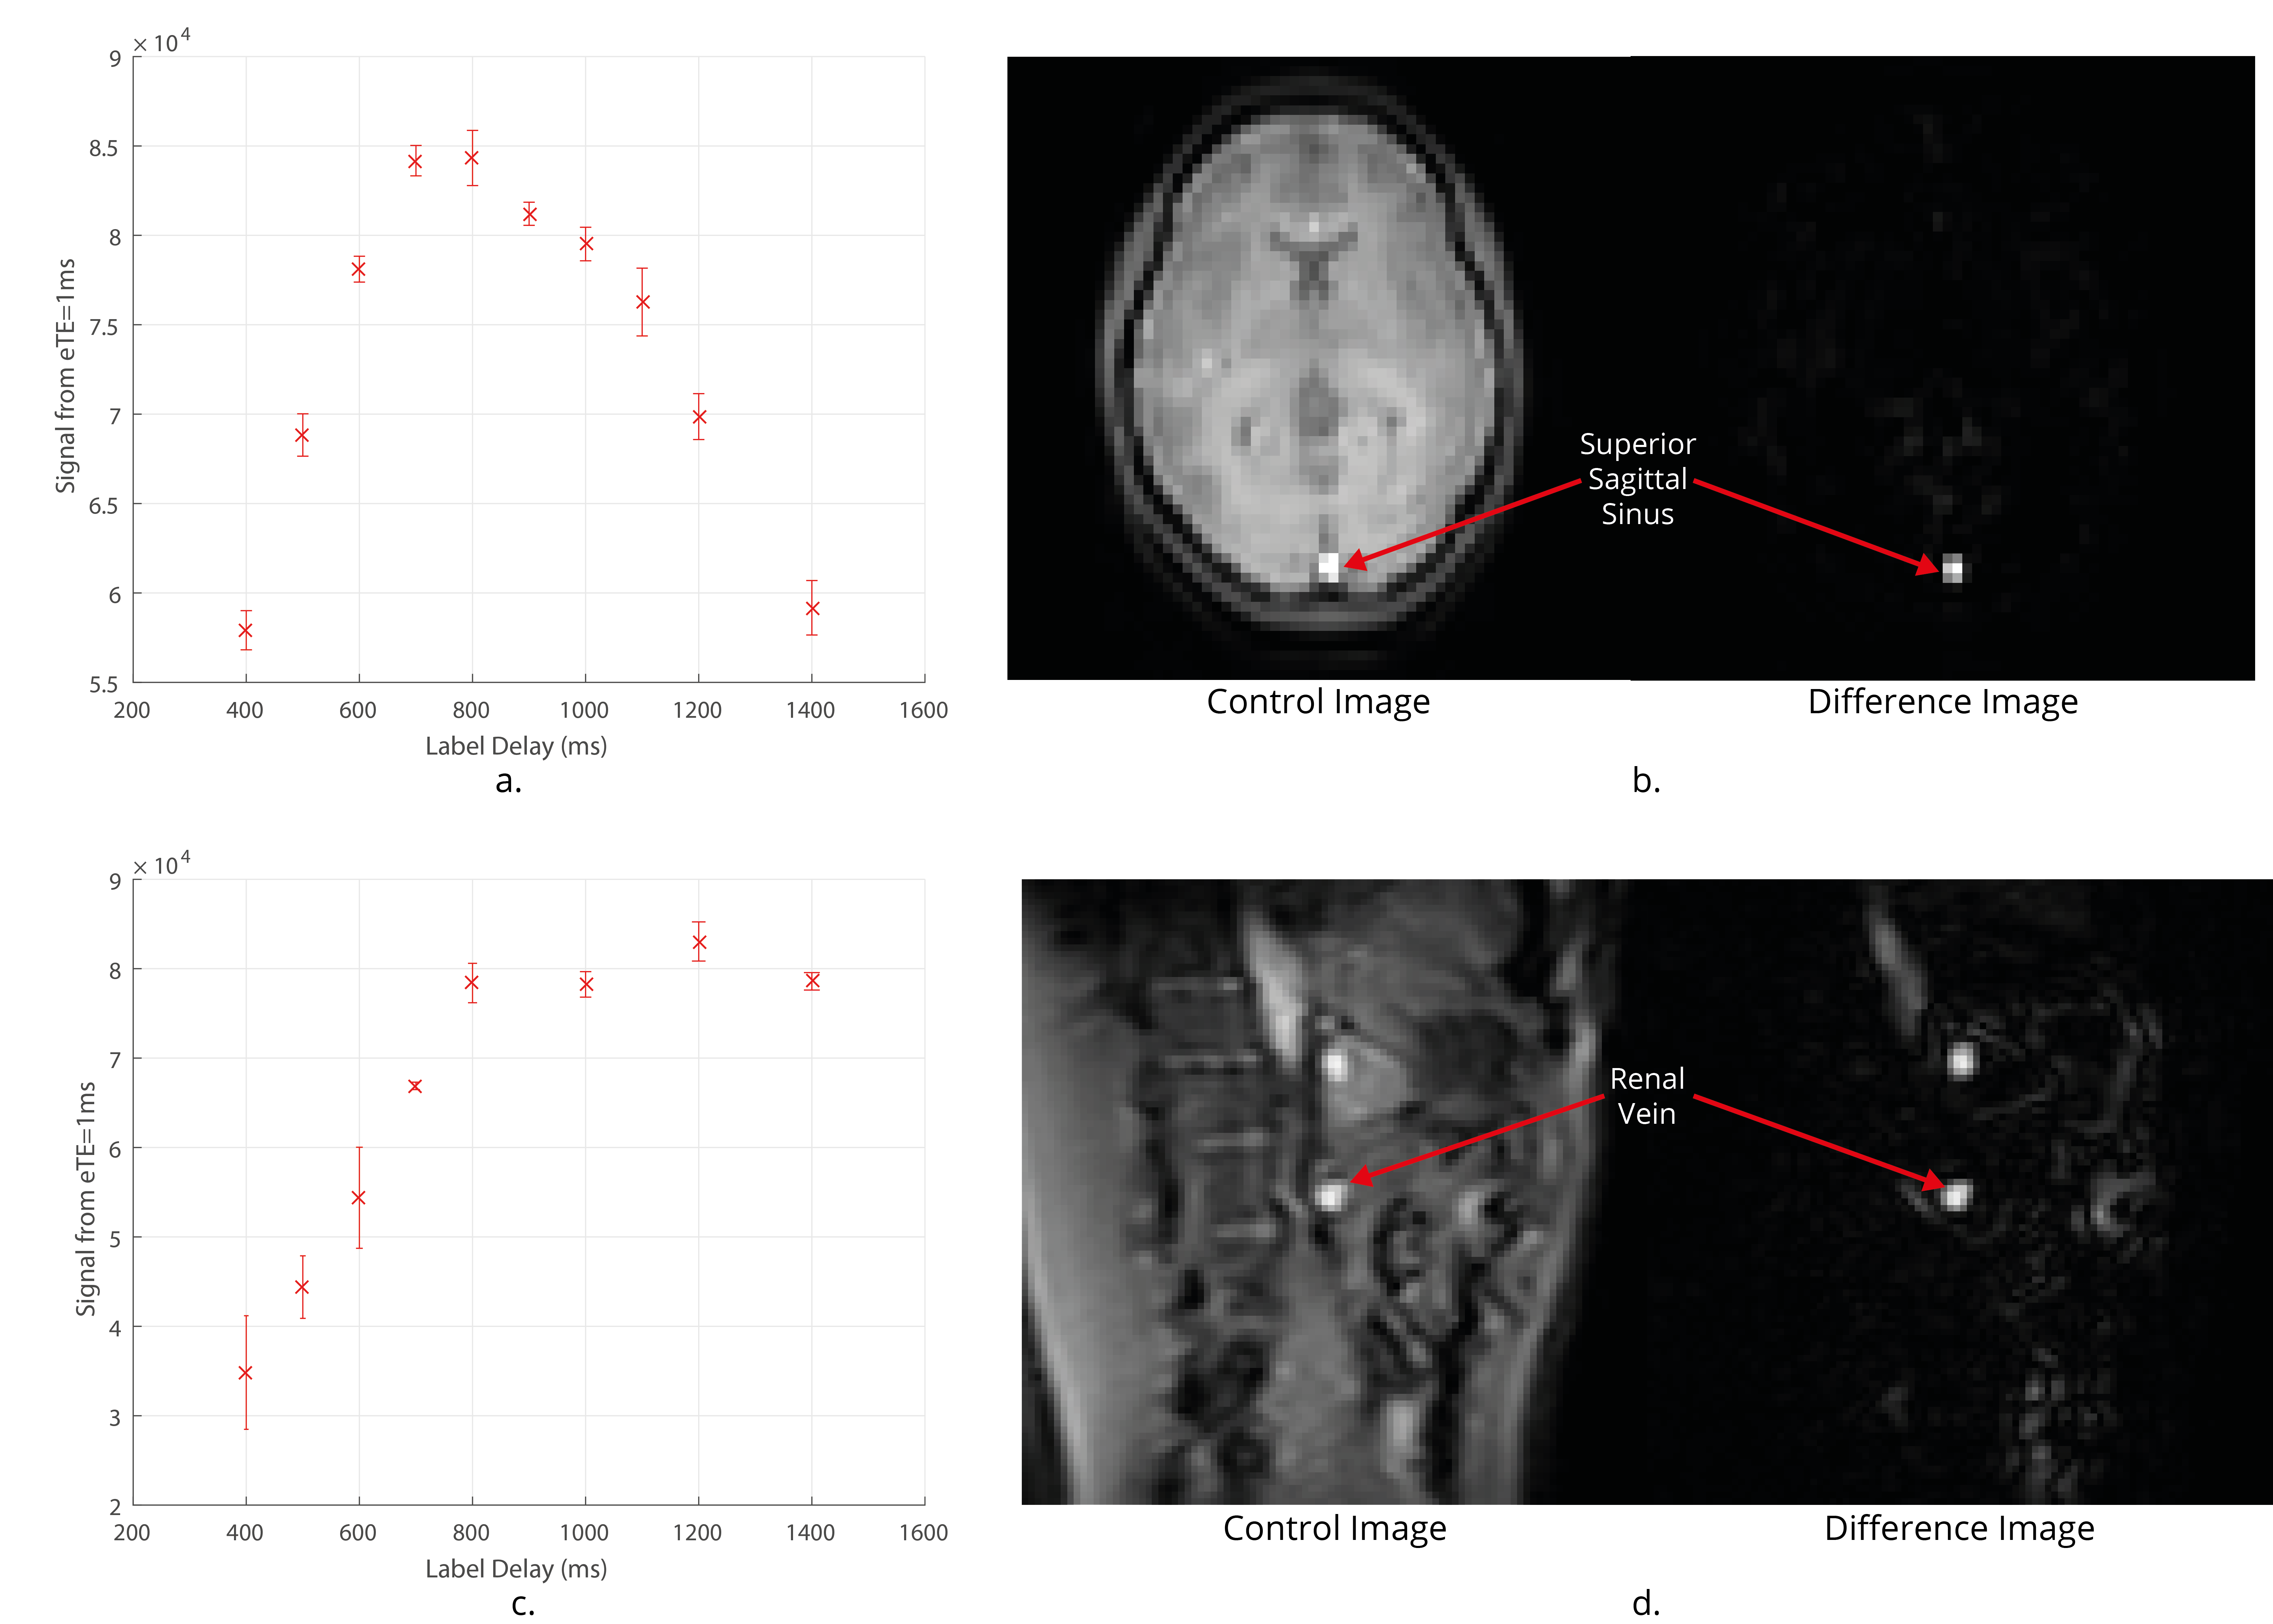
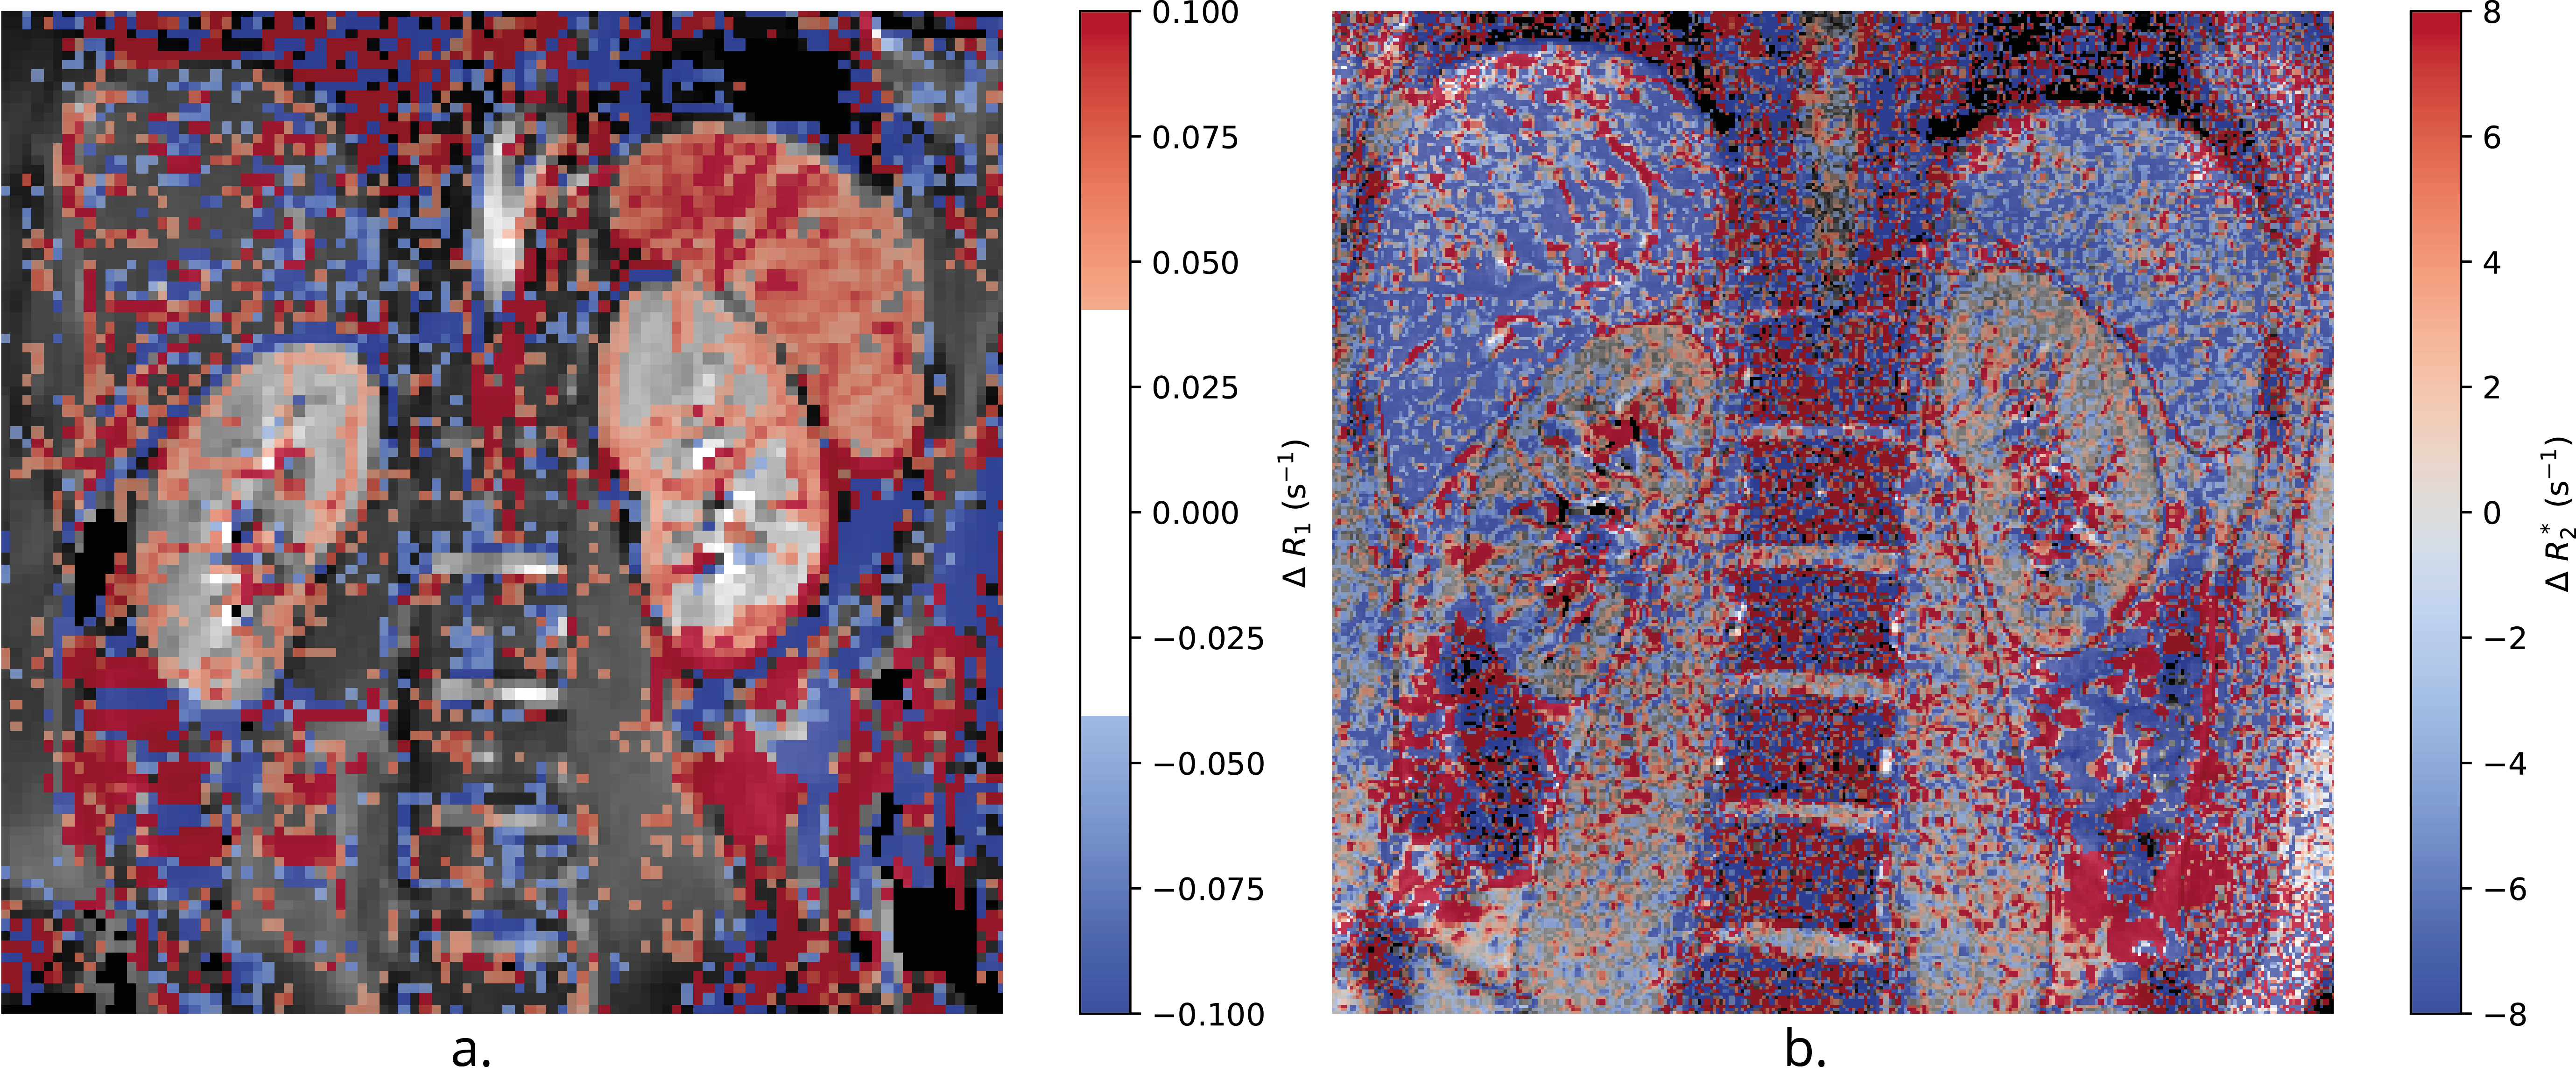
Figure 2 shows the validation of the FAIR-TRUST scheme in the brain on the SSS compared to the TILT-TRUST scheme, the T2 curves are in excellent agreement. Figure 3 shows both the SSS and RV signal intensity of the eTE = 1ms at a range of post label delays (PLD). The maximum signal was generated with a PLD of 800 ms in the SSS and 1000 ms in the RV. This PLD was used for further experiments. Repeatability of the RV measurement, Figure 4A, yielded a T2 of blood in the RV of 135 ± 5 ms corresponding to an oxygen saturation of 89 ± 2 %. Using TRUST, the T2 of blood in the RV was found to increase by 9 ± 7 ms corresponding to an increase in oxygen saturation of 6 ± 3 % after pure oxygen was inspired by the subject. The change in R2* in response to pure oxygen (Fig.5B) showed no clear trend within the kidneys (cortex 1 ± 3 s-1; medulla 0 ± 20 s-1), a significant change in R1 was detected (Fig.5A).Conclusion
We have shown that FAIR-TRUST can be implemented in the body. Using this scheme, it was possible to measure parameters related to blood oxygen saturation in the RV and to assess changes in response to an oxygen challenge, which were not detectable using standard BOLD T2* maps. Quantitatively and accurately measuring the oxygen saturation of blood entering and leaving the kidneys in combination with renal blood flow enables a measure of the rate at which renal tissue is metabolising oxygen. This measure could be used as part of an existing multi-parametric renal MRI protocol to be used in conjunction with the BOLD T2* maps to give greater insight into the oxygenation of the kidneys in the context of chronic kidney disease9.Acknowledgements
We thank Hanzhang Lu for sharing TRUST methodology.References
[1] Prasad, P. V. & Epstein, F. H. Changes in renal medullary pO2 during water diuresis as evaluated by blood oxygenation level–dependent magnetic resonance imaging: Effects of aging and cyclooxygenase inhibition. Kidney Int. 55, 294–298 (1999).
[2] Pruijm, M., Milani, B. & Burnier, M. Blood Oxygenation Level-Dependent MRI to Assess Renal Oxygenation in Renal Diseases: Progresses and Challenges. Front. Physiol. 7, (2017).
[3] Jones, R. A., Ries, M., Moonen, C. T. W. & Grenier, N. Imaging the changes in renal T1 induced by the inhalation of pure oxygen: A feasibility study. Magn. Reson. Med. 47, 728–735 (2002).
[4] Haacke, E. M. et al. In vivo measurement of blood oxygen saturation using magnetic resonance imaging: A direct validation of the blood oxygen level-dependent concept in functional brain imaging. Hum. Brain Mapp. 5, 341–346 (1997).
[5] Mao D., Krishnamurthy L., Lu H., Non-invasive quantification of hepatic metabolic rate of oxygen (HMRO2) by MRI, Proc. ISMRM, 2013, p675.5.
[6] Lu, H. & Ge, Y. Quantitative evaluation of oxygenation in venous vessels using T2-Relaxation-Under-Spin-Tagging MRI. Magn. Reson. Med. 60, 357–363 (2008).
[7] Martirosian, P., Klose, U., Mader, I. & Schick, F. FAIR true-FISP perfusion imaging of the kidneys. Magn. Reson. Med. 51, 353–361 (2004).
[8] Liu, P. et al. Multi-site evaluations of a T2-Relaxation-Under-Spin-Tagging (TRUST) MRI technique to measure brain oxygenation. Magn. Reson. Med. 75, 680–687 (2016).
[9] Cox, E. F. et al. Multiparametric Renal Magnetic Resonance Imaging: Validation, Interventions, and Alterations in Chronic Kidney Disease. Front. Physiol. 8, (2017).
Figures