1261
Assessment of Renal Fibrosis in a Rat Model of Unilateral Ureteral Obstruction with Diffusion Kurtosis Imaging: Comparison with α-SMA Expression and 18F-FDG PET1Tongji Hospital, Tongji Medical College, Huazhong University of Science and Technology, Wuhan, China
Synopsis
To evaluate the value of diffusional kurtosis imaging (DKI) in renal fibrosis using a rat model of unilateral ureteral obstruction (UUO). Differences of DKI parameters among the time points and between the sides were compared. The correlation of DKI parameters with positron emission tomography (PET) renal function and expression of the fibrosis maker α-SMA were determined. There were significant differences on mean diffusivity (MD) and fractional anisotropy (FA) among days and between two sides. FA was moderate correlated with SUV and α-SMA. Therefore, quantitative DKI could be considered a useful and noninvasive method to help assess renal fibrosis.
Introduction/Purpose
Renal fibrosis is the main pathologic characteristic of many chronic renal diseases. It’s reported that renal fibrosis is a reversible and relievable dynamic procession1. However, currently there is no effective non-invasive method for evaluating renal fibrosis longitudinally in vivo available. Former researches indicate diffusional kurtosis imaging (DKI) is sensitive to tissue microstructure and may be useful in the diagnosis and monitoring of disease in brain and body organs2. The purpose of this study was to determine whether non-Gaussian diffusion model DKI is helpful for evaluating renal fibrosis using a rat model of unilateral ureteral obstruction (UUO).Materials and Methods
Thirty-six UUO Sprague–Dawley rats were created by complete ligation of the left ureter and eight normal rats without ligation as control. DKI was performed on a 3.0T MRI scanner (Discovery 750, GE Medical System, Milwaukee, WI) without ligation (day 0) and on days 1, 3, 5, and 7 after ligation. Two images of b 0 were acquired, and b values of 1,250 and 2,500 s/mm2 were applied in 25 uniformly distributed directions. All rats underwent 18F-fluorodeoxyglucose (FDG) dynamic positron emission tomography (PET) to evaluate metabolic activity in the kidneys using the Trans-PET BioCaliburn 700 system (Raycan Technology Co., Ltd, Suzhou, China). Immunohistochemical staining and western blot analysis of UUO sides histological sample to examine a-smooth muscle actin (α-SMA) expression. We assessed the differences of DKI parameters among the time points and between the sides, and compared them with standardized uptake value (SUV) and expression of the fibrosis maker α-SMA.Results
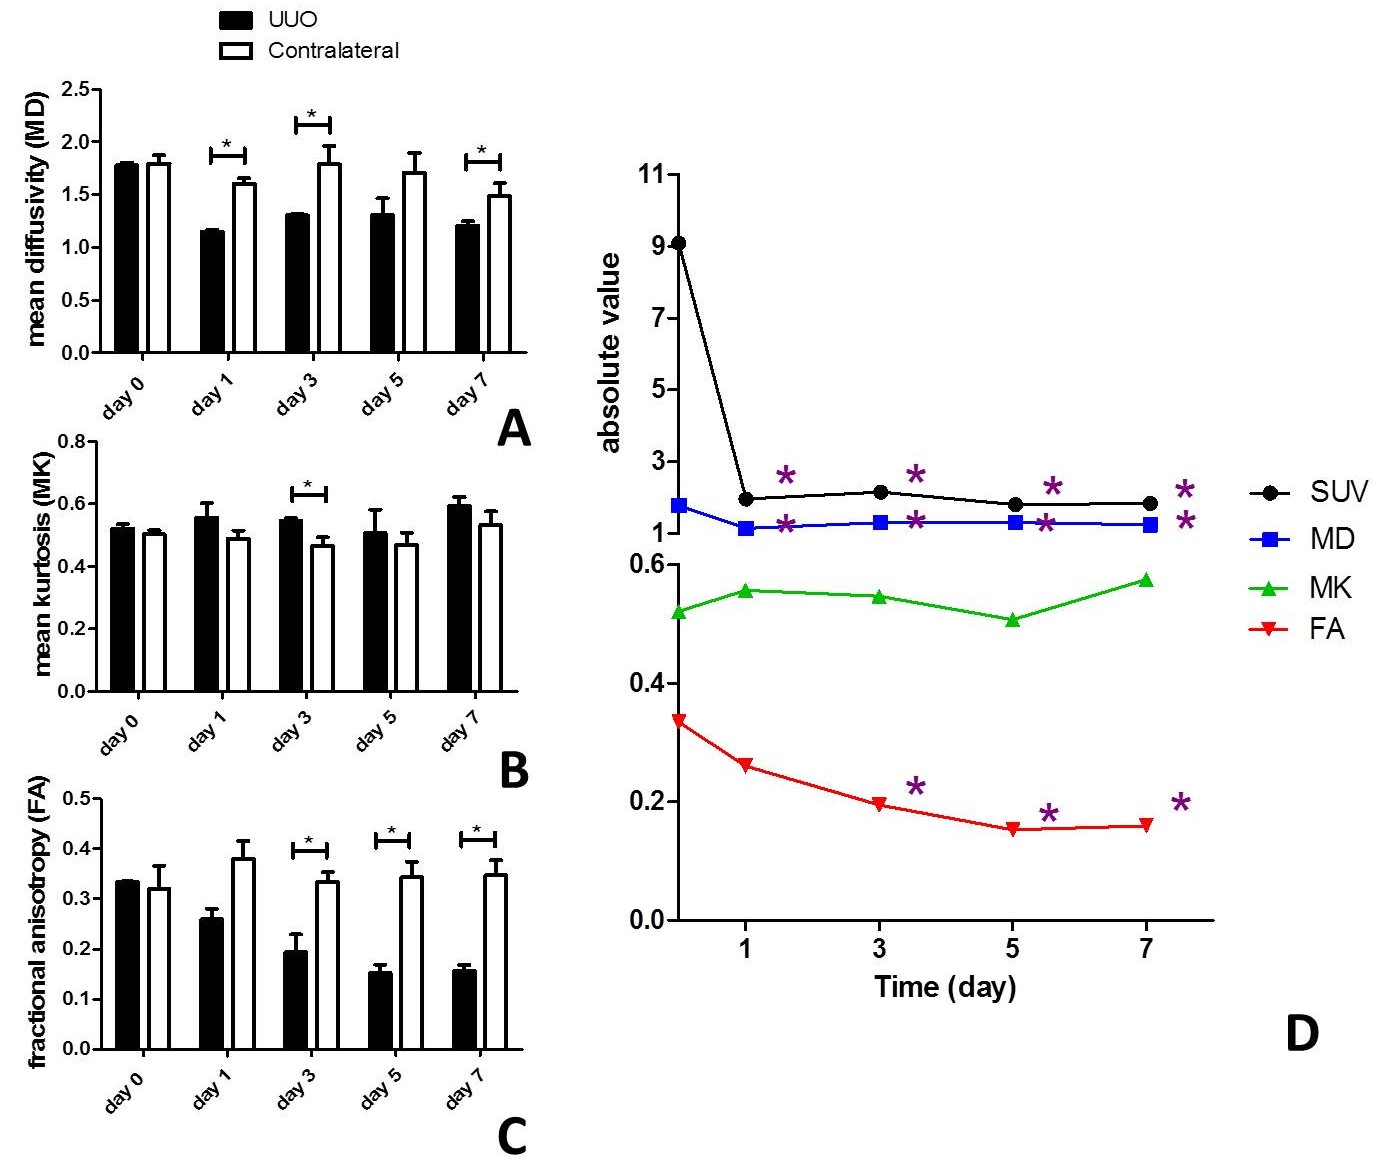
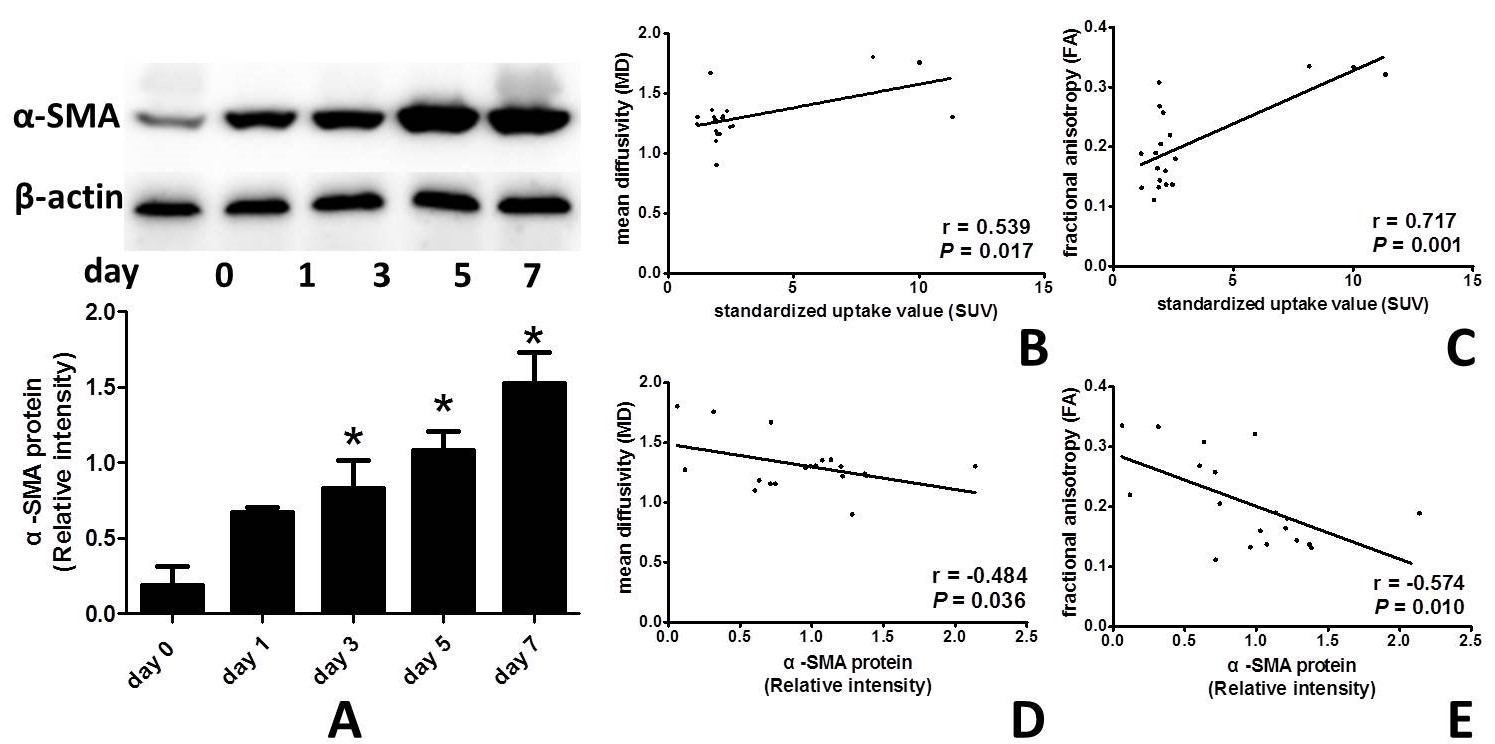
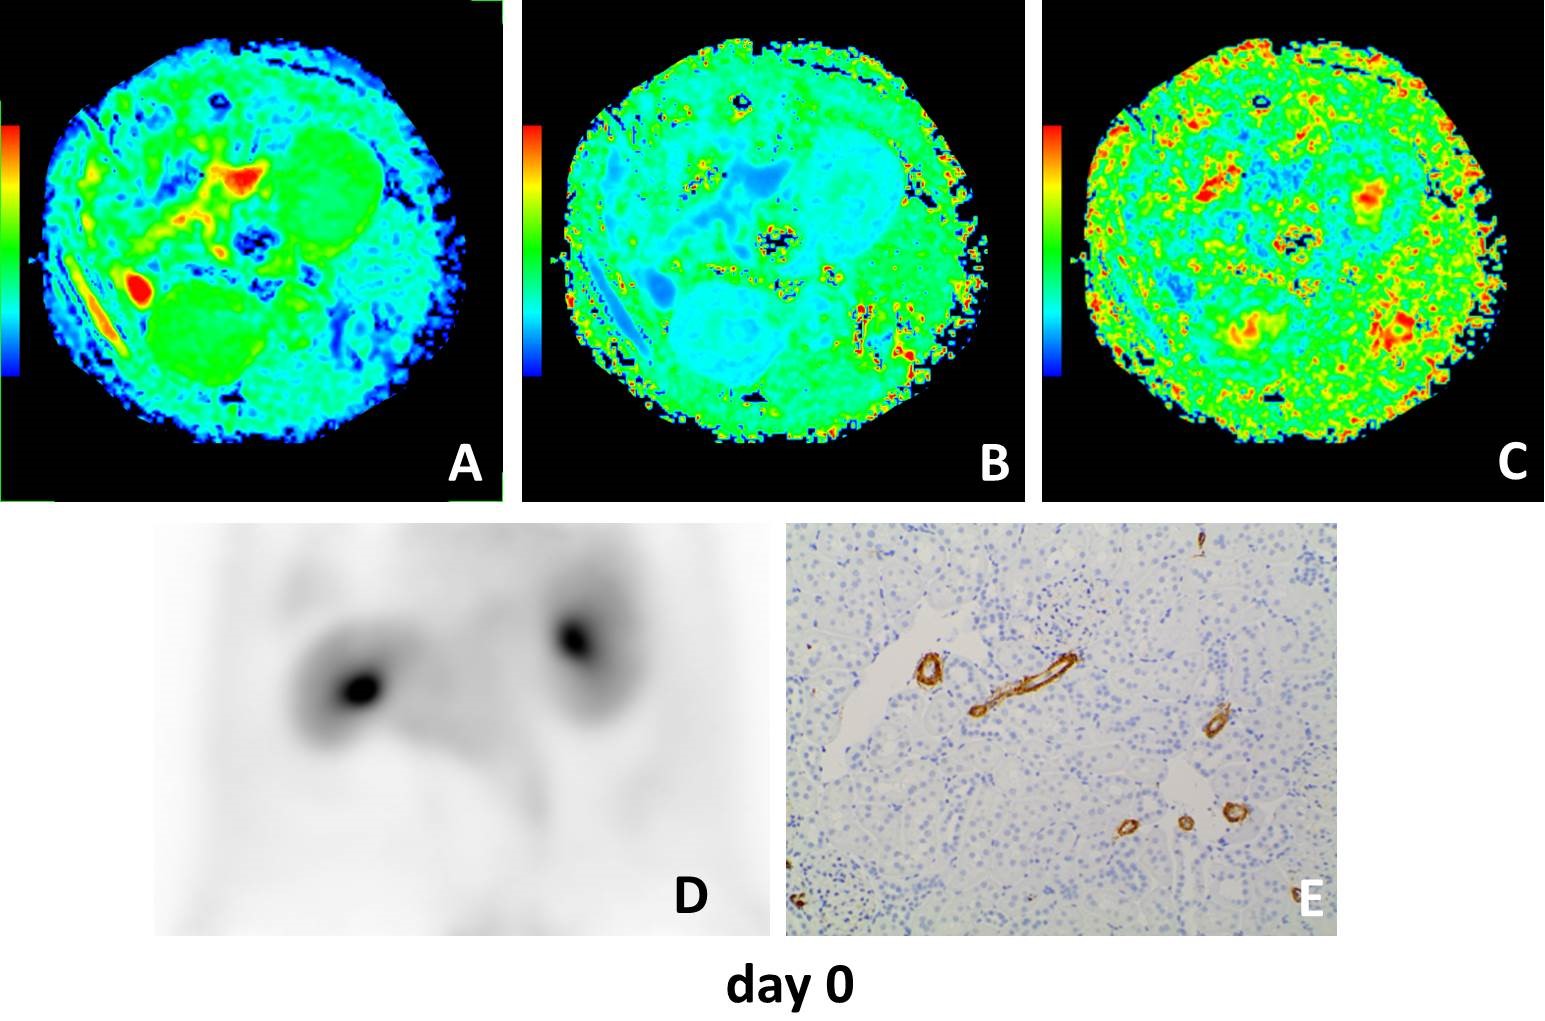
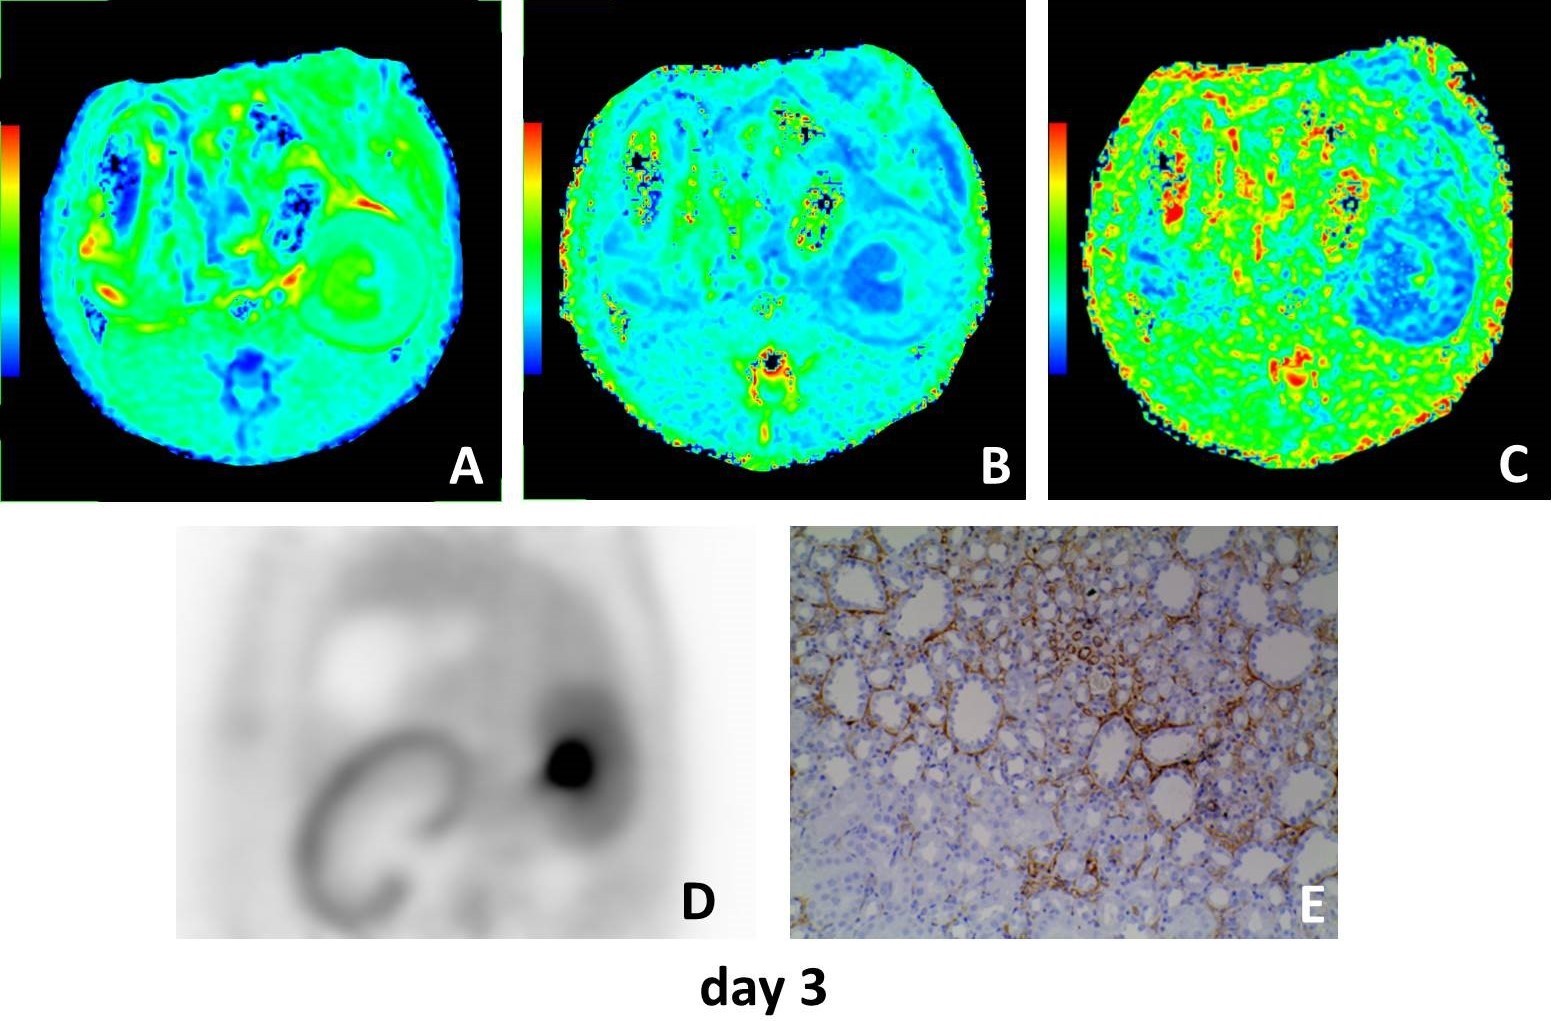
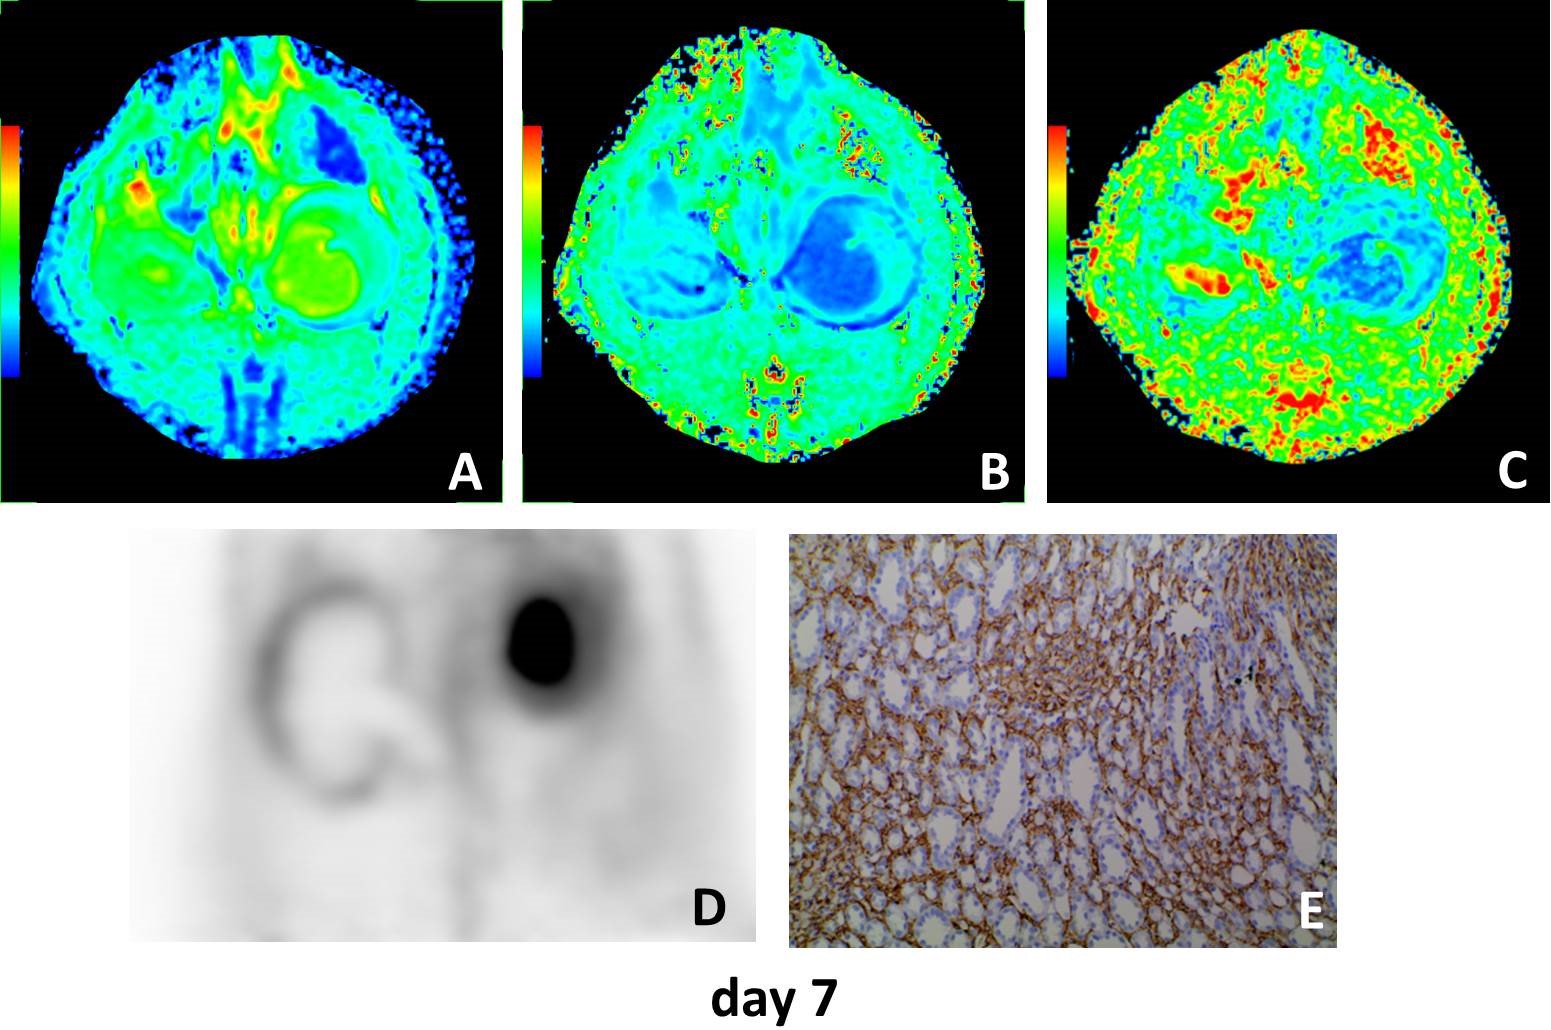
The mean diffusivity (MD) on days 1, 3 and 7 between the UUO side and contralateral side were significantly different. The mean kurtosis (MK) on days 3 between the UUO side and contralateral side were significantly different. The fractional anisotropy (FA) on days 3, 5 and 7 between the UUO side and contralateral side were significantly different (all P < 0.05). MD of the UUO side on day 0 was significantly higher than those of on day 1, 3, 5 and 7. FA of the UUO side on day 0 was significantly higher than those of on day 3, 5 and 7, and FA of the UUO side on day 1 was significantly higher than those of on day 5 and 7 (all P < 0.05) (Fig. 1). MD and FA were positively correlated with SUV (MD: r = 0.539, P = 0.017; FA: r = 0.717, P = 0.001), and negatively correlated with α-SMA expression (MD: r = −0.484, P = 0.036; FA: r = −0.574, P = 0.010) on the UUO side (Fig. 2). Representative MD, MK, FA, PET and Immunohistochemical staining of fibrosis maker α-SMA of each day are shown in Figure 3–5.Discussion
Most of the previous literatures have studied the conventional diffusion-weighted imaging (DWI), which could not reflect the true diffusion characteristic of tissue3. In the current study, we use diffusional kurtosis imaging (DKI) based on a non-Gaussian diffusion model that may better assesse for restricted water diffusion within renal fibrosis microstructure. In additions, DKI is a non-invasive method, which could dynamic evaluate renal fibrosis without ionizing radiation compared with positron emission tomography (PET) nephrogram4. The results of this study showed that MD and FA of the UUO side on day 0 were significantly higher than those of on day 1, 3, 5 and 7. MD and FA were positively correlated with SUV of PET renal function, and negatively correlated with expression of the fibrosis maker α-SMA. It suggested that DKI could be used as a quantitative tool to evaluate renal fibrosis.Conclusions
DKI shows great potential in noninvasive assessment of renal fibrosis induced by UUO, which may be helpful to monitor renal function instead of PET nephrogram.Acknowledgements
No acknowledgement found.References
1. Sugimoto H, LeBleu VS, Bosukonda D, et al. Activin-like kinase 3 is important for kidney regeneration and reversal of fibrosis. Nat Med 2012;18:396-404.
2. Kjolby BF, Khan AR, Chuhutin A, et al. Fast diffusion kurtosis imaging of fibrotic mouse kidneys. NMR Biomed 2016;29:1709-19.
3. Minosse S, Marzi S, Piludu F, Vidiri A. Correlation study between DKI and conventional DWI in brain and head and neck tumors. Magn Reson Imaging 2017;42:114-22.
4. Togao O, Doi S, Kuro-o M, Masaki T, Yorioka N, Takahashi M. Assessment of renal fibrosis with diffusion-weighted MR imaging: study with murine model of unilateral ureteral obstruction. Radiology 2010;255:772-80.
Figures