1260
Using Simultaneous PET/MRI and Cell Tracking to Evaluate Immunotherapies in Breast and Ovarian Cancer Models1Biomedical Translational Imaging Centre (BIOTIC), Halifax, NS, Canada, 2Dalhousie University, Halifax, NS, Canada, 3Immunovaccine Inc., Halifax, NS, Canada, 4Ottawa Hospital Research Institute, Ottawa, ON, Canada
Synopsis
Epithelial ovarian cancer and triple negative breast cancer (TNBC) are aggressive cancers with poor survival outcomes. Simultaneous FDG-PET/MRI and quantitative cell tracking were used to monitor orthotopic ovarian cancer and TNBC models for longitudinal tumor growth and metabolism in response to therapy while tracking immune cell subsets labeled with superparamagnetic iron oxide (SPIO). PET/MRI enabled monitoring of tumor growth and internal physiological changes and allowed quantitative assessment of tumor volumes over time. MRI cell tracking results indicated changes in the recruitment rates of three unique immune cell types over time in the group level with significant individual-level variability.
Introduction
Epithelial ovarian cancer and triple negative breast cancer (TNBC) are highly aggressive cancers with poor survival outcomes following traditional therapies. These cancers are therefore highly amenable candidates for immunotherapies, which are aimed at stimulating the immune system1-4. Many immunotherapies, including checkpoint inhibitors, are being tested on these cancers in clinical trials, but high individual variability impedes translation of these promising drugs from bench to bedside. Molecular imaging is an attractive option for monitoring immunotherapy treatments since individual immune environments can be characterized longitudinally in response to cancer and therapy. Given the highly variable and individualized nature of immunotherapy, imaging offers valuable opportunities to longitudinally assess individual level responses. Quantitative MRI cell tracking5-7 can accurately and longitudinally monitor migration of a wide range of immune cell types in a variety of cancer and immunotherapy models. Using simultaneous PET/MRI, we monitored an orthotopic ovarian cancer model and a TNBC model to evaluate longitudinal tumor growth and metabolism in response to therapy while tracking immune cell subsets labeled with superparamagnetic iron oxide (SPIO).Methods
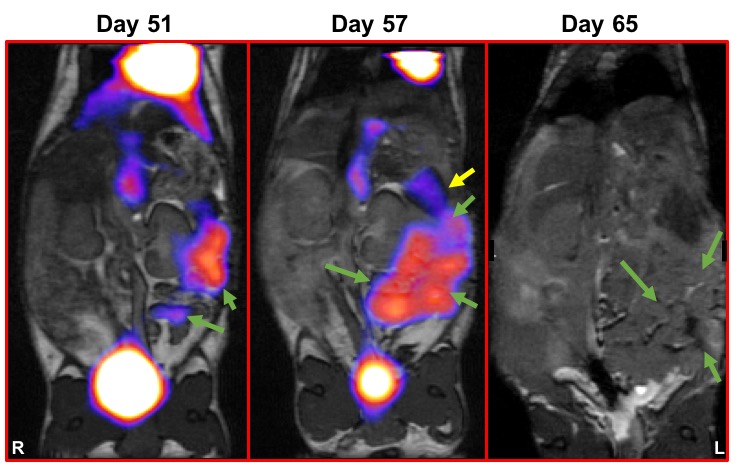
Ovarian – Humanized transgenic mice (HLA-A2.1-/HLA-DR1-transgenic (HHD) H-2 class I-/class-II knockout) are engineered to express the human leukocyte antigen. HHD mice were surgically implanted with 104 syngenic mouse ovarian cancer surface epithelial cells (MOSE) directly into the left ovarian bursa (recipient = 20). HHD mice were untreated or treated with a combination of metronomic cyclophosphamide (starting on day 14) and a peptide-based vaccine (DPX-Survivac) given every 3 weeks starting at day 21, and were imaged on days 51, 57 and 65.
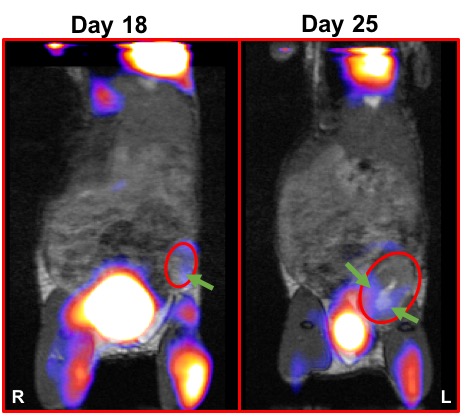
TNBC - BALB/c mice were given the 4T1 mouse TNBC cell line. Transgenic CByJ.B6-Tg(UBC-GFP)30Scha/J are used as donor mice for cell isolation. Mice received 5x10³ cells into the 4th inguinal mammary fat pad (recipient = 20). Mice were untreated or treated with anti-TIM3 at 5 time points starting at day 3 (200μg/day), and were imaged on days 18 and 25.
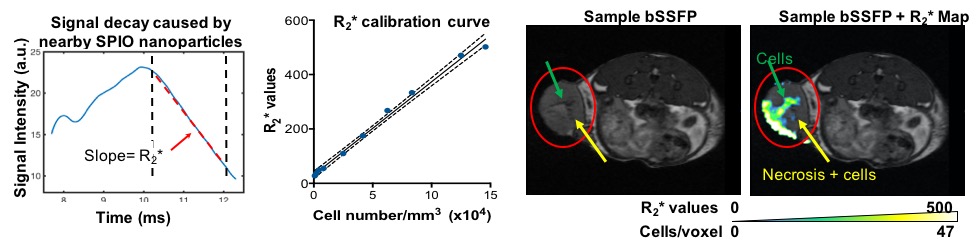
CD8+ cytotoxic T cells (CTLs), myeloid derived suppressor cells (MDSCs) and dendritic cells (DCs) were isolated from disease- and treatment-matched mice, cultured in vitro, and passively loaded with Molday Rhodamine B SPIO (~30nm - Biopal, Worcester MA) for 24h. Mice received an i.v. tail injection of 5x10⁶ CTLs, 1x10⁶ DCs or 4x10⁶ MDSCs and were imaged ~24 (CTLs and DCs) or 48 (MDSCs) hours post-injection (Figure 1).
MRI data were acquired on a 3T pre-clinical scanner (Agilent, Santa Clara, CA). BSSFP images are acquired with TR/TE = 8/4 ms, α= 30˚, 200μm isotropic voxels. TurboSPI for R2* mapping (TR/TE = 250/10ms, ETL=8, 400μm in-plane resolution) is preceded by an FSE prescan with matched parameters to prescribe undersampling (R=8) and constrain the iterative CS reconstruction.7 R2* values are converted into quantitative estimates of cell concentration based on a calibration curve (Figure 1)7.
Using a fully integrated PET/MRI system (NuPET, Cubresa, Winnipeg MB), PET data (~500mCi 18F-FDG injected, 50min uptake, 30min acquisition, 625μm isotropic voxels) were acquired simultaneously with MRI to assess tissue metabolism. PET data was aligned with MR images using VivoQuant (Invicro, Boston MA).
Results and Discussion
Simultaneous PET/MRI - In both tumor models, imaging was valuable for monitoring tumor progression and metabolism (Figures 2 and 3). In the MOSE model, abdominal swelling (primarily due to ascites) was not always correlated with increased primary tumor volume. In both models MRI was useful for monitoring uterine inflammation. In TNBC, PET/MRI indicated tumors had extremely heterogeneous FDG uptake.
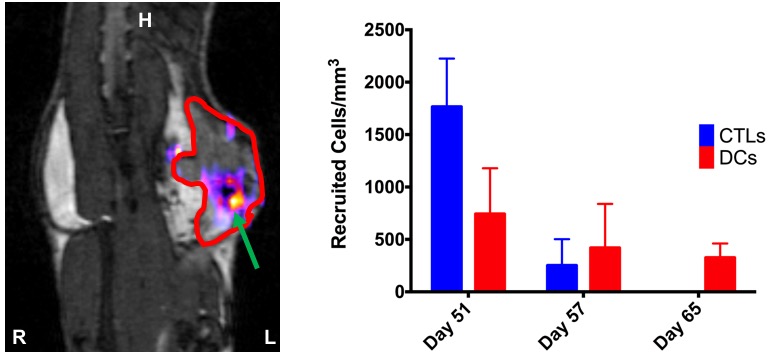
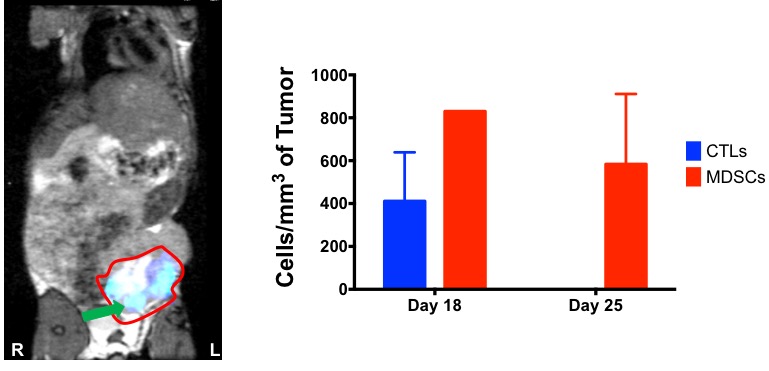
Immune Cell Tracking – In the MOSE model, we visualized CTLs and DCs recruited to the primary tumors (Figure 4). For both CTLs and DCs, the density of cells recruited to tumors decreased with increasing tumor volumes (i.e. at later time points), with a much larger decrease for CTLs than DCs. The percentage of injected CTLs and DCs recruited to tumors varies between 0.5-12% for CTLs and 0.5-36% for DCs. In the 4T1 model we visualized MDSCs and CTL recruitment to the tumor (Figure 5). Overall, MDSCs were recruited in greater numbers (at least ~10%) than CTLs (only ~1% in 4T1 model). In control mice, MDSC recruitment may be correlated with final tumor volume.
Conclusions
We demonstrated that simultaneous PET/MRI is an excellent tool for monitoring tumor growth and internal physiological changes and demonstrated that we can quantitatively assess tumor volumes over time. MRI cell tracking results indicate changes in the recruitment rates of three unique immune cell types over time in the group level with large amounts of variability at the individual level as expected. These individual variations in immune recruitment may offer indications of underlying therapeutic response or resistance.Acknowledgements
Both BK and VG contributed equally to this work. KB would like to acknowledge funding from the Beatrice Hunter Cancer Research Institute (BHCRI) and the Nova Scotia Health Research Foundation (NSHRF). MLT would like to acknowledge funding from the BHCRI Cancer Research Training Program (CRTP) and MITACS. AN and VG would like to acknowledge funding from the IWK Health Centre.References
1. Syrios, J., Banerjee, S. & Kaye, S. B. Advanced epithelial ovarian cancer: from standard chemotherapy to promising molecular pathway targets--where are we now? Anticancer Res. 34, 2069–2077 (2014).
2. Ojalvo, L. S., Nichols, P. E., Jelovac, D. & Emens, L. A. Emerging immunotherapies in ovarian cancer. Discov Med 20, 97–109 (2015).
3. Weiss, L., Huemer, F., Mlineritsch, B. & Greil, R. Immune checkpoint blockade in ovarian cancer. Memo 9, 82–84 (2016).
4. Stagg, J. & Allard, B. Immunotherapeutic approaches in triple-negative breast cancer: latest research and clinical prospects. Ther Adv Med Oncol 5, 169–181 (2013).
5. Srinivas, M. et al. Imaging of cellular therapies. Adv. Drug Deliv. Rev. 62, 1080–1093 (2010).
6. Kadayakkara, D. K., Korrer, M. J., Bulte, J. W. M. & Levitsky, H. I. Paradoxical Decrease in the Capture and Lymph Node Delivery of Cancer Vaccine Antigen Induced by a TLR4 Agonist as Visualized by Dual-Mode Imaging. Cancer Res. 75, 51–61 (2015).
7. Rioux, J. A., Beyea, S. D. & Bowen, C. V. 3D single point imaging with compressed sensing provides high temporal resolution R 2* mapping for in vivo preclinical applications. MAGMA (2016). doi:10.1007/s10334-016-0583-y
Figures