1259
Separating BOLD into local and non-local components using a novel simultaneous fMRI-fPET dual analysis1Monash Biomedical Imaging, Monash University, Melbourne, Australia, 2Monash Institute of Cognitive and Clinical Neurosciences, Monash University, Melbourne, Australia, 3Centre of Excellence for Integrative Brain Function, Australian Research Council, Melbourne, Australia, 4Department of Electrical and Computer Systems Engineering, Monash University, Melbourne, Australia
Synopsis
The objective was to separate the MRI BOLD response into local and non-local components using a simultaneously acquired functional FDG-PET (fPET) dataset. We used a visual task, with both high-frequency and low-frequency temporal components, to simultaneously evoke glucose and BOLD responses. Joint analysis of the fMRI and fPET identified two components, including a positively-correlated map of the visual cortex, and a negatively-correlated map of sub-regions of the visual cortex in fMRI and the draining vasculature in fPET. These findings provide preliminary evidence that we can deconstruct the fMRI BOLD signal into local (neuronal) and non-local (haemodynamic) components using simultaneous fMRI-fPET.
Introduction
The in-vivo monitoring of neuronal activity at high spatial and temporal resolution is critical for studies of brain function. The blood-oxygen level dependent (BOLD) response, measured using functional-MRI (fMRI), is an indirect measure of neuronal activity derived from the hemodynamic response of the vasculature1. BOLD-fMRI provides excellent spatial (~1-3mm) and moderate temporal resolution (~1-2seconds); however, it may lack specificity. BOLD response contributes to the signal in the capillary bed, and in the venous system as blood drains. As such, there is potential for non-local contamination in the veins. 18-F Flurodeoxyglucose PET (FDG-PET) provides a direct measure of neuronal glucose metabolism that is coupled to synaptic activity. FDG-PET is typically performed statically, with a single injected-bolus of tracer. As such, it has no effective temporal resolution. In this study, we aim to differentiate the local and non-local BOLD components using a novel, slow infusion functional FDG-PET (fPET) acquired simultaneously with BOLD-fMRI data during a visual stimulus paradigm.Methods
fPET was acquired simultaneously with fMRI during an embedded block design flickering (8Hz) checkerboard visual task (Figure 1). The low-frequency on/off design (10-minute blocks) provided FDG-PET contrast, whilst the high-frequency (32/16-seconds) design provided BOLD-fMRI contrast. Two periods of full checkerboard, and two periods of half-checkerboard were performed with periods of rest in between. Analysis was performed using the first full checkerboard.
All data was acquired on a 3T Biograph mMR (Siemens, Erlangen) with 90-minutes of PET list-mode data collection. A continuous infusion of FDG (100MBqs) was administered at a rate of 36mL/hr. MRI included: dual-UTE, T1-MPRAGE, T2-FLAIR, GRE, ASL, and fMRI (TR=2450ms, TE=30, 64x64x44, res=3x3x3mm3).
fMRI pre-processing included B0-unwarping, motion correction and high-pass filtering (0.01 Hz). The data was de-noised using first level ICA, followed by registration to MNI, and smoothing (5mm FWHM).
List-mode data were retrospectively reconstructed into 90 bins (1-minute each), using the OP-OSEM algorithm with point spread function correction and 5mm Gaussian smoothing. Data was corrected for attenuation (pseudo-CT μ-maps2), motion3, registered to a PET template, and normalised to the mean grey-matter activity.
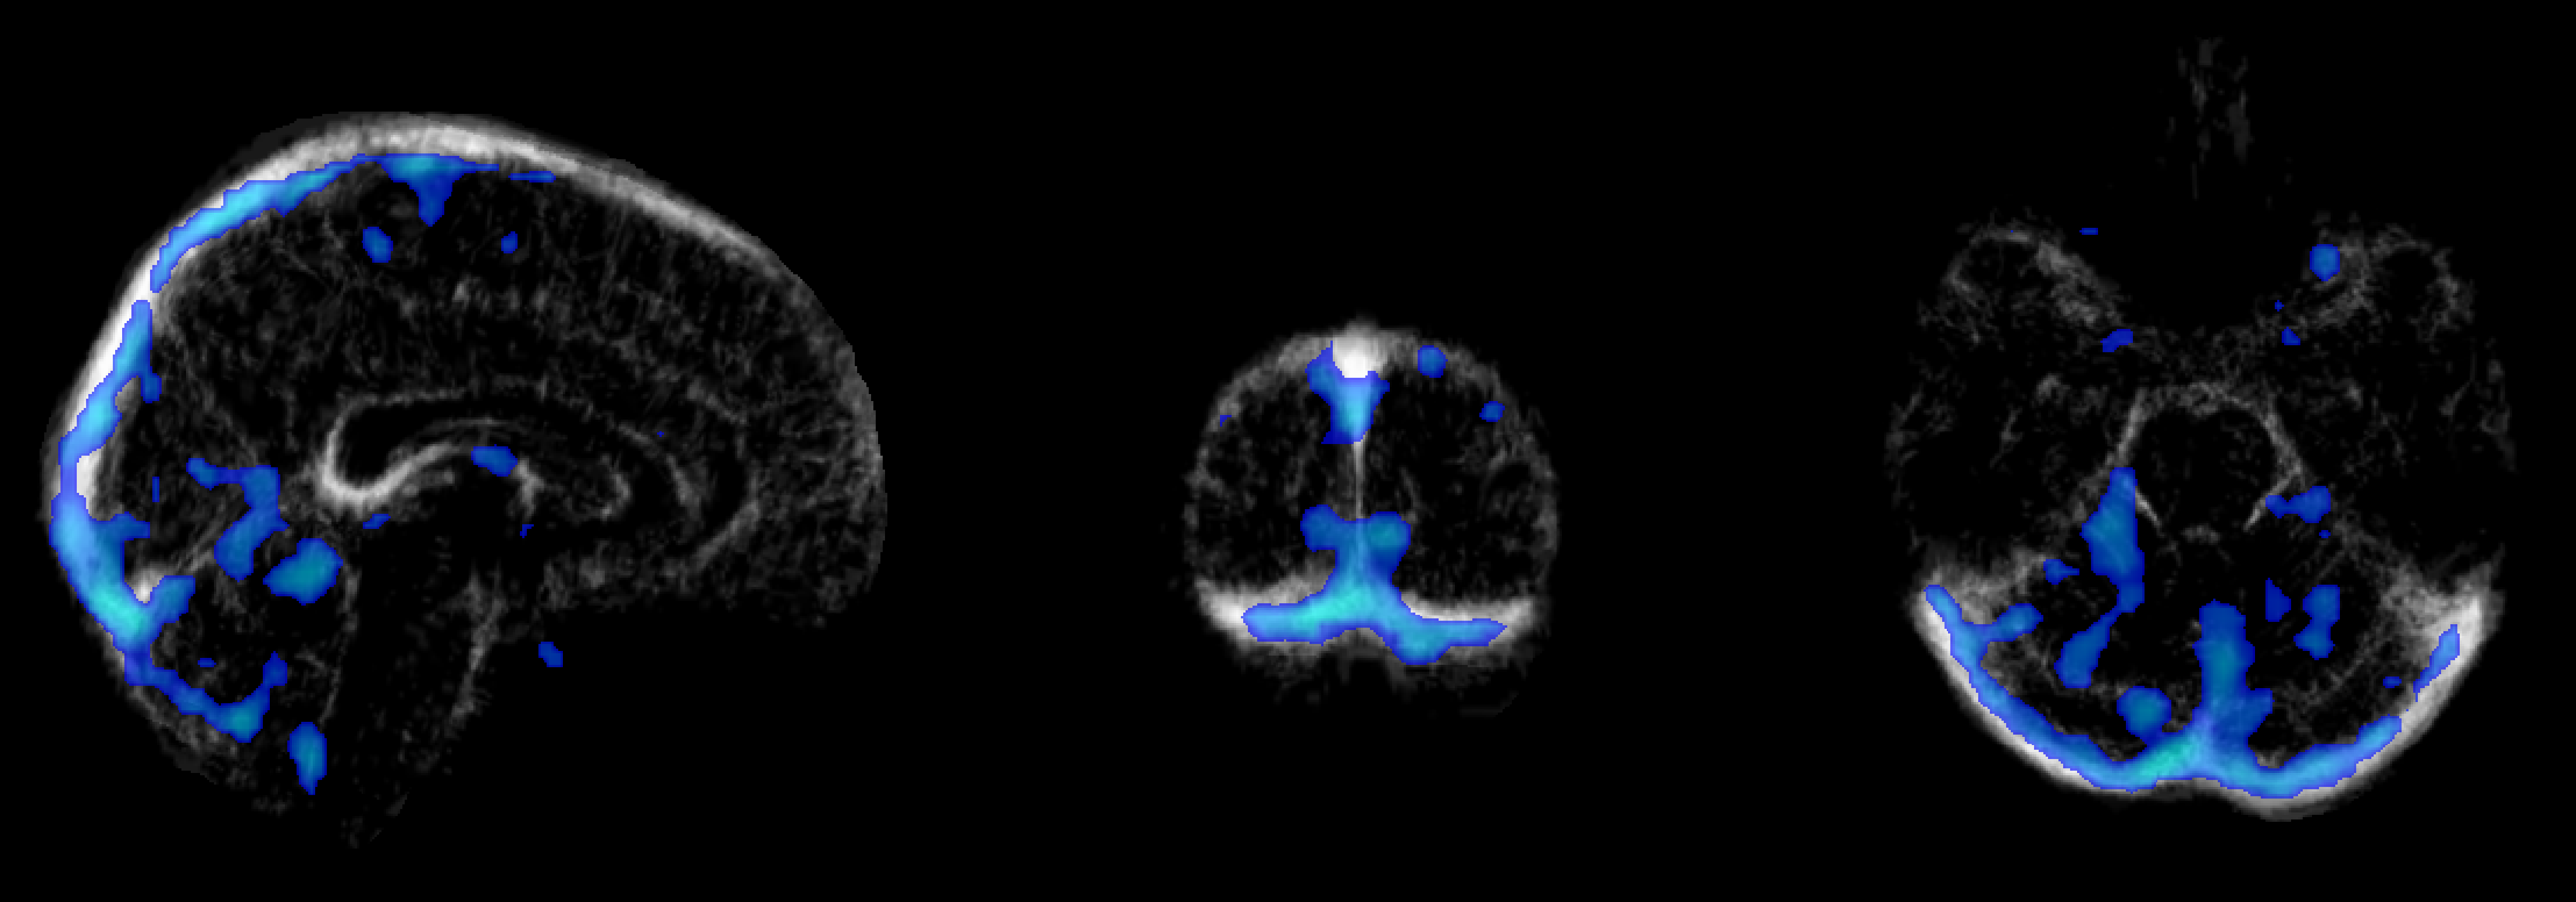
Analysis was performed at two levels. Firstly, two separate fMRI and fPET group ICA4 (with 7 components) were performed and the visual cortex activation map identified. Dual regression was performed (FSL5) to obtain a Z-score map per subject. A joint ICA was then performed (5 components, Fusion ICA Toolbox6), combining the Z-score maps from fMRI and fPET into a 4D matrix per subject. The two main joint components were analysed, with the second component overlaid upon a vein atlas7 for visual inspection.
Results
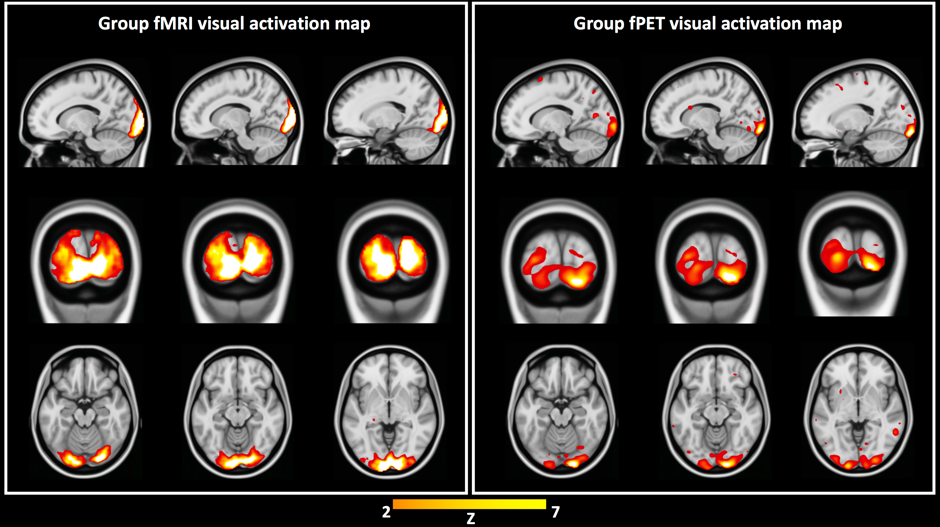
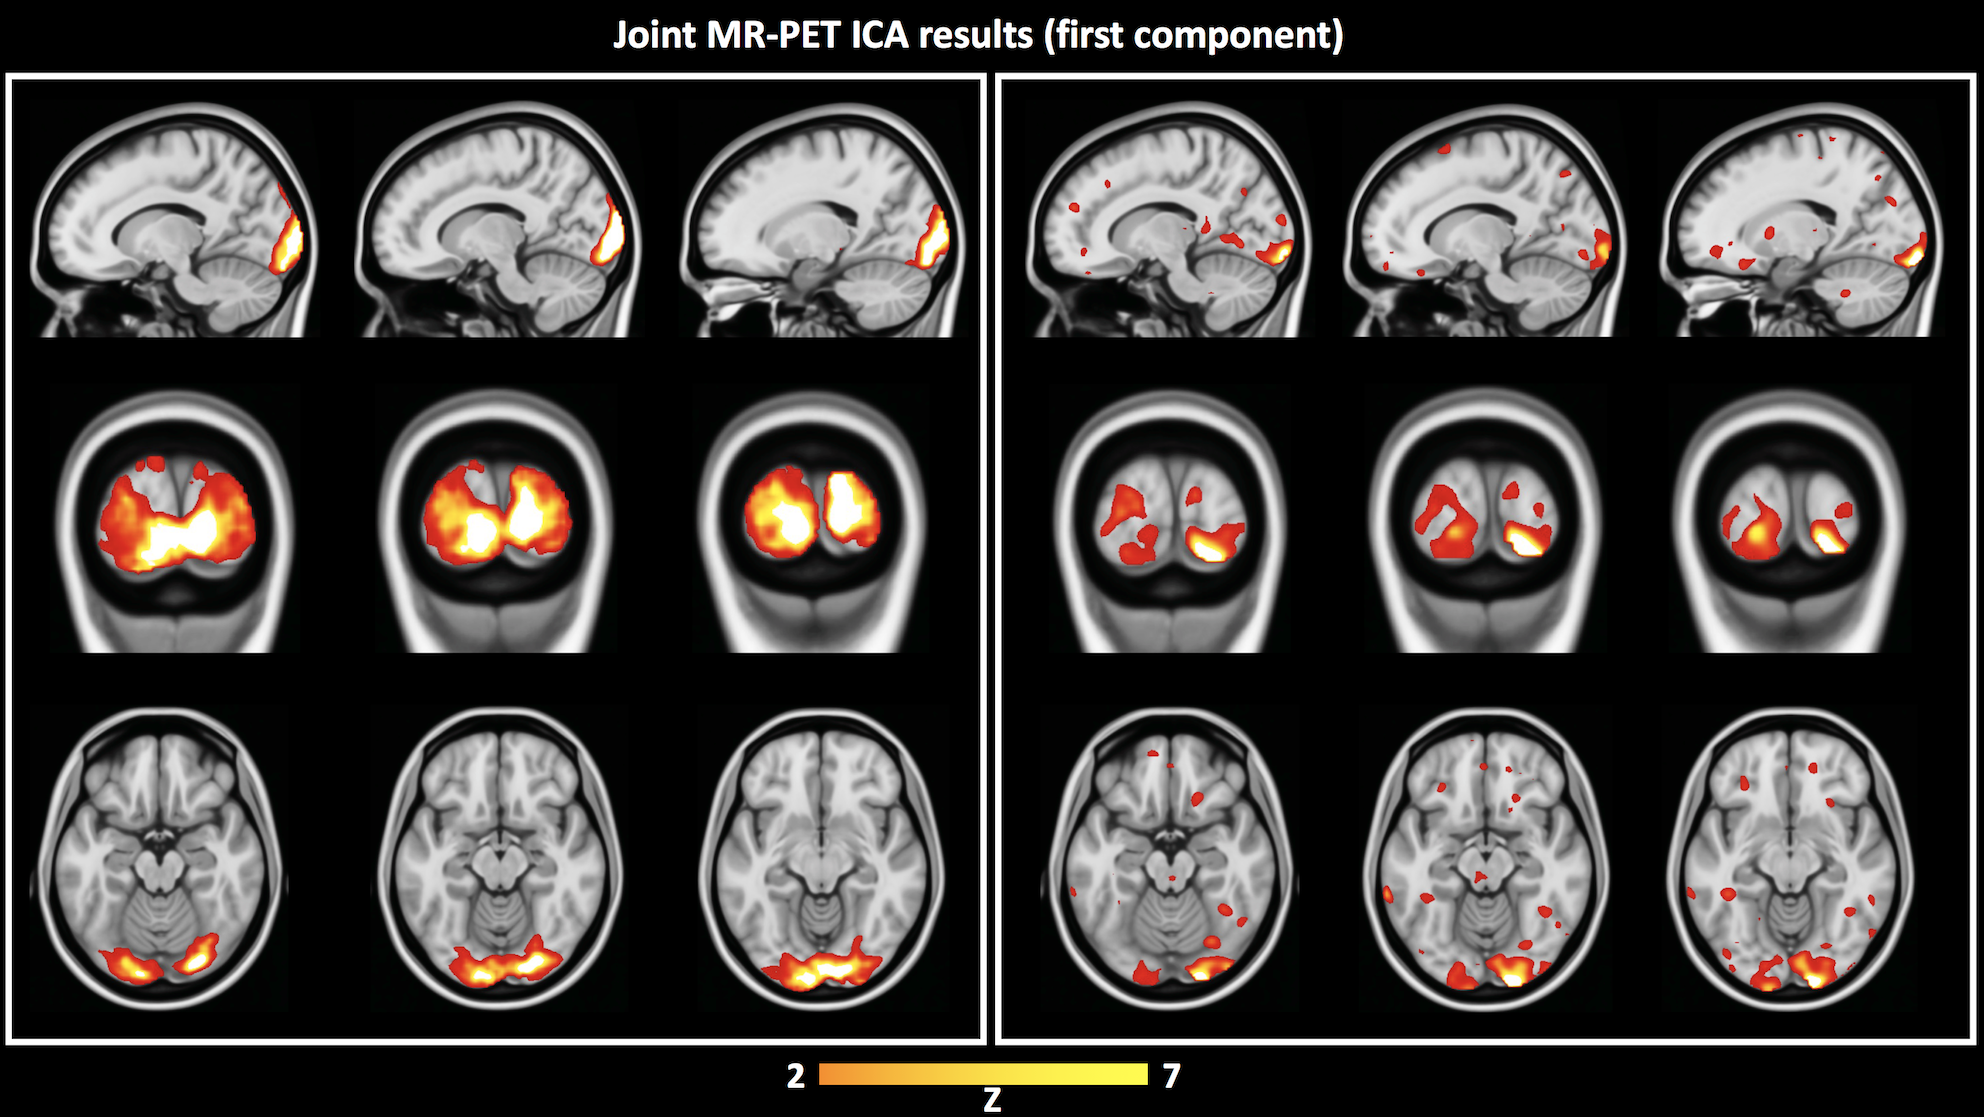
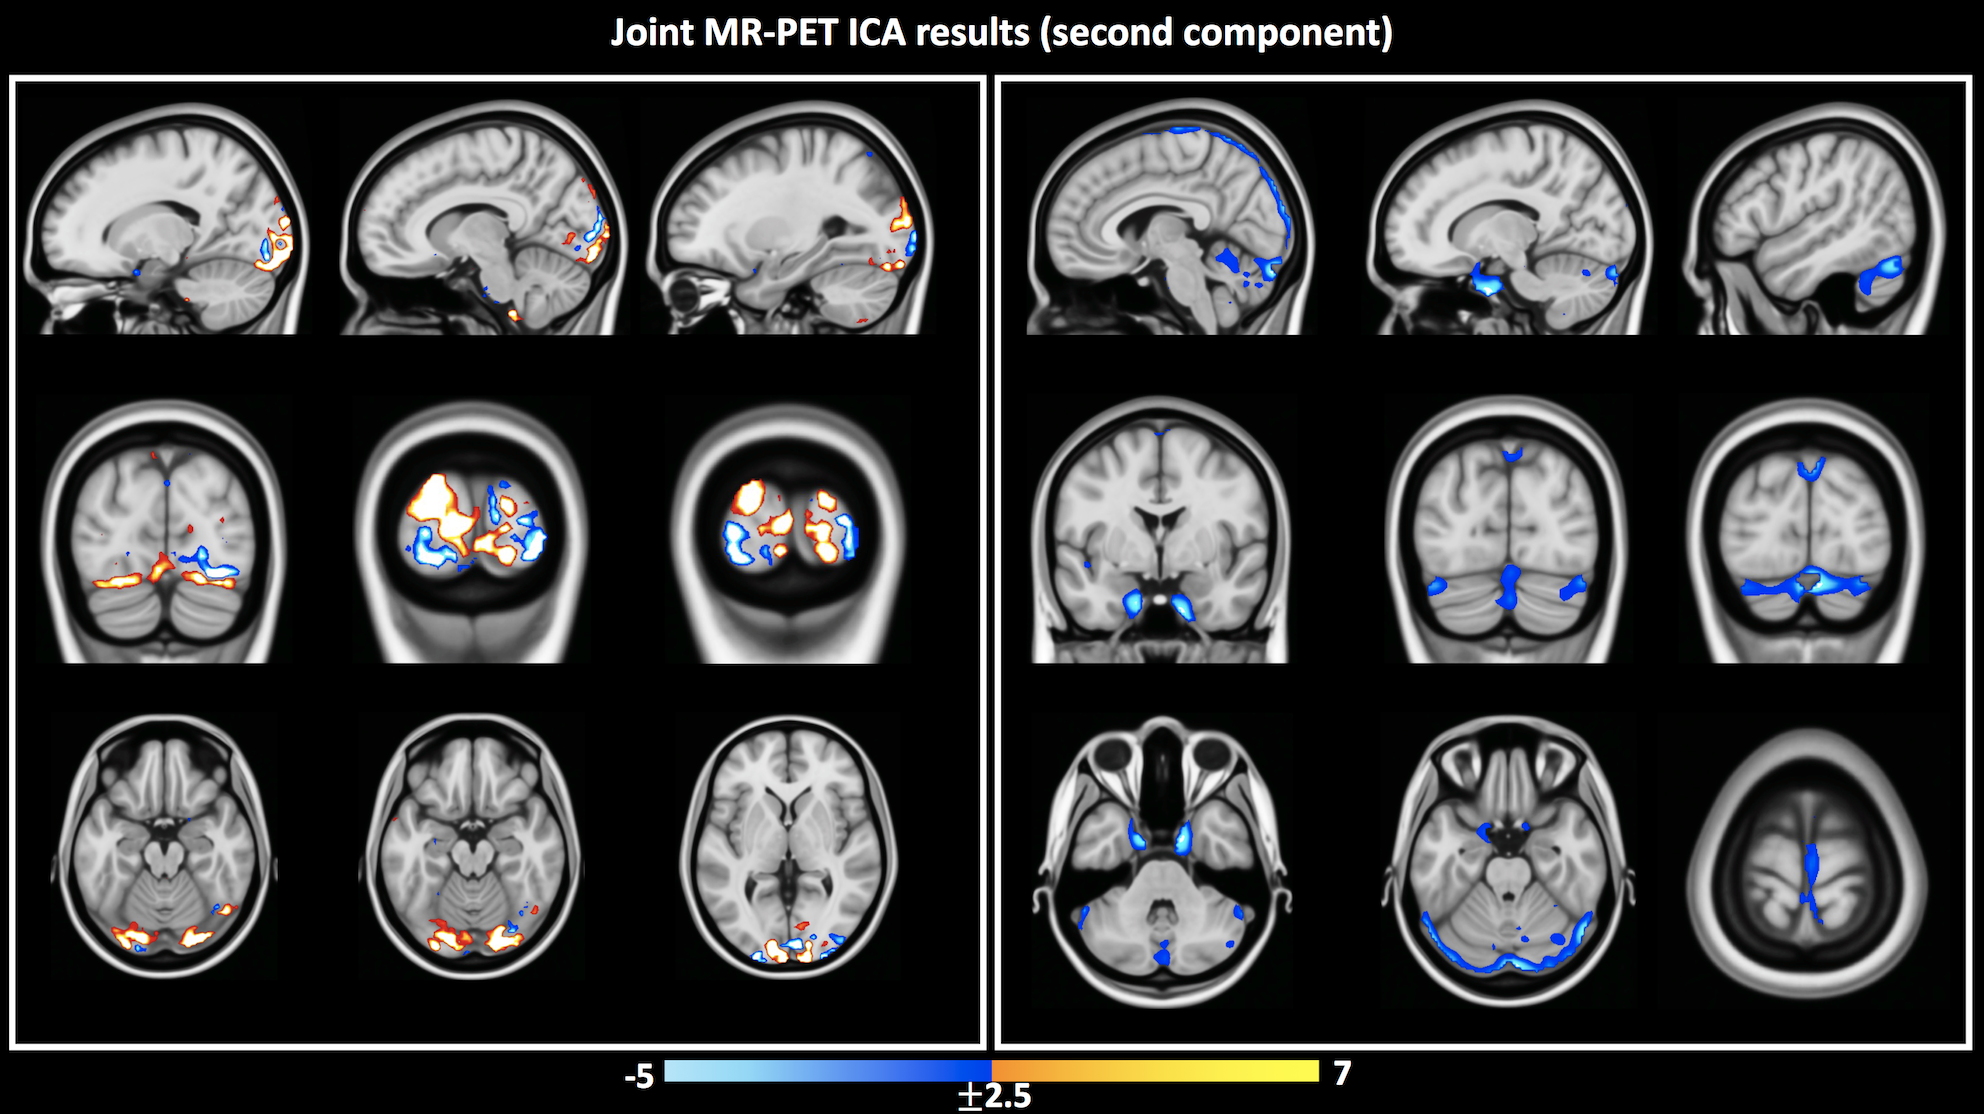
Independent activation maps of the visual cortices were produced for the separate fMRI and fPET analyses (Figure 2). The joint ICA provided two distinct components, with the remaining three showing minimal structure. The first joint component showed a positive correlation between the modalities in the visual cortices, and had a similar spatial extent as the independent BOLD-fMRI and FDG-fPET activation maps (Figure 3). The second joint component demonstrated a negative correlation between the modalities, with a predominantly positive BOLD-fMRI signal correlated with a negative FDG-fPET signal. The spatial extent of the BOLD-fMRI response in the second joint ICA component was located in the visual cortices but with a smaller spatial extent than identified in the first joint ICA component. The negative FDG-fPET response was identified in the venous vasculature (Figure 5).Discussion
Activation in the visual cortices was mapped using an embedded block design using two distinct imaging modalities, BOLD-fMRI and FDG-fPET. Joint analysis of the simultaneous fMRI-fPET demonstrated the expected increased glucose and oxygen in the activated tissue. This demonstrates the feasibility of slow-infusion FDG for mapping neuronal responses to slowly varying tasks. We interpret the negatively-correlated component as a non-tissue venous vasculature signal. Following the neuronal activation, the draining blood vessels have an increased oxygen content resulting from the hemodynamic response function to neural activity, and a deceased glucose content, due to the increased uptake of glucose into brain tissue.Conclusion
In this work, we have demonstrated a novel task and an imaging strategy to (a) allow simultaneous high temporal resolution FDG-fPET/BOLD-fMRI imaging, and (b) deconstruct the BOLD-fMRI signal into neural tissue and vascular components. The simultaneous acquisition and analysis of the FDG-PET and BOLD-fMRI signals may be useful to enhance the spatial specificity of the BOLD response, by joint analysis with the FDG-fPET signal, whilst retaining the high spatial and temporal resolution of the BOLD-fMRI. In future, we aim to routinely acquire and reconstruct BOLD-fMRI time-series in which the non-local vascular effects have been removed to provide purely local neuronal tissue response time-series datasets.Acknowledgements
We would like to thank the volunteers for their time and willingness to participate in this study. We would also like to thank the technical staff, Richard McIntyre and Alexandra Carey, and research assistants, Winnie Orchard and Irene Graafsma, for helping collect the data.References
- Ogawa, S. et al. Intrinsic signal changes accompanying sensory stimulation: functional brain mapping with magnetic resonance imaging. Proc. Natl. Acad. Sci. 89, 5951–5955 (1992).
- Burgos, N. et al. Attenuation Correction Synthesis for Hybrid PET-MR Scanners: Application to Brain Studies. IEEE Trans. Med. Imaging 33, 2332–2341 (2014).
- Sforazzini, F. et al. MR-based attenuation map re-alignment and motion correction in simultaneous brain MR-PET imaging. in 2017 IEEE 14th International Symposium on Biomedical Imaging (ISBI 2017) 231–234 (2017). doi:10.1109/ISBI.2017.7950508
- Bell, A. J. & Sejnowski, T. J. An Information-Maximization Approach to Blind Separation and Blind Deconvolution. Neural Comput. 7, 1129–1159 (1995).
- Jenkinson, M., Beckmann, C. F., Behrens, T. E. J., Woolrich, M. W. & Smith, S. M. FSL. NeuroImage 62, 782–790 (2012).
- Calhoun, V. D. et al. A method for multitask fMRI data fusion applied to schizophrenia. Hum. Brain Mapp. 27, 598–610 (2006).
- Ward, P. G. D. et al. Combining images and anatomical knowledge to improve automated vein segmentation in MRI. NeuroImage (2017). doi:10.1016/j.neuroimage.2017.10.049
Figures