1258
Correlation between APT-CEST and 18F-Choline PET in glioma at 3T1Institute of Nuclear Medicine, UCLH, London, United Kingdom, 2Centre for Medical Imaging, UCL, london, United Kingdom, 3Medical school, UCL, london, United Kingdom, 4High Field Magnetic Resonance, Max Plank Institute, Tubinghen, Germany, 5Brain repair and Rehabilitation, UCL, London, United Kingdom, 6Teenage Cancer Unit, UCLH, london, United Kingdom
Synopsis
Chemical exchange saturation transfer MRI is emerging as a powerful diagnostic tool and has been shown to correlate with glioma tumour grade and molecular genetics. In this study, we aim to investigate whether APT signal is a non-invasive biomarker of Teenage and Young Adult glioma cell proliferation through correlation with 18F-Cho PET SUV as the gold standard. The strong positive correlation found in APT and 18F-Cho PET SUV indirectly demonstrates that APT SI may be a marker of glioma cell proliferation and further demonstrates the potential of APT in the assessment of glioma burden.
Introduction
High grade gliomas are the most common primary malignant brain tumours, and with a poor 5 year survival of 10%1, there has been recent interest in the development of both MRI and PET for improved assessment of tumour burden. Chemical exchange saturation transfer (CEST) MRI is emerging as a powerful diagnostic tool and has been shown to correlate with glioma tumour grade2 and molecular genetics3. However, the source of the APT signal and contrast remains contentious. Increased 11C-Choline (Cho) PET has been shown to correlate with cell proliferation in lung cancer biopsy specimens thought to be due to overexpression of choline kinase in tumour cell membranes4. In this study, we aim to investigate whether APT signal is a non-invasive biomarker of Teenage and Young Adult (TYA) glioma cell proliferation through correlation with 18F-Cho PET as the gold standard.Methods
Seven TYA patients referred for 18F-Cho PET-MRI with suspected glioma were recruited for APT-CEST with informed consent. Three patients underwent follow up imaging with a total of 11 studies included for analysis. All studies were conducted on a Siemens mMR biograph at our institution.
PET images were acquired 10 minutes following an intravenous injection of 18F-Cho (dose from 250 – 370 MBq depending on patient weight). Based on scatter and attenuation correction images, the Standardised Uptake Value (SUV) images were calculated accounting for time between injection and acquisition and the 18F half-life. APT-CEST was acquired with a gradient echo based snapCEST acquisition5, where a 3s (50% duty cycle) was used at two different powers (B1 = 0.75,1.25μT). A WASAB1 scan6 was acquired for field homogeneity corrections. APT-CEST was calculated as the normalised asymmetry at 3.5ppm and corrected for both B0 and B17 field inhomogeneity.
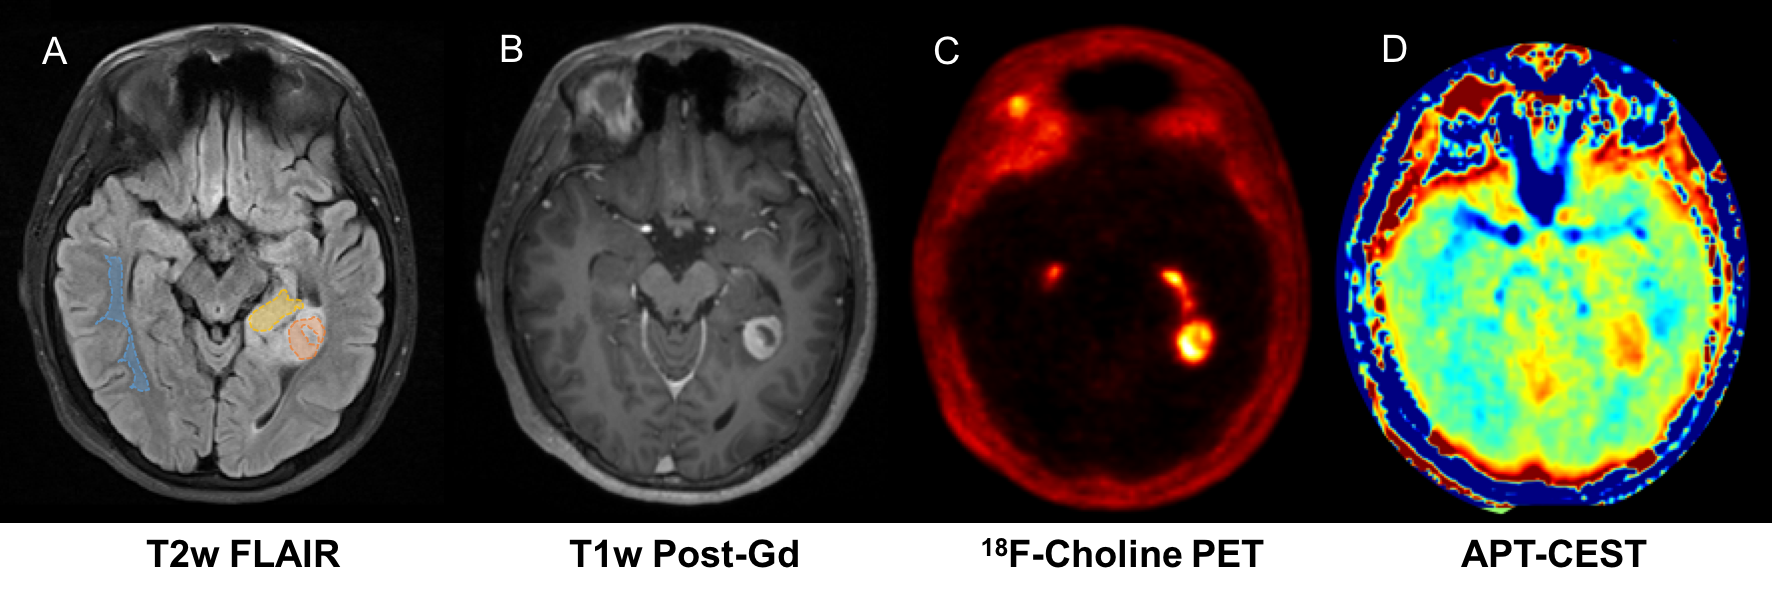
Regions of interest (ROI) of the ‘non-enhancing’, ‘enhancing’ and ‘necrotic core’ in the tumour and healthy ‘white matter’ (WM), were segmented from T2w-FLAIR and T1w-postGd images (Figure 1) and the mean APT signal intensity (SI) and mean Cho-SUV were extracted for each ROI. The correlation between APT SI and T2w-FLAIR, T1w-postGd and 18F-Cho was assessed using Spearman correlation coefficient.
Results
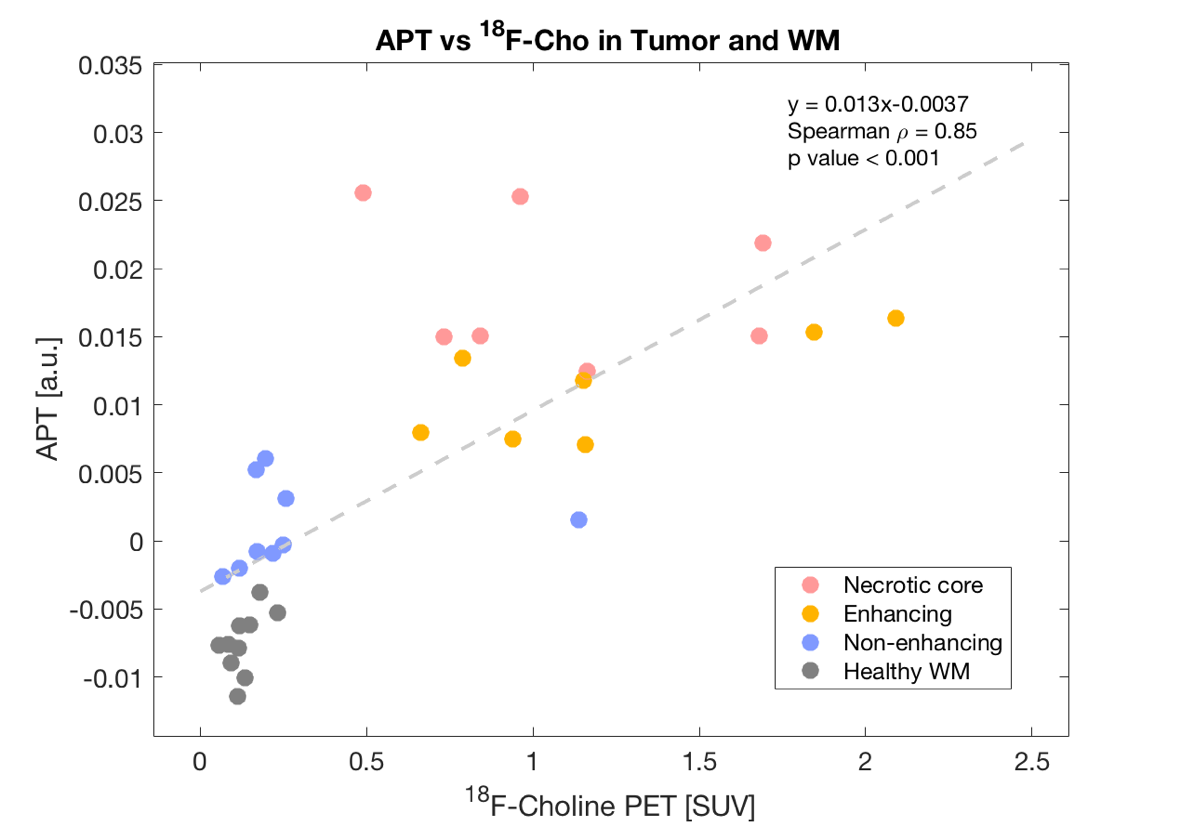
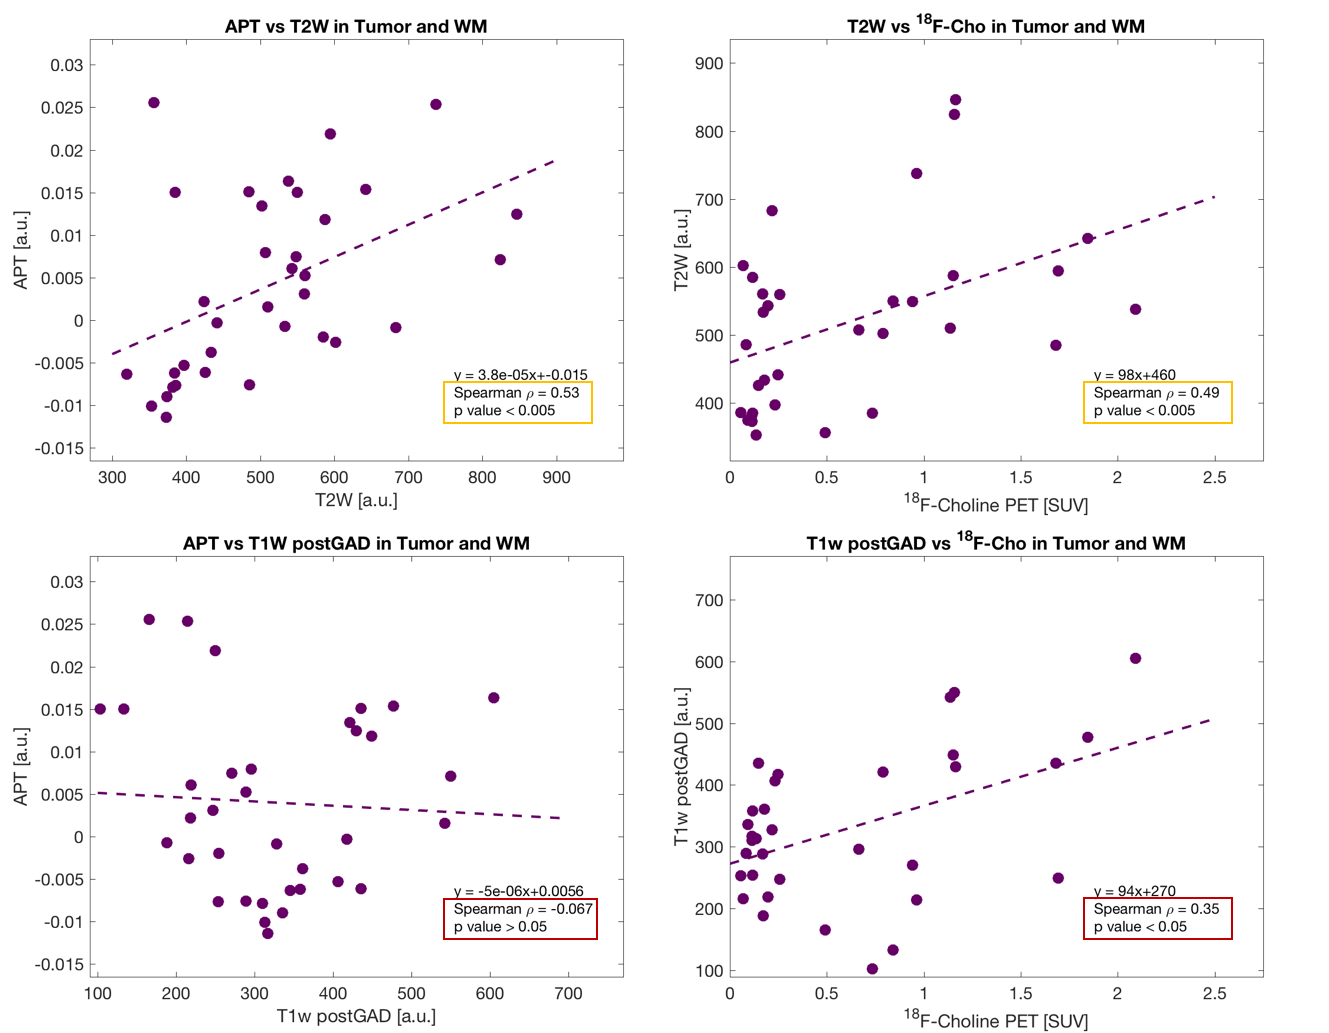
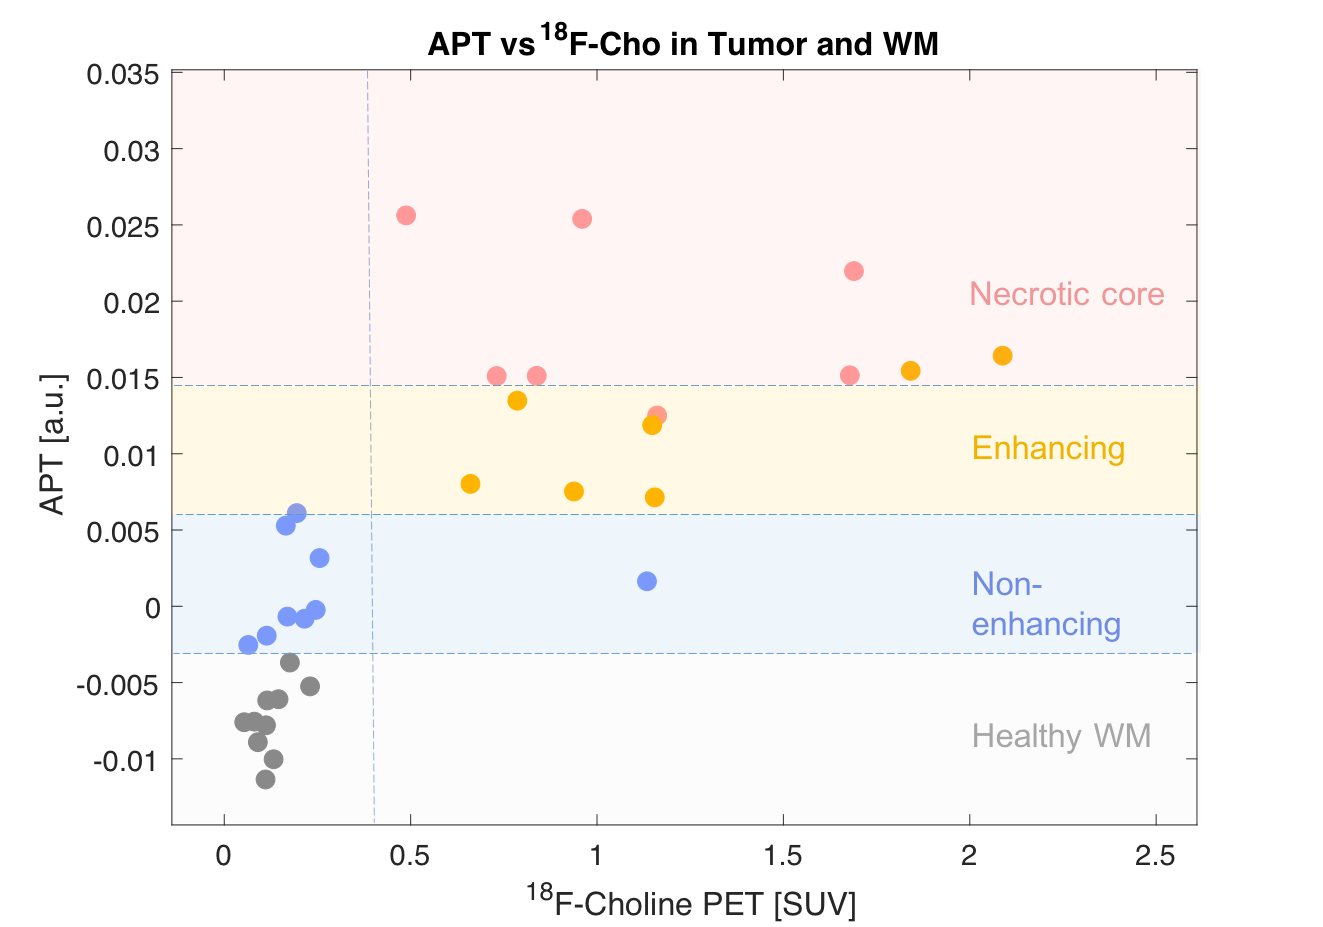
The strongest correlation was observed for APT versus 18F-Cho PET (Spearman ρ = 0.85,p<0.001,Figure 2). The highest APT signal was seen in the enhancing and necrotic core ROIs and the lowest APT signal seen in the non-enhancing tumour. Weaker correlations were seen for APT versus T2w (Spearman ρ =0.53, p<0.005) and for T2w versus 18F-Cho PET (Spearman ρ =0.49, p<0.005). No correlations were found between APT and T1w post Gd (Spearman ρ =-0.067,p>0.05) or 18F-Cho PET and T1w postGd (Spearman ρ =0.35, p<0.05, Figure 3). Figure 4 demonstrates that APT can separate the different tumour ROIs in particular, the non-enhancing tumour ROI can be differentiated from normal white matter (p<0.001). 18F-Cho PET , whilst being able to separate enhancing and necrotic tumour from normal WM (p<0.005), could not distinguish non-enhancing tumour from WM(p>0.05).Discussion
In this study, we have shown a strong positive correlation between that APT-CEST and 18F-Cho PET SUV in a cohort of TYA gliomas, stronger than with any of the other MRI techniques. 18F-Cho PET is a known marker of cellular membrane and phospholipid turnover used for the diagnosis of brain gliomas8 and correlation with glioma APT signal provides further evidence of APT could be used as a biomarker of glioma tumour burden. The principles by which the two imaging modalities work is certainly different. While the contrast in 18F-Cho originates from over expression of choline kinase in tumour cell membranes4, elevated APT SI has been thought to represent elevated endogenous cytosolic proteins and peptides in brain tumours9. Interestingly, APT was able to significantly separate non-enhancing tumour from normal white matter (p<0.001), not seen with 18F-Cho (p>0.05). It is not clear whether the apparent increased sensitivity of APT-CEST for non-enhancing tumour is due to increased endogenous protein concentration in a region of lower cellular proliferation or due to a T2 effect. Nevertheless, APT-CEST shows promise in the assessment of therapeutic response in 18F-Cho negative non-enhancing tumour. This is currently being validated in a larger therapeutic study.Conclusion
This study presents the first comparison of APT-CEST and 18F-Cho PET in patients with TYA gliomas. The strong positive correlation indirectly demonstrates that APT SI may be a marker of glioma cell proliferation and further demonstrates the potential of APT in the assessment of glioma burden. In addition, the significantly increased APT SI but not 18F-Cho PET in non-enhancing tumour compared to normal white matter indicates that APT-CEST could be a useful adjunct in monitoring disease activity in 18F-Cho negative non-enhancing tumour.Acknowledgements
No acknowledgement found.References
1. deSouza RM, Shaweis H, Han C et al. Has the survival of patients with glioblastoma changed over the years? Br J Cancer 2016;114: 146-150
2. Togao, O, Yoshiura, T, Keupp, J, et al. Amide proton transfer imaging of adult diffuse gliomas: correlation with histopathological grades. Neuro-Oncology 2014; 16(3): 441–8
3. Jiang S, Zou T, Eberhart CG et al. Predicting IDH mutation status in grade II gliomas using amide proton transfer-weighted (APTw) MRI. Magn Reson Med 2017; 78(3): 1100-1109
4. Li M, Peng, Z, Liu, Q et al. Value of 11C-choline PET/CT for lung cancer diagnosis and the relation between choline metabolism and proliferation of cancer cells. Oncology Reports 2012; 29(1): 205–11.
5. M Zaiss, P Ehses and K Scheffler. SnapCEST- A single shot 3D CEST sequence for motion correction CEST MRI. Proceeding of ISMRM, Hawaii, 2017
6. P Schuenke, J Windschuh, V Roeloffs et al. Simultaneous mapping of water shift and B1 (WASABI)-application to field inhomogeneity correction of CEST MRI data. Magn Reson Med 2017; 77(2):571-80
7. J Windschuh, M Zaiss, J Meissner, et al. Correction of B1 inhomogeneities for relaxation-compensated CEST imaging at 7T. MR in Biomed 2015; 28(5): 529-37
8. E Giovanni, P Lazzeri, A Milano, et al. Clinical applications of choline pet-ct in brain tumors. Current Pharmac Des 2015; 21: 121-127
9. Zhou J, Lal B, Wilson DA et al. Amide proton transfer (APT) contrast for imaging of brain tumours. Magn Reson Med 2003; 50: 1120-1126.
Figures