1256
Simultaneous PET and MRSI of Prostate Cancer1Department of Circulation and Medical Imaing, NTNU - Norwegian University of Science and Technology, Trondheim, Norway, 2St. Olavs Hospital, Trondheim University Hospital, Trondheim, Norway, 3Department of Radiology and Nuclear Medicine, Radboud University Medical Center, Nijmegen, Netherlands
Synopsis
Both positron emission tomography (PET) and magnetic resonance spectroscopic imaging (MRSI) can give important information about cancer metabolism. With an integrated PET/MR scanner, MRSI and PET images can be acquired simultaneously. The aim of this study was to examine possible correlations between 18F-Fluciclovine PET and MRSI measurements and evaluate their diagnostic performance in prostate cancer. The results showed a significant moderate correlation between both SUVmean and SUVmax and the CCS/C ratio. A combination of the imaging outcomes derived from the integrated PET-MRSI modalities improved the localization accuracy of prostate cancer lesions.
Introduction
MR spectroscopic imaging (MRSI) can non-invasively detect and quantify prostate metabolites, such as choline-containing metabolites (tCho), citrate, creatine and spermine. Increased tCho and decreased citrate and spermine levels are metabolic alterations associated with prostate cancer. Lower citrate and spermine and elevated tCho are also correlated with prostate cancer aggressiveness (Gleason score[1])[2, 3], and the metabolite ratio (tCho+creatine+spermine)/citrate has been proposed as a biomarker for prostate cancer[3]. Positron emission tomography (PET) is another imaging technique that provides metabolic information. PET imaging with the amino-acid tracer anti-1-amino-3-18F-fluorocyclobutane-1-carboxylic acid (18F-Fluciclovine) is promising for detection and characterization of prostate cancer[4]. Despite significant differences in the 18F-Fluciclovine uptake between cancer tissue and normal prostate tissue, there is overlap of the uptake between prostate cancers and benign lesions, such as benign prostatic hyperplasia (BPH). With an integrated PET/MR scanner, MRSI and PET images can be acquired simultaneously. Since both PET and MRSI focus on metabolism, the aim of this study was to examine their correlations and diagnostic performance in prostate cancer lesion localization.Methods
Nineteen patients (median (range) age of 66 (55-72) years) with biopsy proven high risk prostate cancer (Gleason score ≥ 8 and/or a prostate specific antigen (PSA) ≥ 20 ng/mL, and/or clinical stage ≥ cT3) were included. Imaging protocol: Imaging was performed on an integrated 3T PET/MR system (Biograph mMR, Siemens Healthineers, Erlangen, Germany). The PET/MR protocol consisted of a full clinical mpMRI examination for T+N-staging, combined with 45 minutes of simultaneous PET imaging as previously described[4]. MRSI data was obtained with a standard point resolved spectroscopy (PRESS) sequence with dual-frequency water and lipid suppression at TR/TE=750/145 ms[5], FOV=70×70×70 cm3, interpolated matrix size of 16×16×16, and outer volume suppression slabs positioned around the prostate. MRSI analysis: Spectroscopy voxels with sufficient signal to noise based on visual inspection were selected for analysis. Spectral data were analyzed using the Java-based software jMRUI v5.2 (http://www.jmrui.eu/), and the spectral peaks were fitted using the AMARES method[6]. The total spectral intensity of all resonances from tCho, creatine, and spermine (3.0 - 3.22 ppm) were summed and expressed as CCS. The citrate peaks were modeled as a sum of four Lorentzian peaks. The metabolite ratio of CCS to citrate (CCS/C) was generated voxel-wise. PET analysis: Standardized uptake values (SUV) were linearly interpolated to overlay on both the corresponding T2-weighted image and the spectroscopic voxel matrix. The MRSI voxels are considerably larger than PET voxels, thus, a voxel from the MRSI data contained sixteen SUV voxels. The mean and maximum values of these sixteen SUVs were calculated, giving the SUVmean and SUVmax per MRSI voxel (Fig 1). Histopathology: A pathologist specialized in uropathology outlined cancer foci and regions of BPH and inflammation and described cancer grade according to the Gleason scoring system[1] on whole-mount histopathology slices. We used these slices to identify the underlying tissue content of the selected spectroscopy voxels by visually matching them with the corresponding slice of T2-weighted images.Results
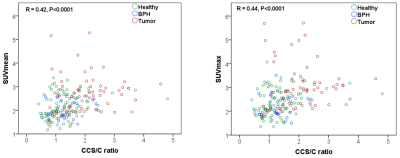
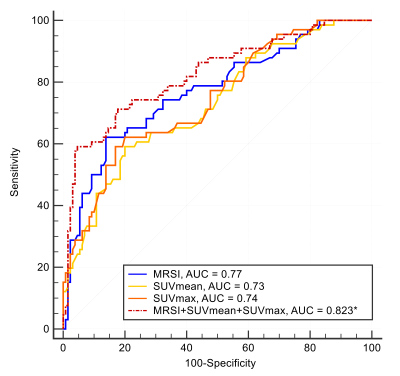
The included patients (n=19) had a median (range) PSA level of 15.4 (3.7-56.9) ng/mL, median (range) biopsy Gleason of 4+5 (3+3 to 4+5), and their clinical stage ranged from cT2b to cT3b. In total 196 spectroscopic voxels with sufficient signal-to-noise were analyzed (on average 10 voxels per patient). MRSI voxels were categorized as representing either healthy (n=105), BPH (n=40), or tumor tissues (n=51) based on histology. The metabolic ratio derived from MRSI was significantly correlated with both SUVmean (R=0.42, P<0.0001) and SUVmax (R=0.44, P<0.0001) (Fig. 2). The results from ROC analysis show that neither MRSI nor PET performed better than the other in distinguishing tumor voxels from other voxels (healthy and BPH). The AUC of the ROC curves for CCS/C, SUVmean, and SUVmax did not differ significantly, but were significantly higher than unity (50%) line (Fig. 3). Importantly, the combination of all imaging variables provided a higher AUC value than the AUC values derived from the individual ROCs (P<0.05).Discussion
In this study, we demonstrate that the simultaneous acquisition of 18F-Fluciclovine PET and MRSI with an integrated PET/MR system is feasible. Although the number of MRSI voxels with sufficient SNR was low, we could explore the association between MRSI visible metabolites and uptake of the amino acid analogue 18F-Fluciclovine based on simultaneous MRSI and PET imaging. The results showed a significant, yet moderate correlation between both SUVmean and SUVmax and the CCS/C ratio, indicating complementary information regarding prostate metabolites from the two modalities. A combination of the imaging outcomes derived from the integrated PET/MRSI modalities improves the localization accuracy of prostate cancer lesions.Acknowledgements
No acknowledgement found.References
1.Epstein, Update on the Gleason grading system. Ann Pathol, 2011
2.Giskeodegard, et al., Spermine and citrate as metabolic biomarkers for assessing prostate cancer aggressiveness. PLoS One, 2013
3.Kobus, et al., Metabolite ratios in 1H MR spectroscopic imaging of the prostate. Magn Reson Med, 2015
4.Elschot, et al., A PET/MRI study towards finding the optimal [18F]Fluciclovine PET protocol for detection and characterisation of primary prostate cancer. Eur J Nucl Med Mol Imaging, 2017
5.Scheenen, et al., Optimal timing for in vivo 1H-MR spectroscopic imaging of the human prostate at 3T. Magn Reson Med, 2005
6.Vanhamme, et al., Improved method for accurate and efficient quantification of MRS data with use of prior knowledge. J Magn Reson, 1997
Figures


