1255
Simultaneous characterization of tumor cellularity and aerobic glycolysis with PET, MR and MRSI1Department of Nuclear Medicine, Technical University Munich, Klinikum rechts der Isar, Munich, Germany, 2Department of Chemistry, Technical University Munich, Garching, Germany, 3Department of Radiology, Medical Physics, Medical Center - University of Freiburg, Faculty of Medicine, University of Freiburg, Freiburg, Germany, 4German Consortium for Translational Cancer Research (DKTK), Partnersite Freiburg, German Center for Cancer Research (DKFZ), Heidelberg, Germany, 5Department of Clinical Physiology, Nuclear Medicine & PET and Cluster for Molecular Imaging, Rigshospitalet and University of Copenhagen, Copenhagen, Denmark, 6Department of Radiology, Technical University Munich, Klinikum rechts der Isar, Munich, Germany, 7Munich School of Bioengineering, Technical University Munich, Garching, Germany
Synopsis
The new paradigm in oncology to tailor patient-specific therapies triggered the invention of powerful imaging techniques to non-invasively quantify tumor biology in depth. PET/MR is an emerging new hybrid imaging modality that allows the simultaneous acquisition of high resolution anatomical, functional and metabolic information.
We established a multimodal imaging workflow on a whole-body PET/MR system to quantify tumor cellularity, glucose uptake and aerobic glycolysis. We applied this workflow on a pre-clinical breast cancer model in a longitudinal study to analyze the effect of necrosis and tumor growth on metabolic parameters and measure the correlation of glucose uptake and LDH activity.
Inroduction
PET/MR (positron emission tomography/magnetic
resonance) is an emerging hybrid imaging technology that is potentially
superior to PET/CT (computed tomography). The system allows the acquisition of
high resolution anatomical images with excellent soft tissue contrast and the
quantification of cellular and metabolic data with functional imaging and MR
spectroscopic imaging (MRSI).1,2
Here, we established a multimodal imaging workflow on a clinical PET/MR system
to simultaneously quantify tumor cell density with diffusion weighted imaging
(DWI), glucose uptake with FDG-PET, and LDH activity with MRSI of
hyperpolarized [1-13C]pyruvate in a pre-clinical breast cancer
model.
Methods
MAT-B-III
tumors were induced in eleven Fischer344 female rats by subcutaneous implantation
of 1x10⁶ cells/200µL. Three animals were used to validate static and
dynamic FDG uptake measured on the PET/MR (mMR Biograph, Siemens) with uptake
measurements on a pre-clinical PET/CT (Inveon, Siemens). For this purpose,
animals were measured on the PET/CT and ten hours later at the PET/MR.
Multimodal
imaging was performed eight, ten and thirteen days after cell injection. 11±2MBq
[18F]FDG were injected (tail-vein) followed by 90min PET. Meanwhile,
2D and 3D T1- and T2-weighted imaging, 2D-dynamic
chemical shift imaging (CSI, 20 time-steps, 5.8s/time-step, resolutionnominal:
10x10x13mm3) of hyperpolarized pyruvate (90±3mM, pH7.6±0.2) and 2D-diffusion
weighted imaging was performed.
PET/CT
images were reconstructed in 12x10s, 6x30s, and 11x300s frames using an
ordered-subsets expectation-maximization (OSEM) 3D-algorithm (2 iterations, 16
subsets). PET/MR data was reconstructed in 12x10s, 6x30s and 17x300s bins using
a fully iterative OSEM 3D-algorithm (3 iterations, 21 subsets). Spatially
resolved 13C-data were zero-filled by a factor of four in the two
spatial dimensions and a factor of two in spectral dimension before Fourier
transformation. Pyruvate and lactate time curves of whole tumor
regions of interest (roi) were fitted to a two-site exchange model, yielding kPL
as an expression of lactate dehydrogenase (LDH) activity.3 Tumor cellularity was quantified by
calculating mean apparent diffusion coefficients (ADCs) of whole tumor rois,5. Data are represented as mean±std.
Statistical analysis was performed with GraphPad prism (GraphPad Software).
Correlations of quantitative parameters were calculated with a two-tailed
t-test yielding Pearson product-moment coefficients (significance level: *p<0.05).
Results
Before
performing a longitudinal study with the PET/MR we validated FDG uptake with
measurements at a small-animal PET/CT. SUVmean/max show no
significant difference between the two systems (Figure 1). However, we observed that image derived input functions
measured in the vena cava were underestimated by a factor of ~1.8, which leads
to an overestimation of Ki-values obtained by Patlak analysis (not
shown).
A
scheme of the multimodal imaging workflow established on a whole-body PET/MR is
shown in Figure 2. We acquired dynamic
PET images and simultaneously measured 2D and 3D T1- and T2-weighted
images to localize tumors for an accurate positioning of 2D axial 13C-CSI
and 2D DWI images that were measured 60-90min after FDG application.
A
Qualitative (Figure 3 A) and quantitative
(Figure 3 B) comparison of static
late-frame FDG images and 13C-MRSI data show a good positive correlation
of augmented glucose uptake and elevated LDH activity (n=24). The Pearson
coefficients for the correlation of SUVmean and kpl and
the correlation of SUVmax and kpl were 0.62 (p=0.0012)
and 0.58 (p=0.0031), respectively.
We further analyzed the effect of progressive necrosis
ad tumor growth on longitudinal metabolic PET and 13C data. Pearson
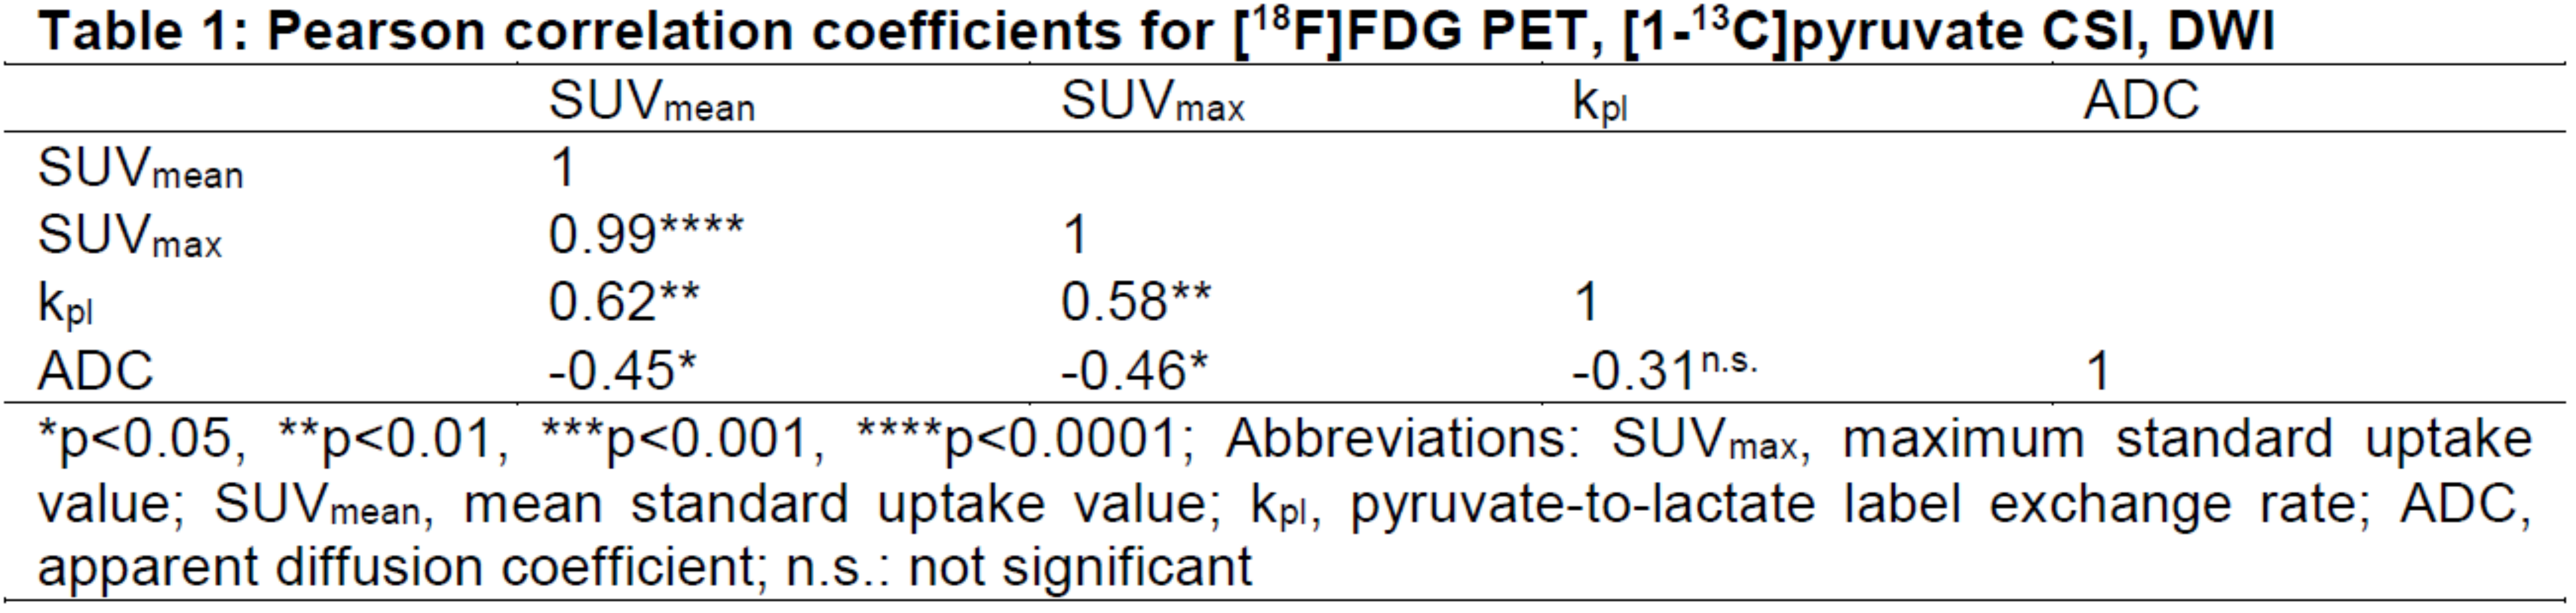
correlation coefficients are displayed in Table
1. We measured increasing ADC values with growing MAT-B-III tumors, while
FDG uptake decreased. A similar but not significant trend was observed with kpl
values.
We
developed a multimodal imaging workflow on a clinical system to simultaneously
quantify FDG uptake, LDH activity and cell density in rodents. FDG uptake can
be measured accurately at the clinical system, while activity recovery in
smaller structures (e.g. vena cava) are underestimated, which we attribute to
limited spatial resolution (data not shown). Notably, we show a good
quantitative and qualitative correlation of augmented glucose consumption and
increased LDH activity. This indicates that a major portion of consumed
glucose is metabolized by oxidative glycolysis in the investigated tumor model.
This metabolic abnormality is known as the Warburg effect6 and is one of the hallmarks of tumors7. Inverse correlations of DWI and
FDG-PET further show that both modalities can be used to address cell density
of tumors.8 The correlation of
ADC with kpl showed similar but not significant trends, which is
probably due to a low spatial resolution of 13C-images.
Conclusion
We established a
workflow that allows multiparametric tumor characterization at a hybrid PET/MR.
Used methods can readily be transferred to bigger tumor models with potential
for clinical applications paving the way for tailored and patient-specific therapy
approaches.
Acknowledgements
We thank Cambridge Isotope Laboratories Inc. for providing [1-13C]pyruvate and appreciate support from EU Grant No. 294582 (MUMI), BMBF (FKZ 13EZ1114), DFG (SFB 824) and the DFG Major Instrumentation Initiative PET/MR.
We acknowledge Birgit Blechert and Michael Michalik for culturing cells, Sylvia Schachoff for her help at the PET/MR and Sybille Reder and Markus Mittelhäuser for performing the PET/CT measurements.
References
1 Rosenkrantz, A. B. et al. Current Status of Hybrid PET/MRI
in Oncologic Imaging. American journal of
roentgenology 206, 162-172 (2015).
2 Sauter, A. W., Wehrl, H. F.,
Kolb, A., Judenhofer, M. S. & Pichler, B. J. Combined PET/MRI: one step
further in multimodality imaging. Trends
in molecular medicine 16,
508-515 (2010).
3 Day, S. E. et al. Detecting tumor response to
treatment using hyperpolarized 13C magnetic resonance imaging and spectroscopy.
Nature medicine 13, 1382-1387 (2007).
4 Padhani, A. R. et al. Diffusion-Weighted Magnetic
Resonance Imaging as a Cancer Biomarker: Consensus and Recommendations. Neoplasia. 11, 102-125 (2009).
5 Koh, D.-M. & Collins, D.
J. Diffusion-Weighted MRI in the Body: Applications and Challenges in Oncology.
American journal of roentgenology 188, 1622-1635 (2007).
6 Warburg, O. On the Origin of
Cancer Cells. Science 123, 309-314 (1956).
7 Hanahan, D. & Weinberg,
R. A. Hallmarks of cancer: the next generation. Cell 144, 646-674, (2011).
8 Baba, S. et al. Diagnostic and prognostic value
of pretreatment SUV in 18F-FDG/PET in breast cancer: comparison with apparent
diffusion coefficient from diffusion-weighted MR imaging. Journal of nuclear medicine 55,
736-742 (2014).
Figures
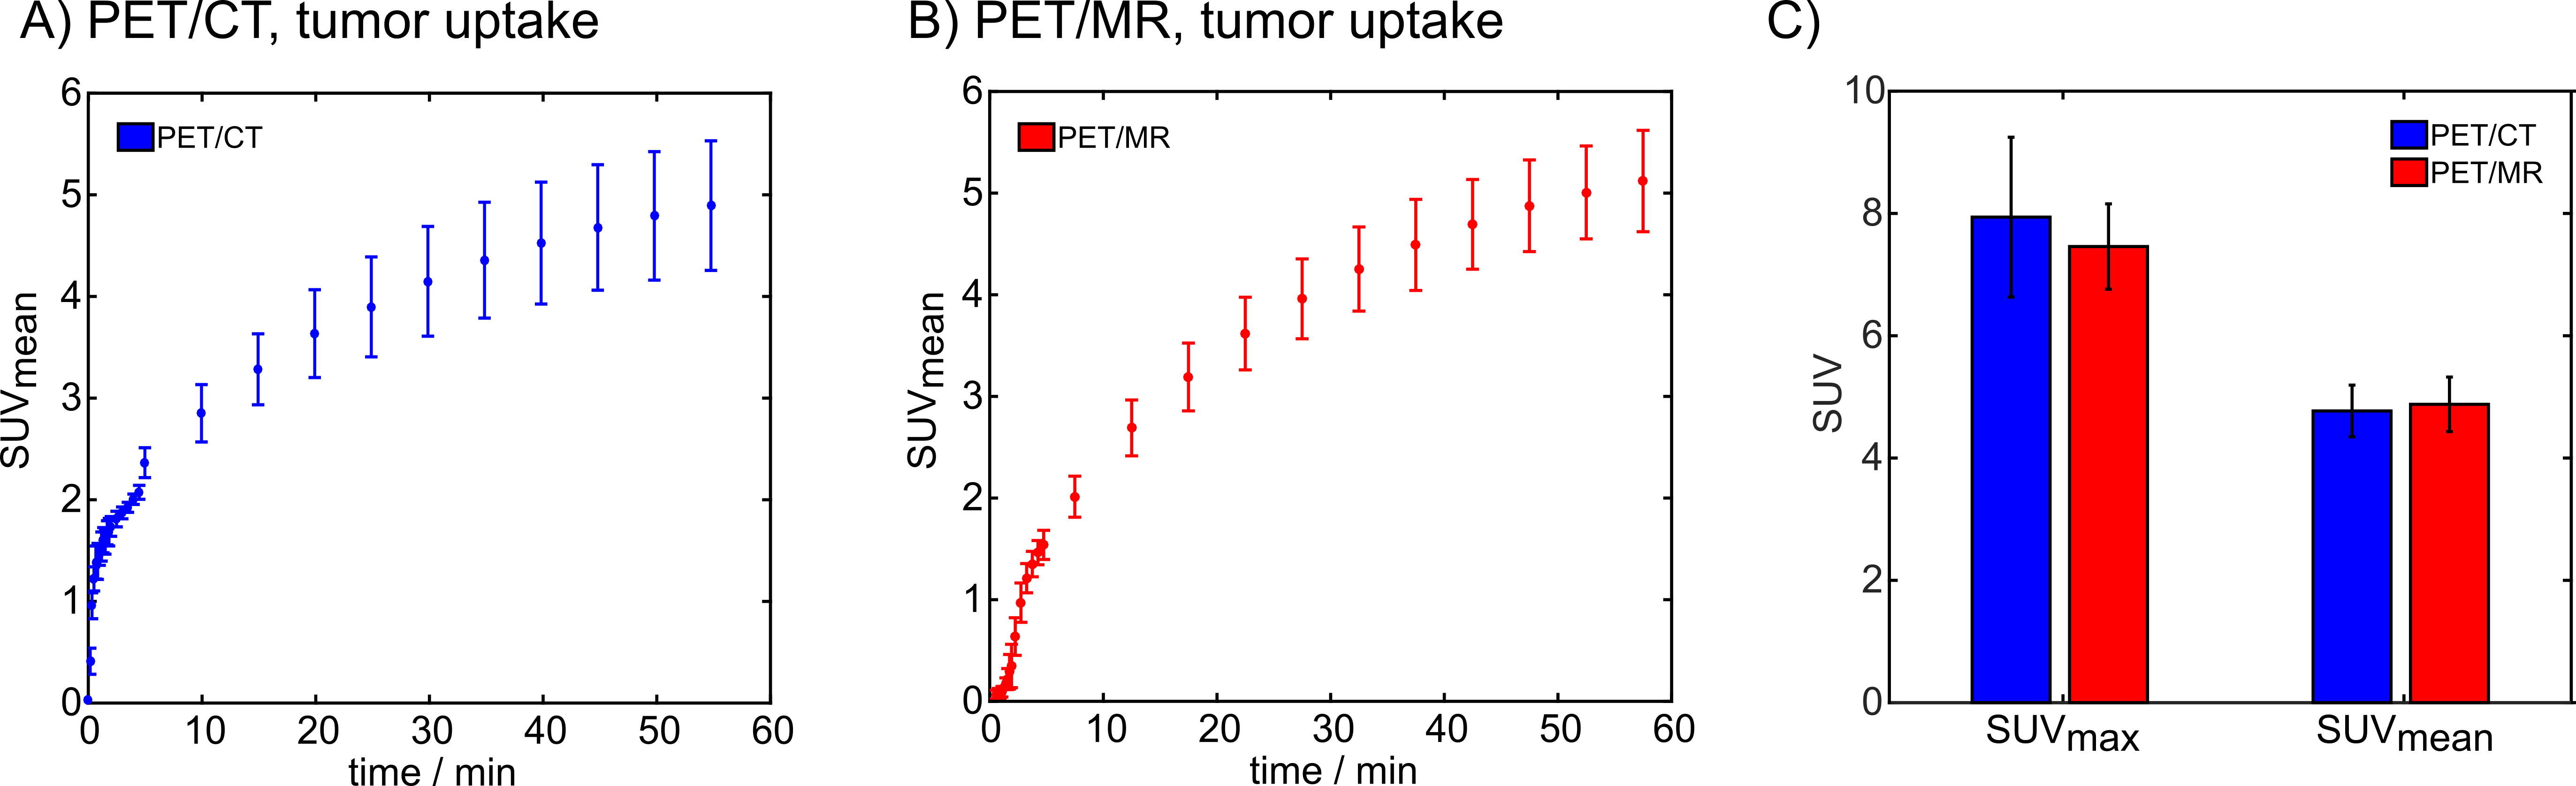
Figure 1. Comparison of tumor FDG uptake measured with
a pre-clinical PET/CT and a clinical PET/MR. A) Tumor FDG uptake curves measured with PET/CT. B) tumor uptake curves measured with
PET/MR. C) Comparison of SUVmean
and SUVmax values obtained with PET/CT and PET/MR.
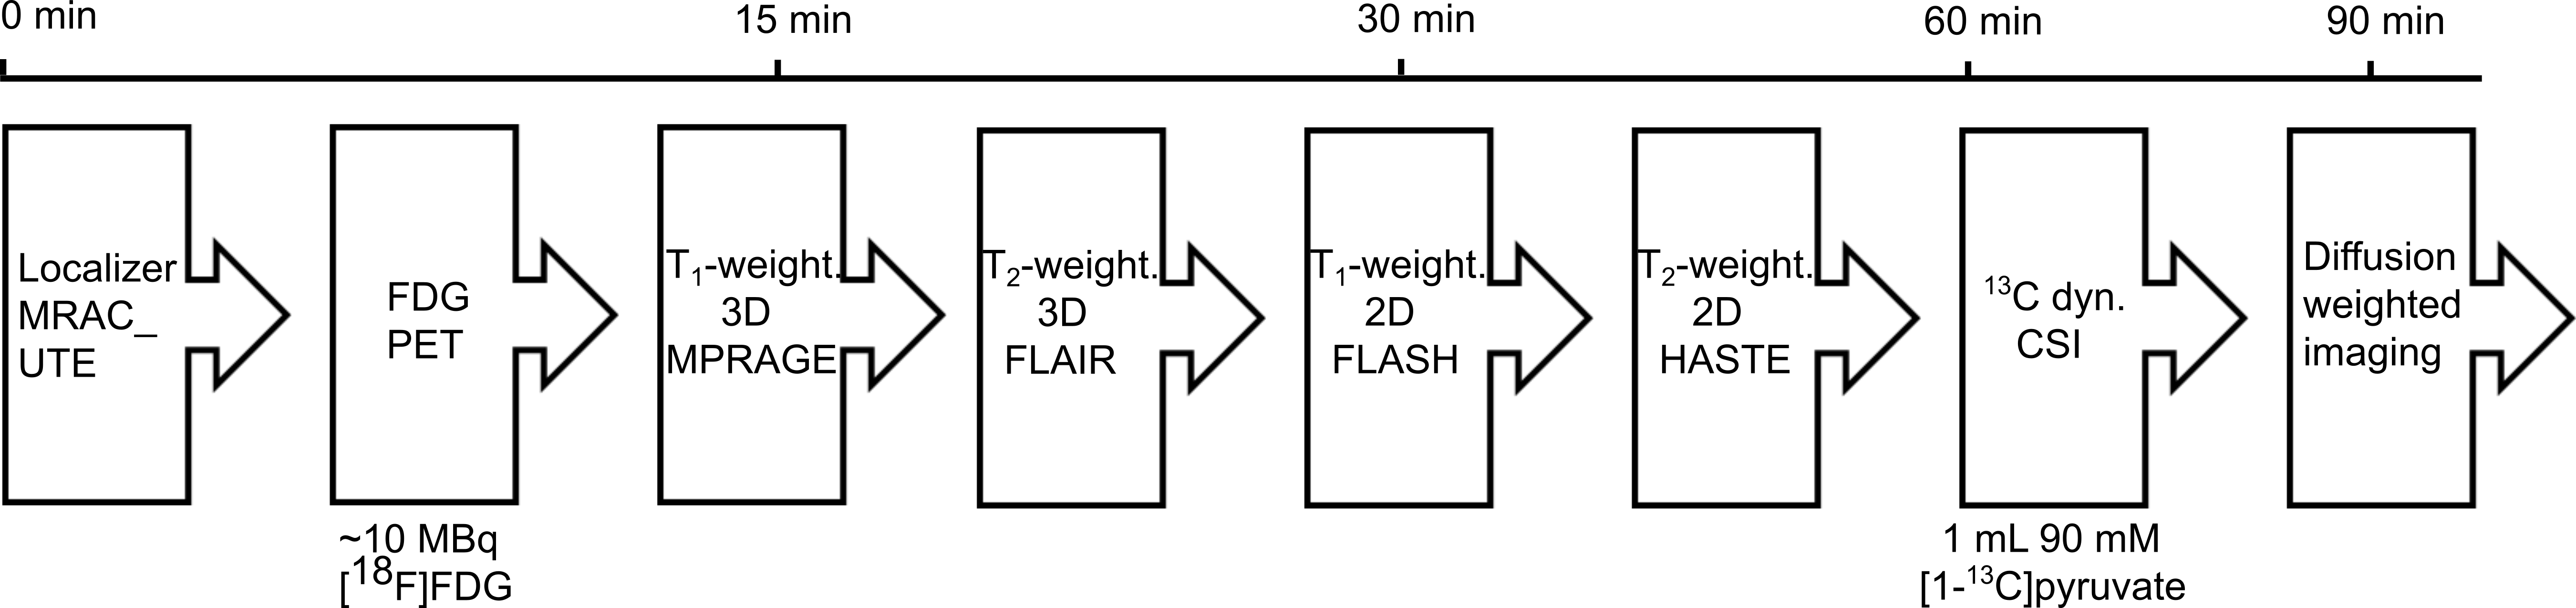
Figure 2: Multimodal imaging workflow established on a clinical PET/MR scanner. MR
based attenuation correction images were acquired before dynamic FDG-PET scans
were started. Simultaneously with PET, we acquired T1- and T2-weighted
two and three dimensional images for tumor localization and delineation.
Metabolic mapping of hyperpolarized pyruvate was performed 60-90 minutes after
FDG injection. At the end of each scan, 2D diffusion weighted imaging was
performed.
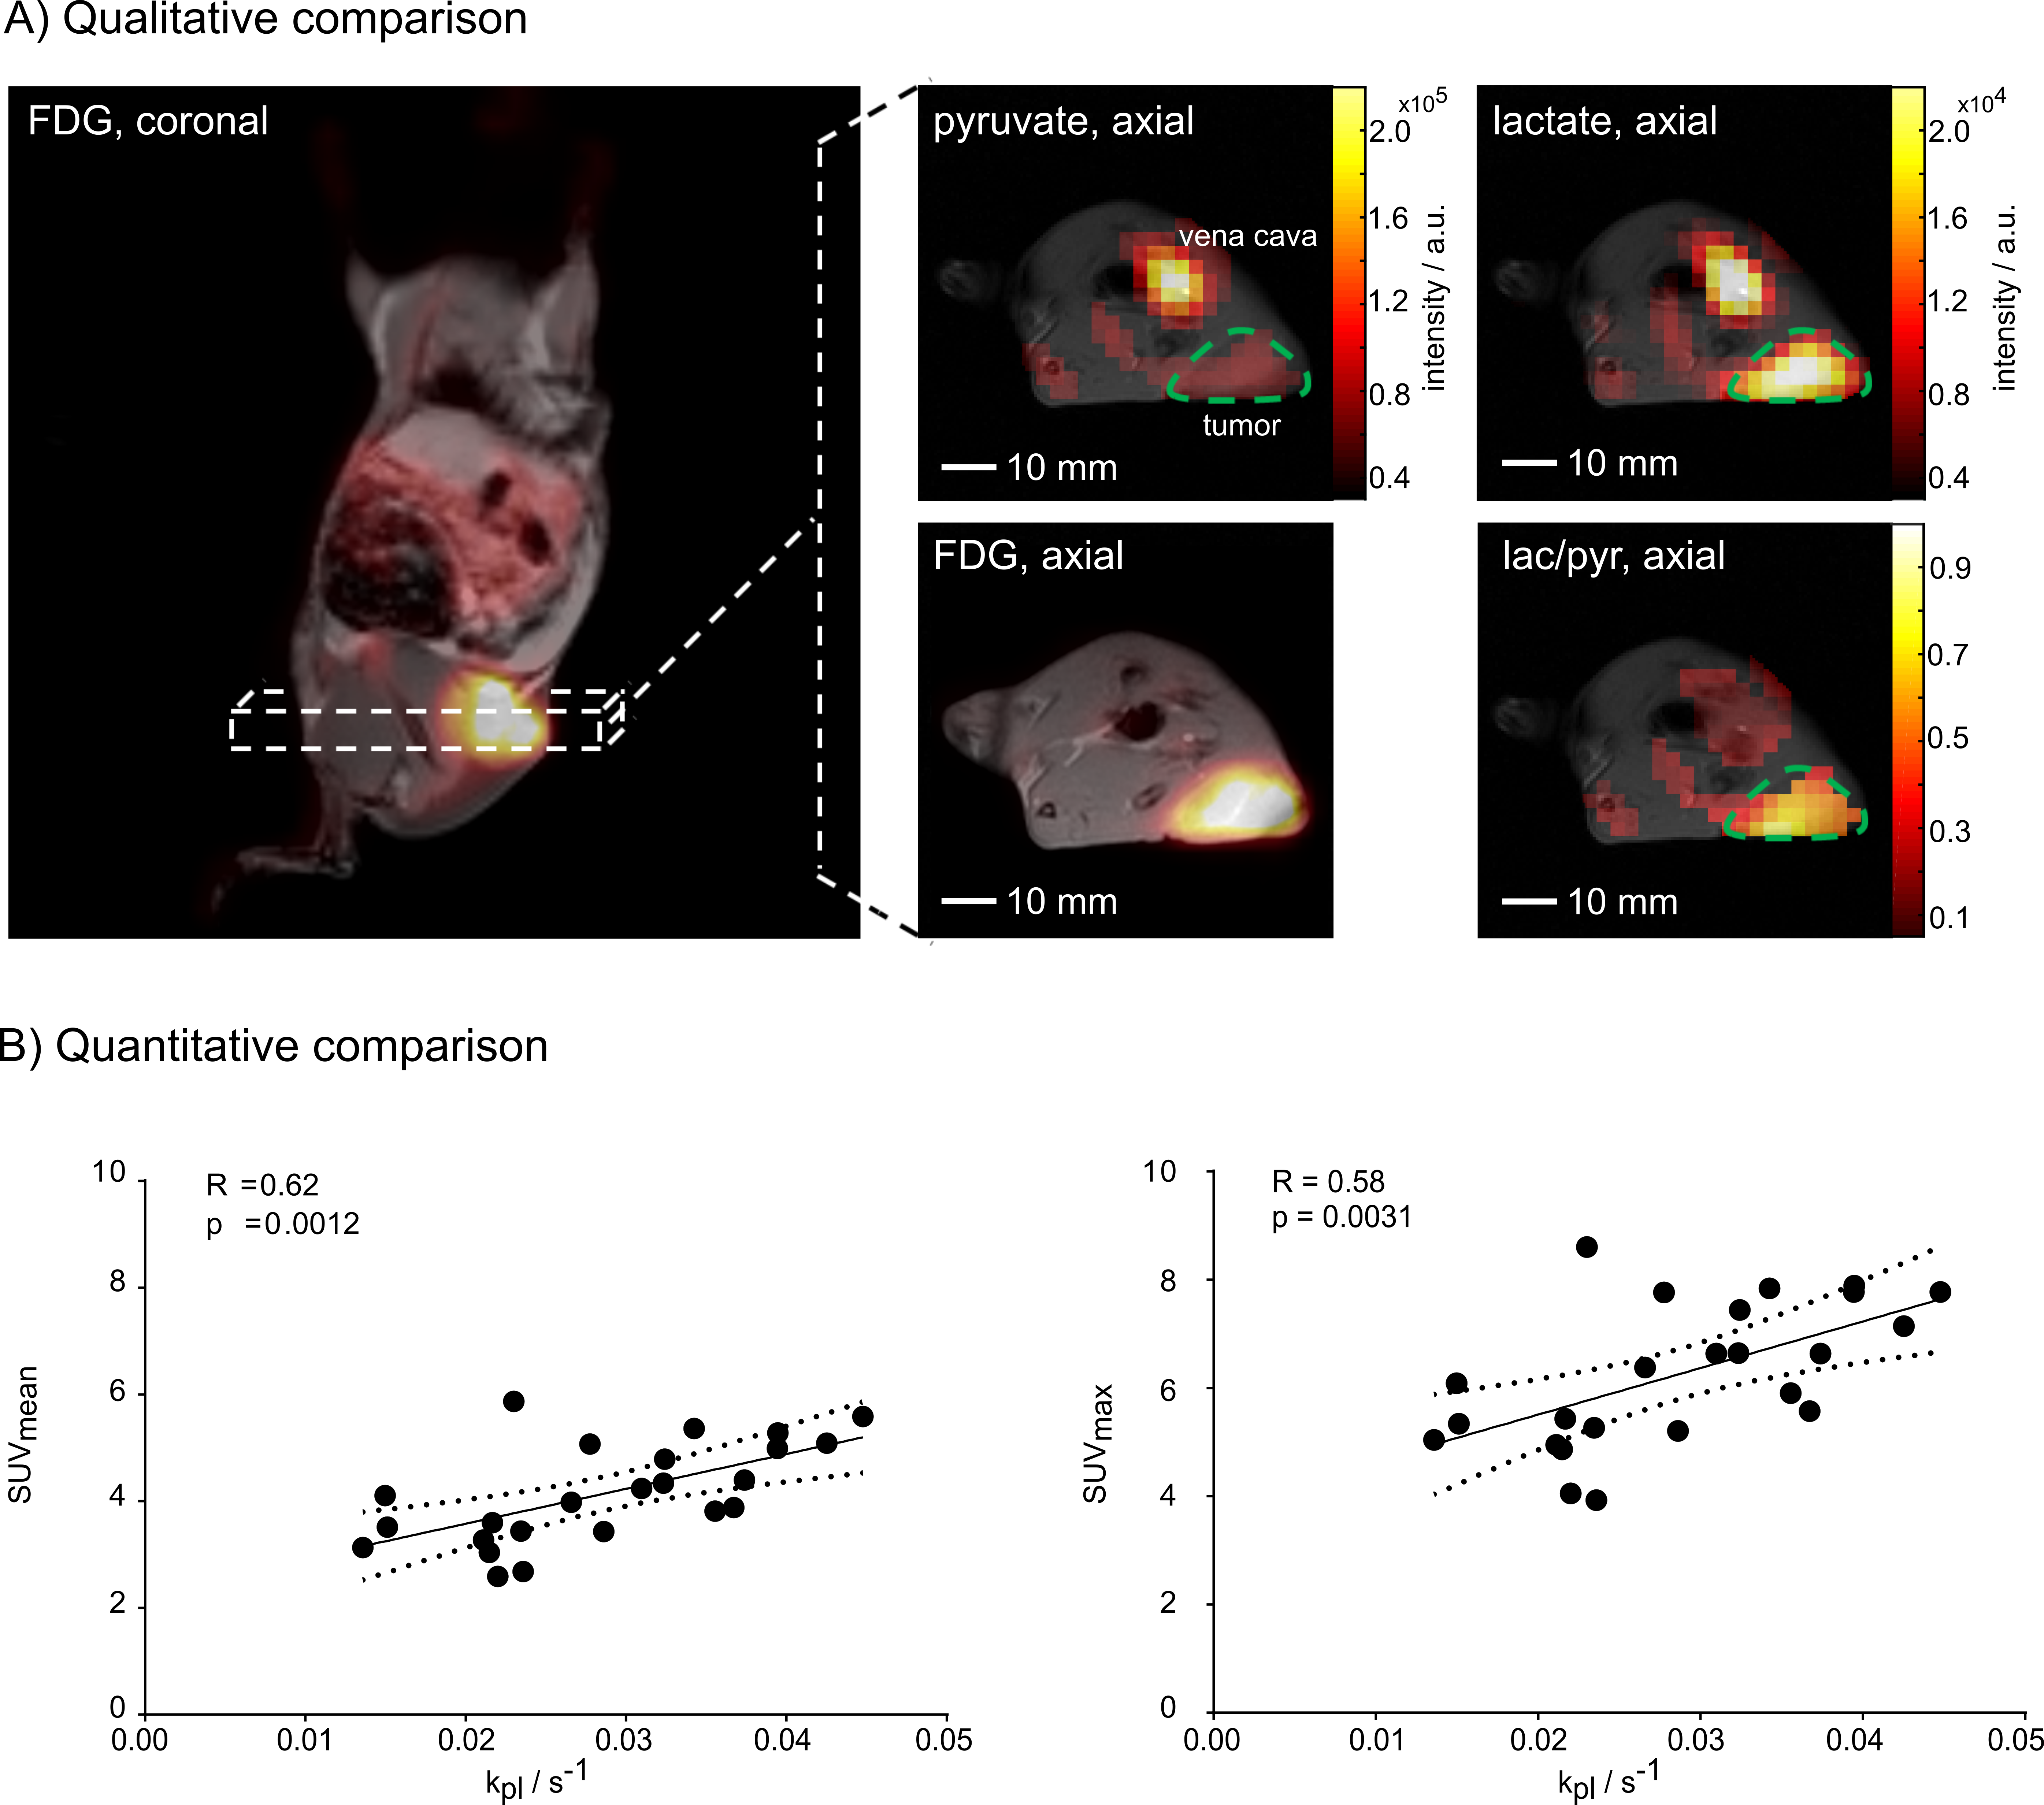
Figure 3: Qualitative and quantitative comparison of FDG uptake and LDH activity. A) coronal and an axial static late
frame FDG image overlaid on T1-weighted images are displayed. Axial
images of 13C-pyruvate and lactate as well as lac/pyr ratio images overlaid
on T1-weighted images and with the same orientation as
the axial PET image. Images show a good correlation of FDG uptake and LDH
activity. B) shows correlation plots
of SUVmean and kpl
(left) and SUVmax and kpl (right) with best fit line
(solid line) and 95% confidence bounds (dashed lines).