1253
Deep Learning based pseudo-CT computation and its application for PET/MR attenuation correction and MR-guided radiation therapy planning1GE Global Research, Bangalore, India, 2GE Healthcare, Munich, Germany, 3Umeå University, Umeå, Sweden, 4UCSF, San Fransisco, CA, United States
Synopsis
In this work, we demonstrate a generic deep learning (DL) model that computes pCT images (i.e. continuous density bone) using a single channel ZTE MRI data and is robust to protocol and coil variations (as dictated by application needs). The method was evaluated for PET/MR attenuation correction protocol (low resolution for speed) and MRgRTP dose planning protocol (higher resolution for spatial accuracy). The advantages include a single model for multiple protocols, pCT which are very much like real CT in appearance, as well as excellent quantitative accuracy of estimated bone values in the computed pCT.
Introduction
Generation of pseudo CTs (pCT [HU]) from MR images is of interest for applications such as PET/MR attenuation-correction (AC), and MR-guided radiation therapy planning (MRgRTP). In most previous methods, pCT was computed from multi-channel MRI data: Dixon based LAVA-Flex MR, T1-MR+Atlas, or ZTE+LAVA-Flex MR [1, 2]. In this work, we demonstrate a generic deep learning (DL) model that computes pCT images (i.e. continuous density bone) using a single channel ZTE MRI data and is robust to protocol variations (as dictated by application needs). The method was evaluated for PET/MR attenuation correction protocol (low resolution for speed) and MRgRTP dose planning protocol (higher resolution for spatial accuracy).Methods and Materials
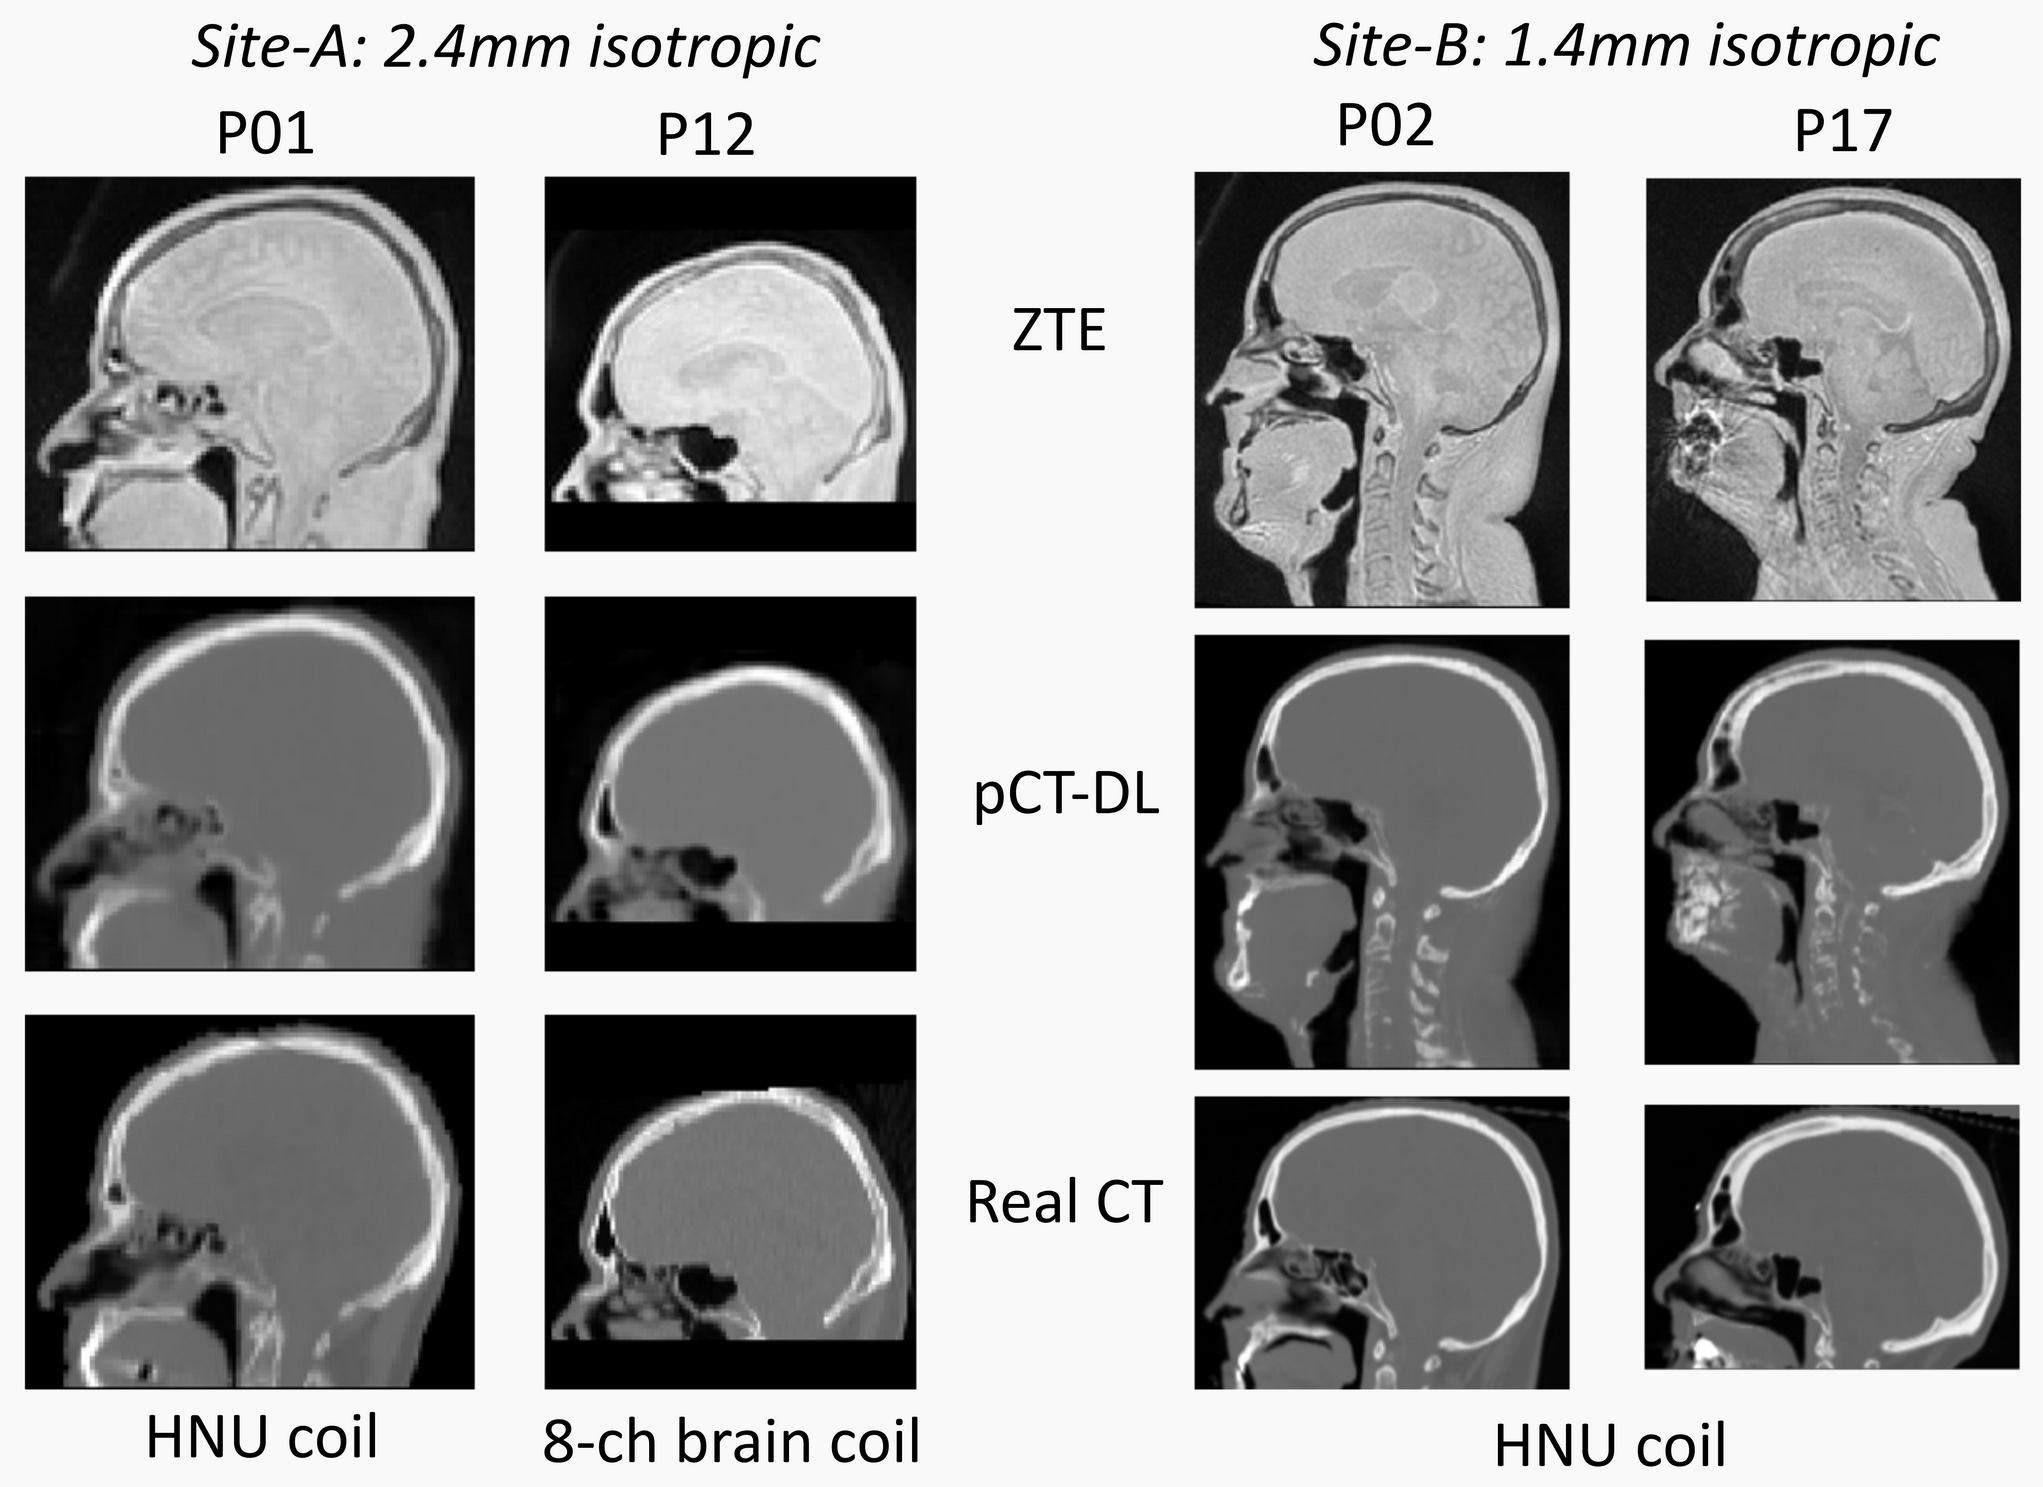
Patient data: MR scans were performed using a 3T, time-of-flight (TOF) Signa PET/MR scanner (GE Healthcare, Chicago, IL, USA). For PET/MR, 17 patients were scanned at site-A using a fast, low-resolution ZTE protocol for head & neck region: 2.4mm isotropic resolution, 41s scan time, GEM head and neck array coil and 8 channel brain coil. For MRgRTP, 18 patients were scanned at site-B at a higher-resolution: 1.4 mm isotropic, 171s, GEM head and neck array coil. Other ZTE parameters were chosen identical: FA=1°, BW=±62.5kHz, FOV=26.4cm. In addition, we have ZTE-MRI data from multiple other sites with protocol similar to site-A (30 cases) and used only for model training purposes. For all patients, accompanying CT scans were available from earlier examinations. All patient studies were approved by respective Institutional Review Boards, including signed informed consent.
ZTE Pre-processing: Intensity correction was performed on ZTE images using ITK N4 algorithm
CT to ZTE-MR registration: CT images were registered to ZTE using a combination of rigid and diffeomorphic dense registration algorithms developed in ITK [3, 4].
Deep learning based pCT computation: A 3D convolutional neural network of the U-net regression architecture to predict pCT from ZTE-MRI across protocols: 8-layers, Adam optimizer, RMSE cost function. This was implemented using Keras and Tensorflow libraries [5, 6]. The model operates on 3D ZTE patches of size 64x64x32, overlap=75%, and predicts a pCT image patch of the same size. Training was performed on 81856 patches from a total of 50 patients (11 site-A, 10 site-B, 29 other sites) with a 90% train -10% validation split. For testing, 6 site-A and 8 site-B cases (30500 patches) were used. Predicted patches were reconstituted back to form the whole pCT volume. Constant tissue value: Since neither of the applications are sensitive to the soft-tissue density variations, the entire soft-tissue (-50 < HU < 200) region in pCT was assigned a value of 42 HU.
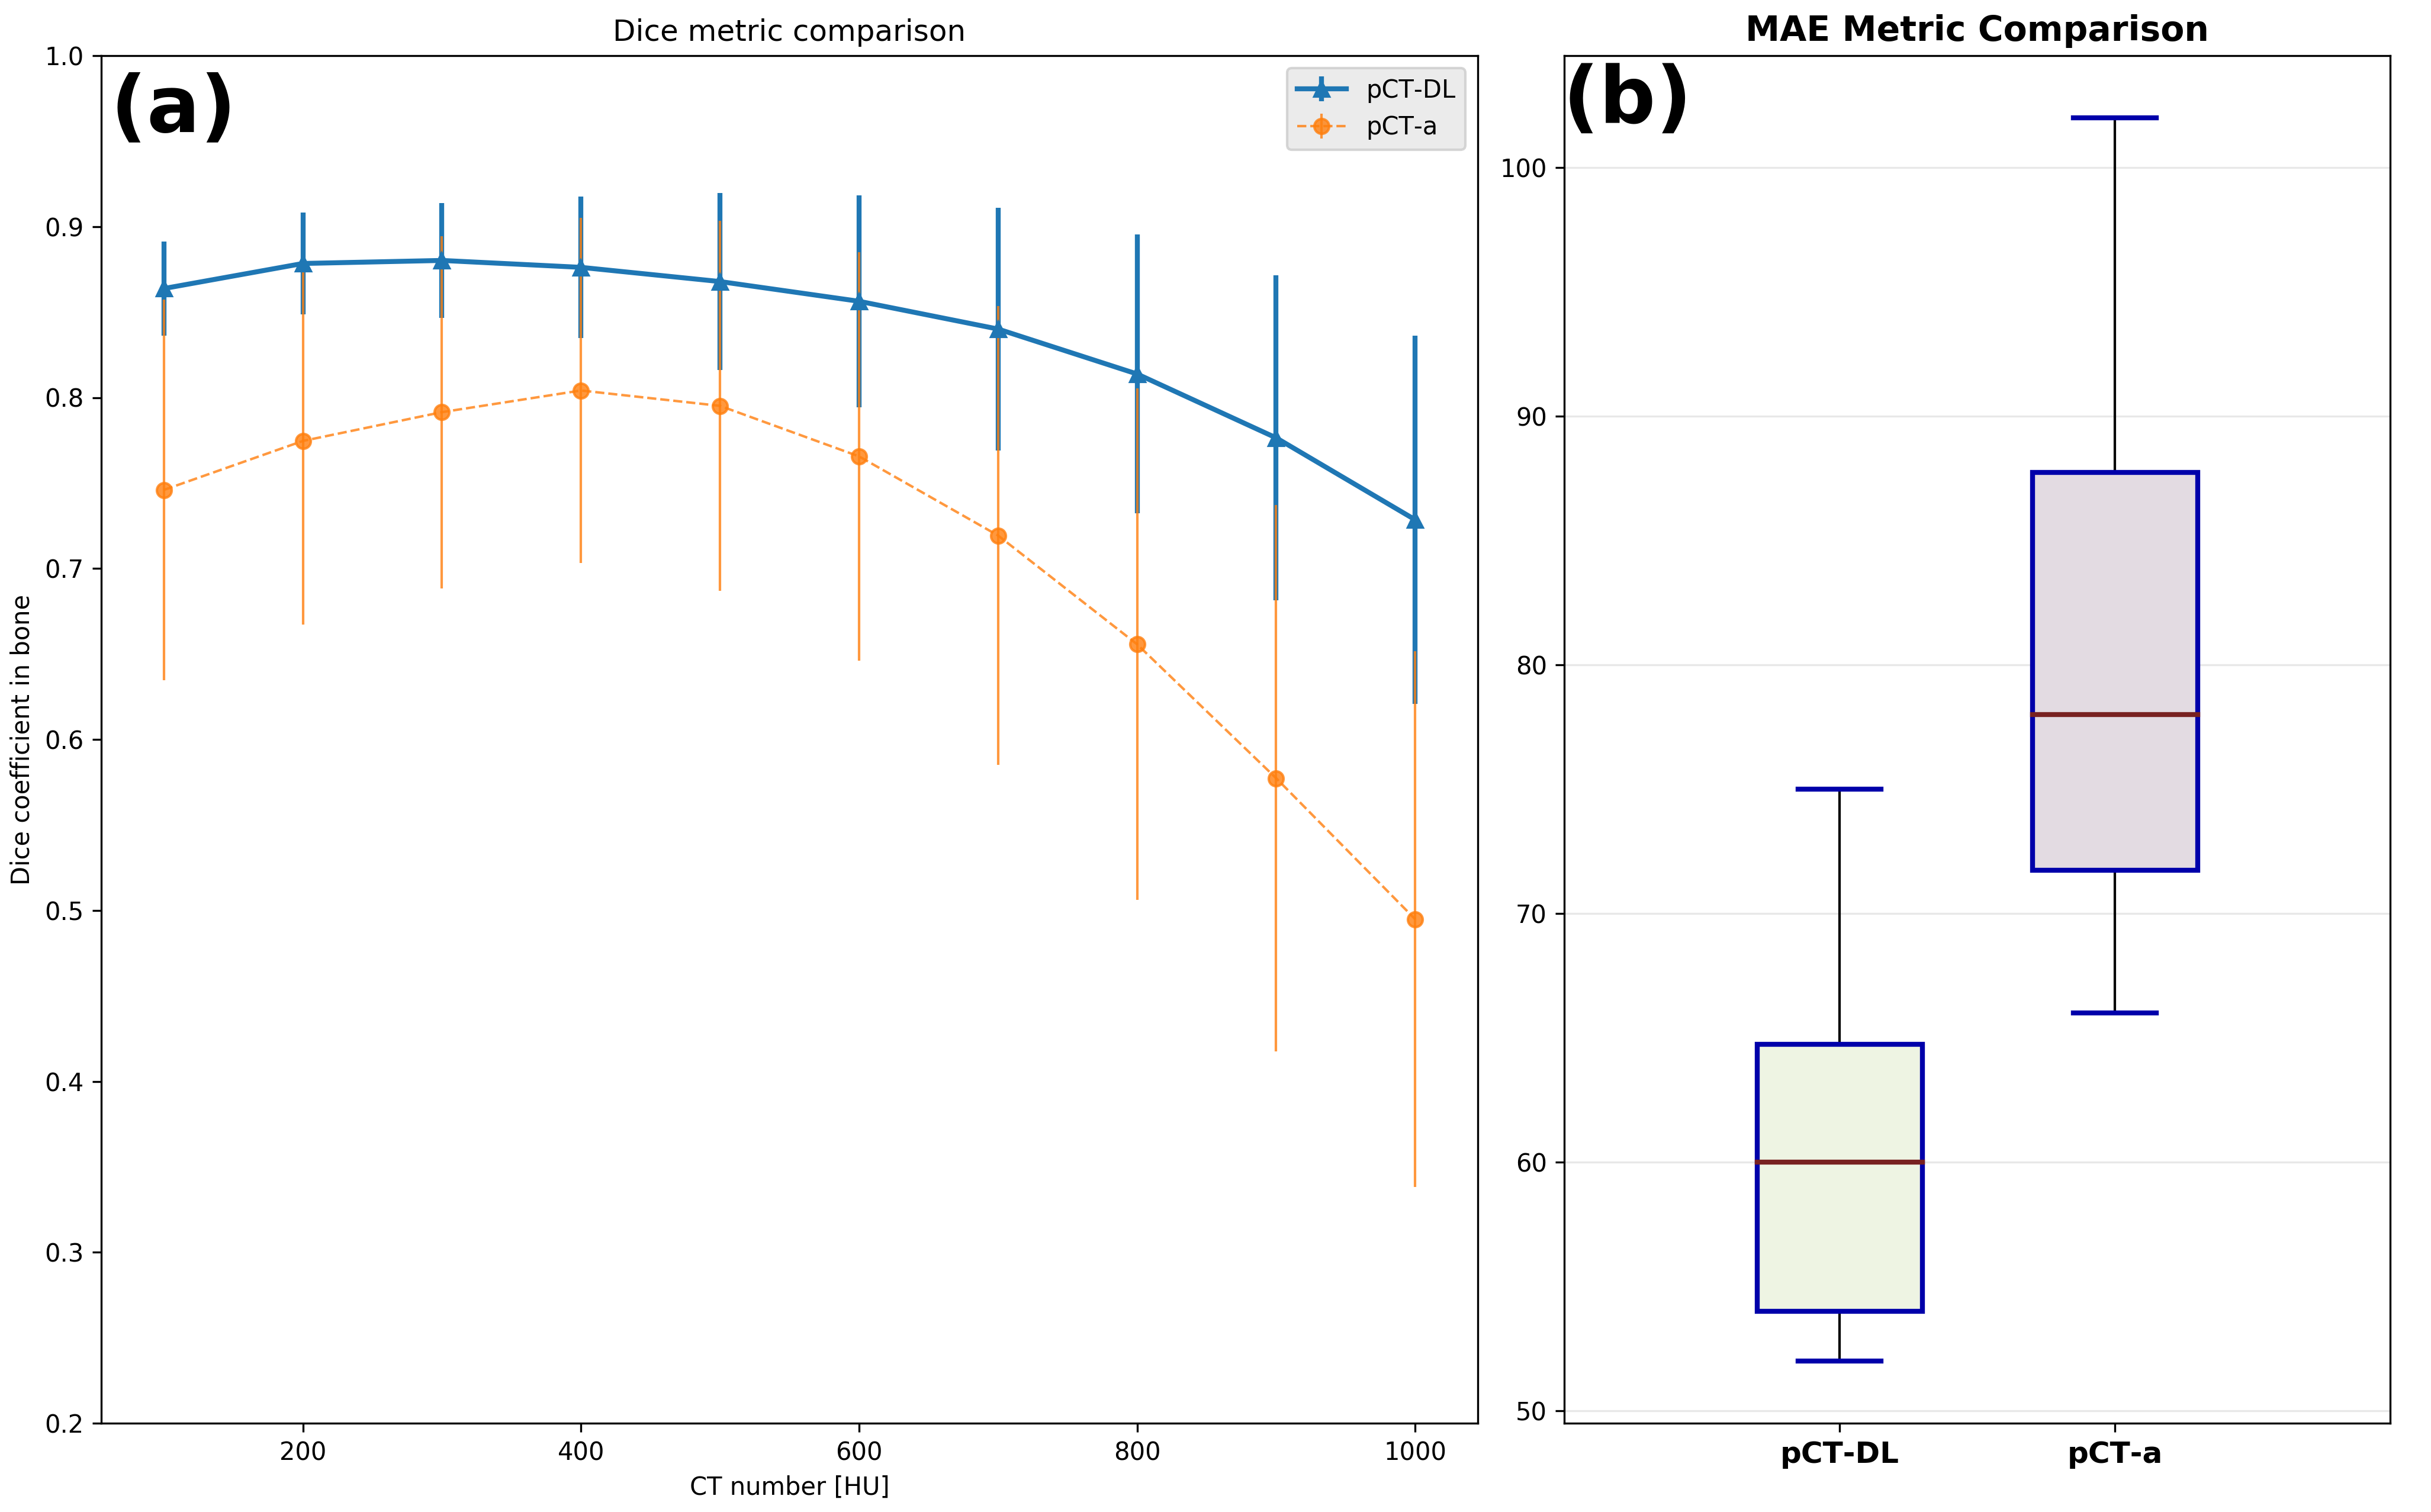
pCT Evaluation: We computed Dice overlap coefficient between CT bone region and DL predicted bone region as well as mean absolute error (MAE) over all tissue in the body as a measure of quantitative accuracy [2].
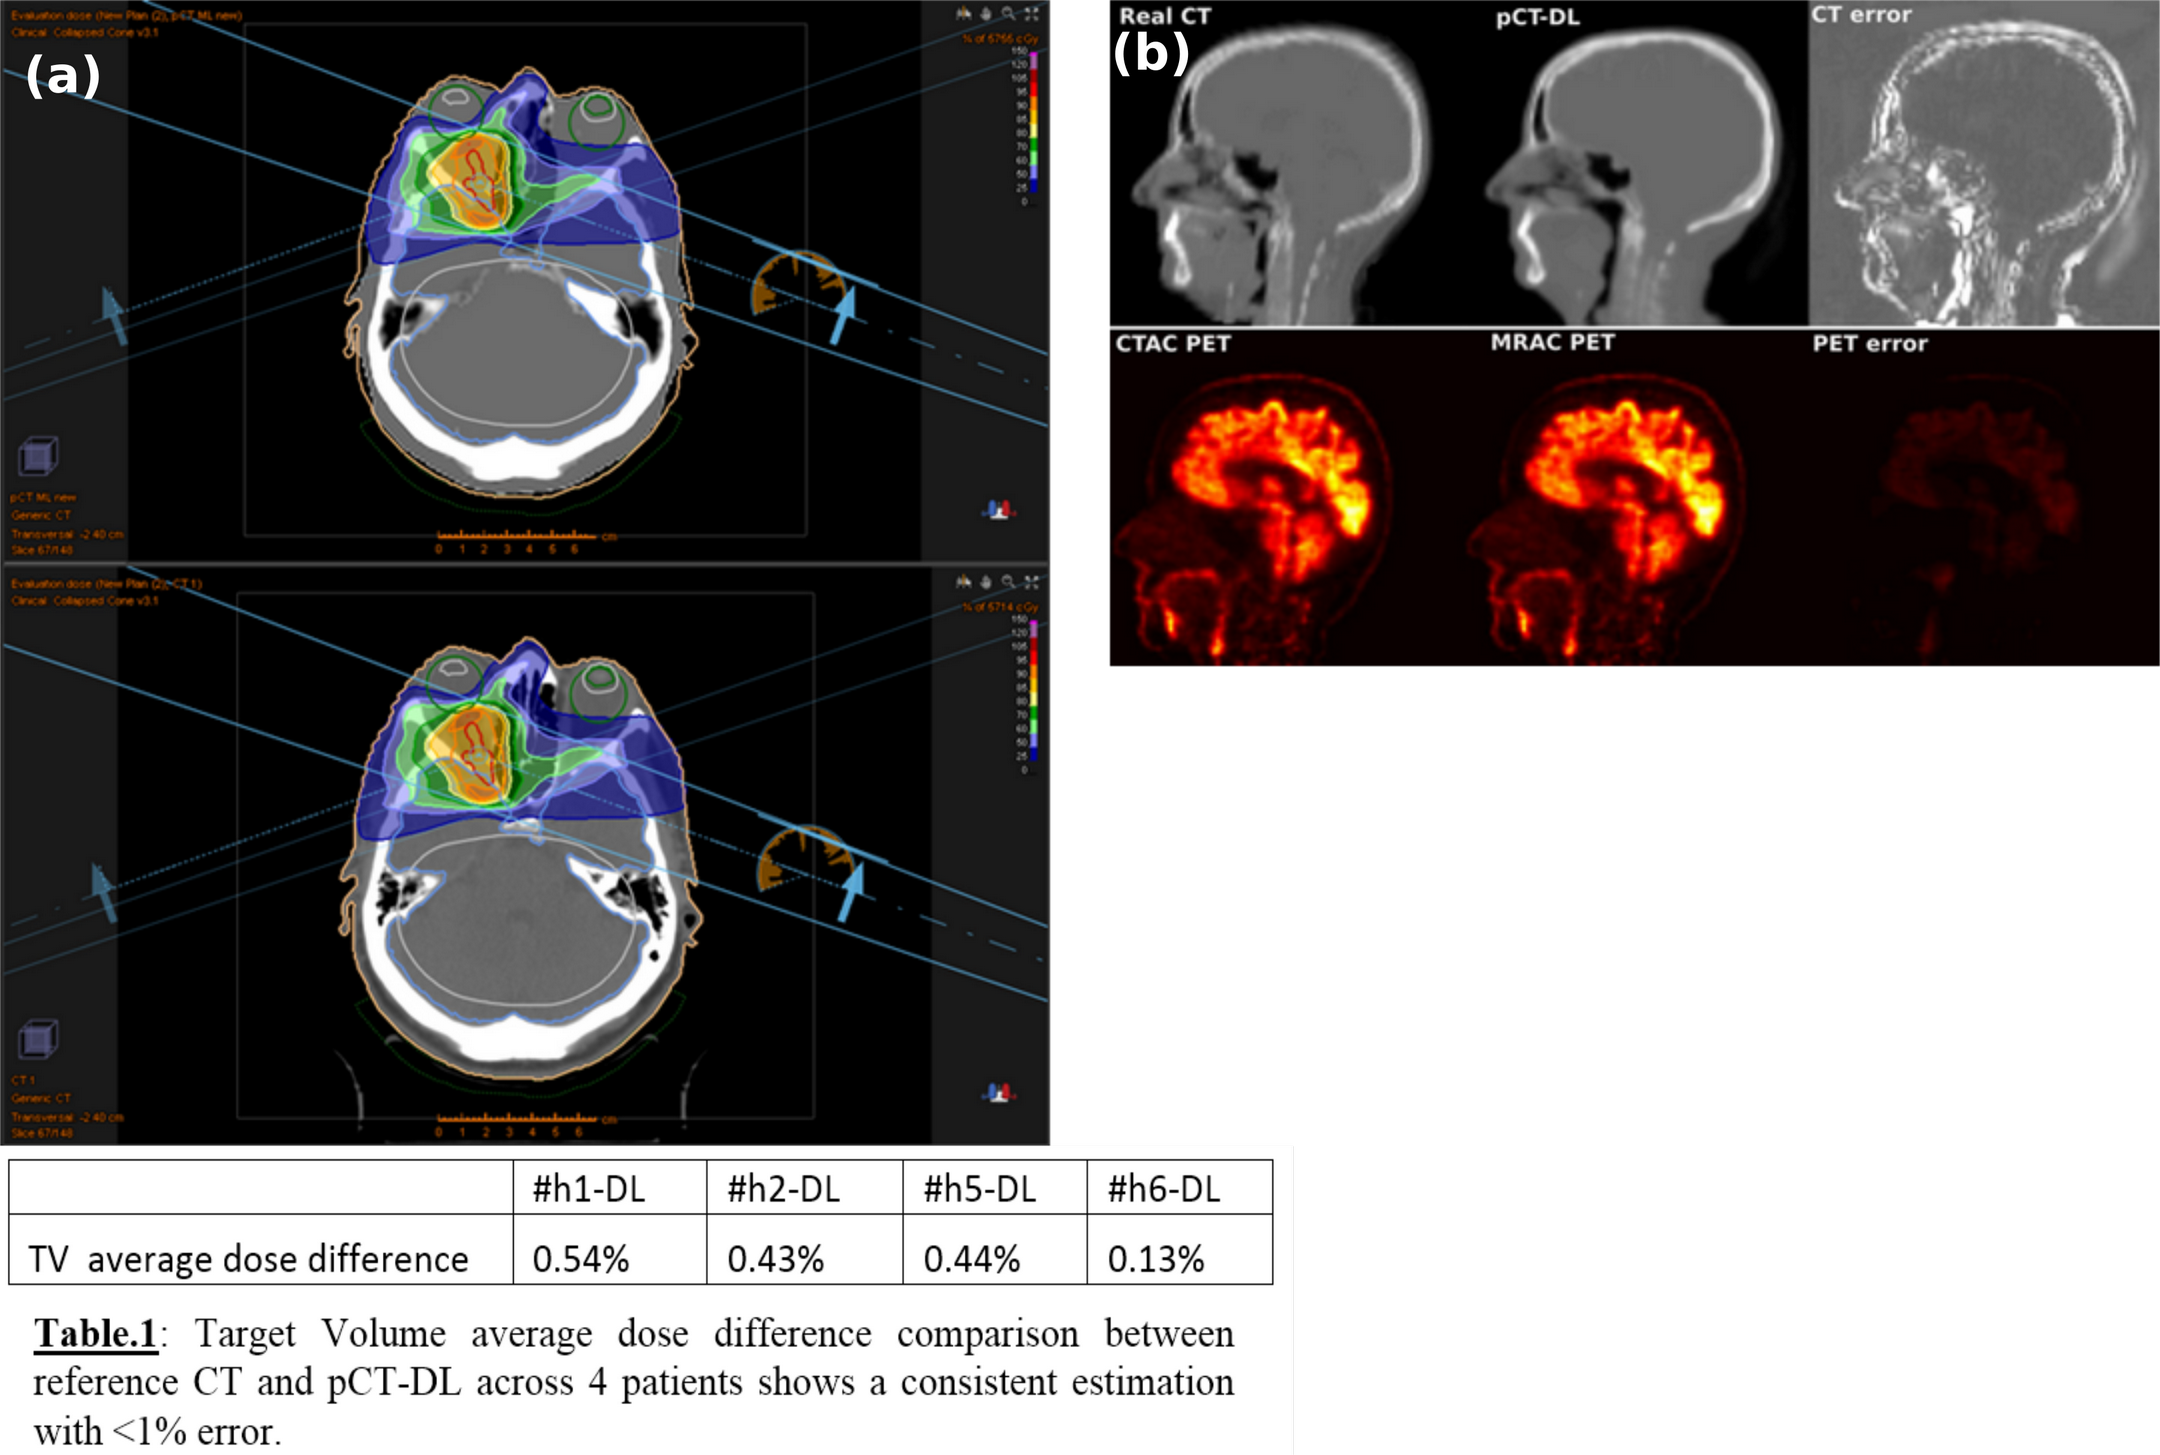
PET-AC Evaluation: PET image reconstruction was performed offline using the petrecon toolbox v1.26 (GE Healthcare, Chicago, IL, USA) and standard parameter settings (2 iterations, 28 subsets, point spread function kernel, 3.0mm full-width at half-maximum (FWHM) in-plane Gaussian filter followed by axial filtering with a three slice 1:4:1 kernel).
Dose evaluation: The pCT datasets were imported into a Radiation Therapy Planning software (RayStation, RaySearch, Sweden). Dose distributions for both evaluated plans were analyzed, and exported from the treatment planning system MICE [8] to perform a gamma analysis over the full volume as defined by the CT scan.
Result & Discussion
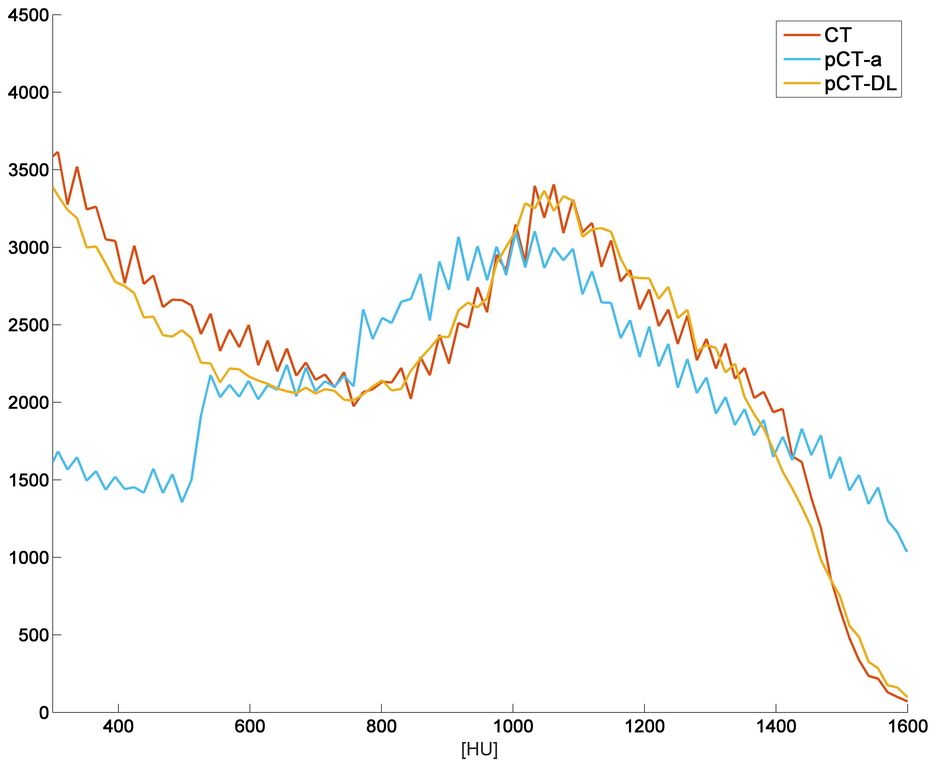
Qualitative comparison with ZTE and real CT suggests that pCT-DL maintained the structural match with ZTE in all regions across protocols, and matched real CT in overlapping regions (Fig.1). Fig.2 demonstrates that using DL based method improves both the Dice overlap and MAE metrics. The comparison of histograms of real CT, pCT-DL, and pCT-a in a typical case (Fig.3) indicates consistent estimation of CT values across tissue densities with pCT-DL as compared to the previous method (pCT-a) which shows significant deviation from real CT. In Table 1 (Fig.4a), the average dose difference between pCT-DL and CT on the Target Volume (TV) is <1% which again indicates the quantitative accuracy of DL based pseudo-CT. In Fig.4, the PET-AC and radiation treatment planning for one patient each from site-A (Fig 4b) and site-B (Fig 4a) respectively are shown as comparison between real CT and pCT-DL utility in target applications.Conclusion
We have presented a generic ZTE only based pseudo-CT generation using deep learning. The advantages include a single model for multiple protocols and coils, pCT which are very much like real CT in appearance, as well as excellent quantitative accuracy of estimated bone values in the computed pCT.Acknowledgements
No acknowledgement found.References
[1]. Mehranian A, et al, Med. Phys. 2016;
[2]. Edmund J.M, et al, Radiat.Oncol. Lond. Engl. 2017
[3]. B.B Avants, et al, Penn Image Computing and Science Laboratory, 2009;
[4]. H. Patel, et al, 36th Ger. Conf. Pattern Recognit. 2014;
[5]. Chollet, F., et al, https://github.com/fchollet/keras;
[6]. Abadi, M., et al, arXiv:1603.04467v2;
[7]. C. Cozzini, et al, ISMRM, 2017;
[8]. T. Nyholm, et al, 3rd ESTRO Forum, 2015
Figures