1252
UTE with Multi-Echo Radial Acquisition for PET/MRI Attenuation Correction1Engineering Physics, Tsinghua University, Beijing, China, 2Gordon Center for Medical Imaging, Radiology, Massachusetts General Hospital, Harvard Medical School, Boston, MA, United States, 3Nuclear Medicine, West China Hospital, Sichuan University, Sichuan, China, 4Key Laboratory of Particle and Radiation Imaging, Ministry of Education, Medical Physics and Engineering Institute, Tsinghua University, Beijing, China
Synopsis
Reliable estimation of PET attenuation coefficient (AC) is a fundamental problem in PET/MR imaging. Accurate measurement of bone density variation is vital to generate reliable subject-specific AC maps using MR. Also, minimizing the data acquisition time of MR sequences for AC is essential to allow more MR scans in a single PET/MR scanning session. In this work, we propose a new acquisition scheme combining UTE and multi-echo radial acquisition to reliably estimate the composition of water,
Introduction
Reliable estimation of PET attenuation coefficient (AC) is a fundamental problem in PET/MR imaging [1-3]. One of the standard MR-based method for generating AC is to segment an MR image volume into different tissue classes (e.g., soft-tissue, fat, bone, and air) and then assign a single AC value to each segment [4-6]. However, this method does not account for intra- and inter-subject variation, which may lead to unacceptable biases especially in areas such as bone [3,7,8]. Thus, accurate measurement of bone density variation is vital to generate reliable subject-specific AC maps [9-13]. Also, minimizing the data acquisition time of MR sequences for AC [14,15] is essential to allow more MR scans in a single PET/MR scanning session. In this work, we propose a new acquisition scheme combining UTE and multi-echo radial acquisition to reliably estimate the composition of water, fat and bone in a minute scan. The performance of the proposed method is verified via an in vivo experiment.Methods
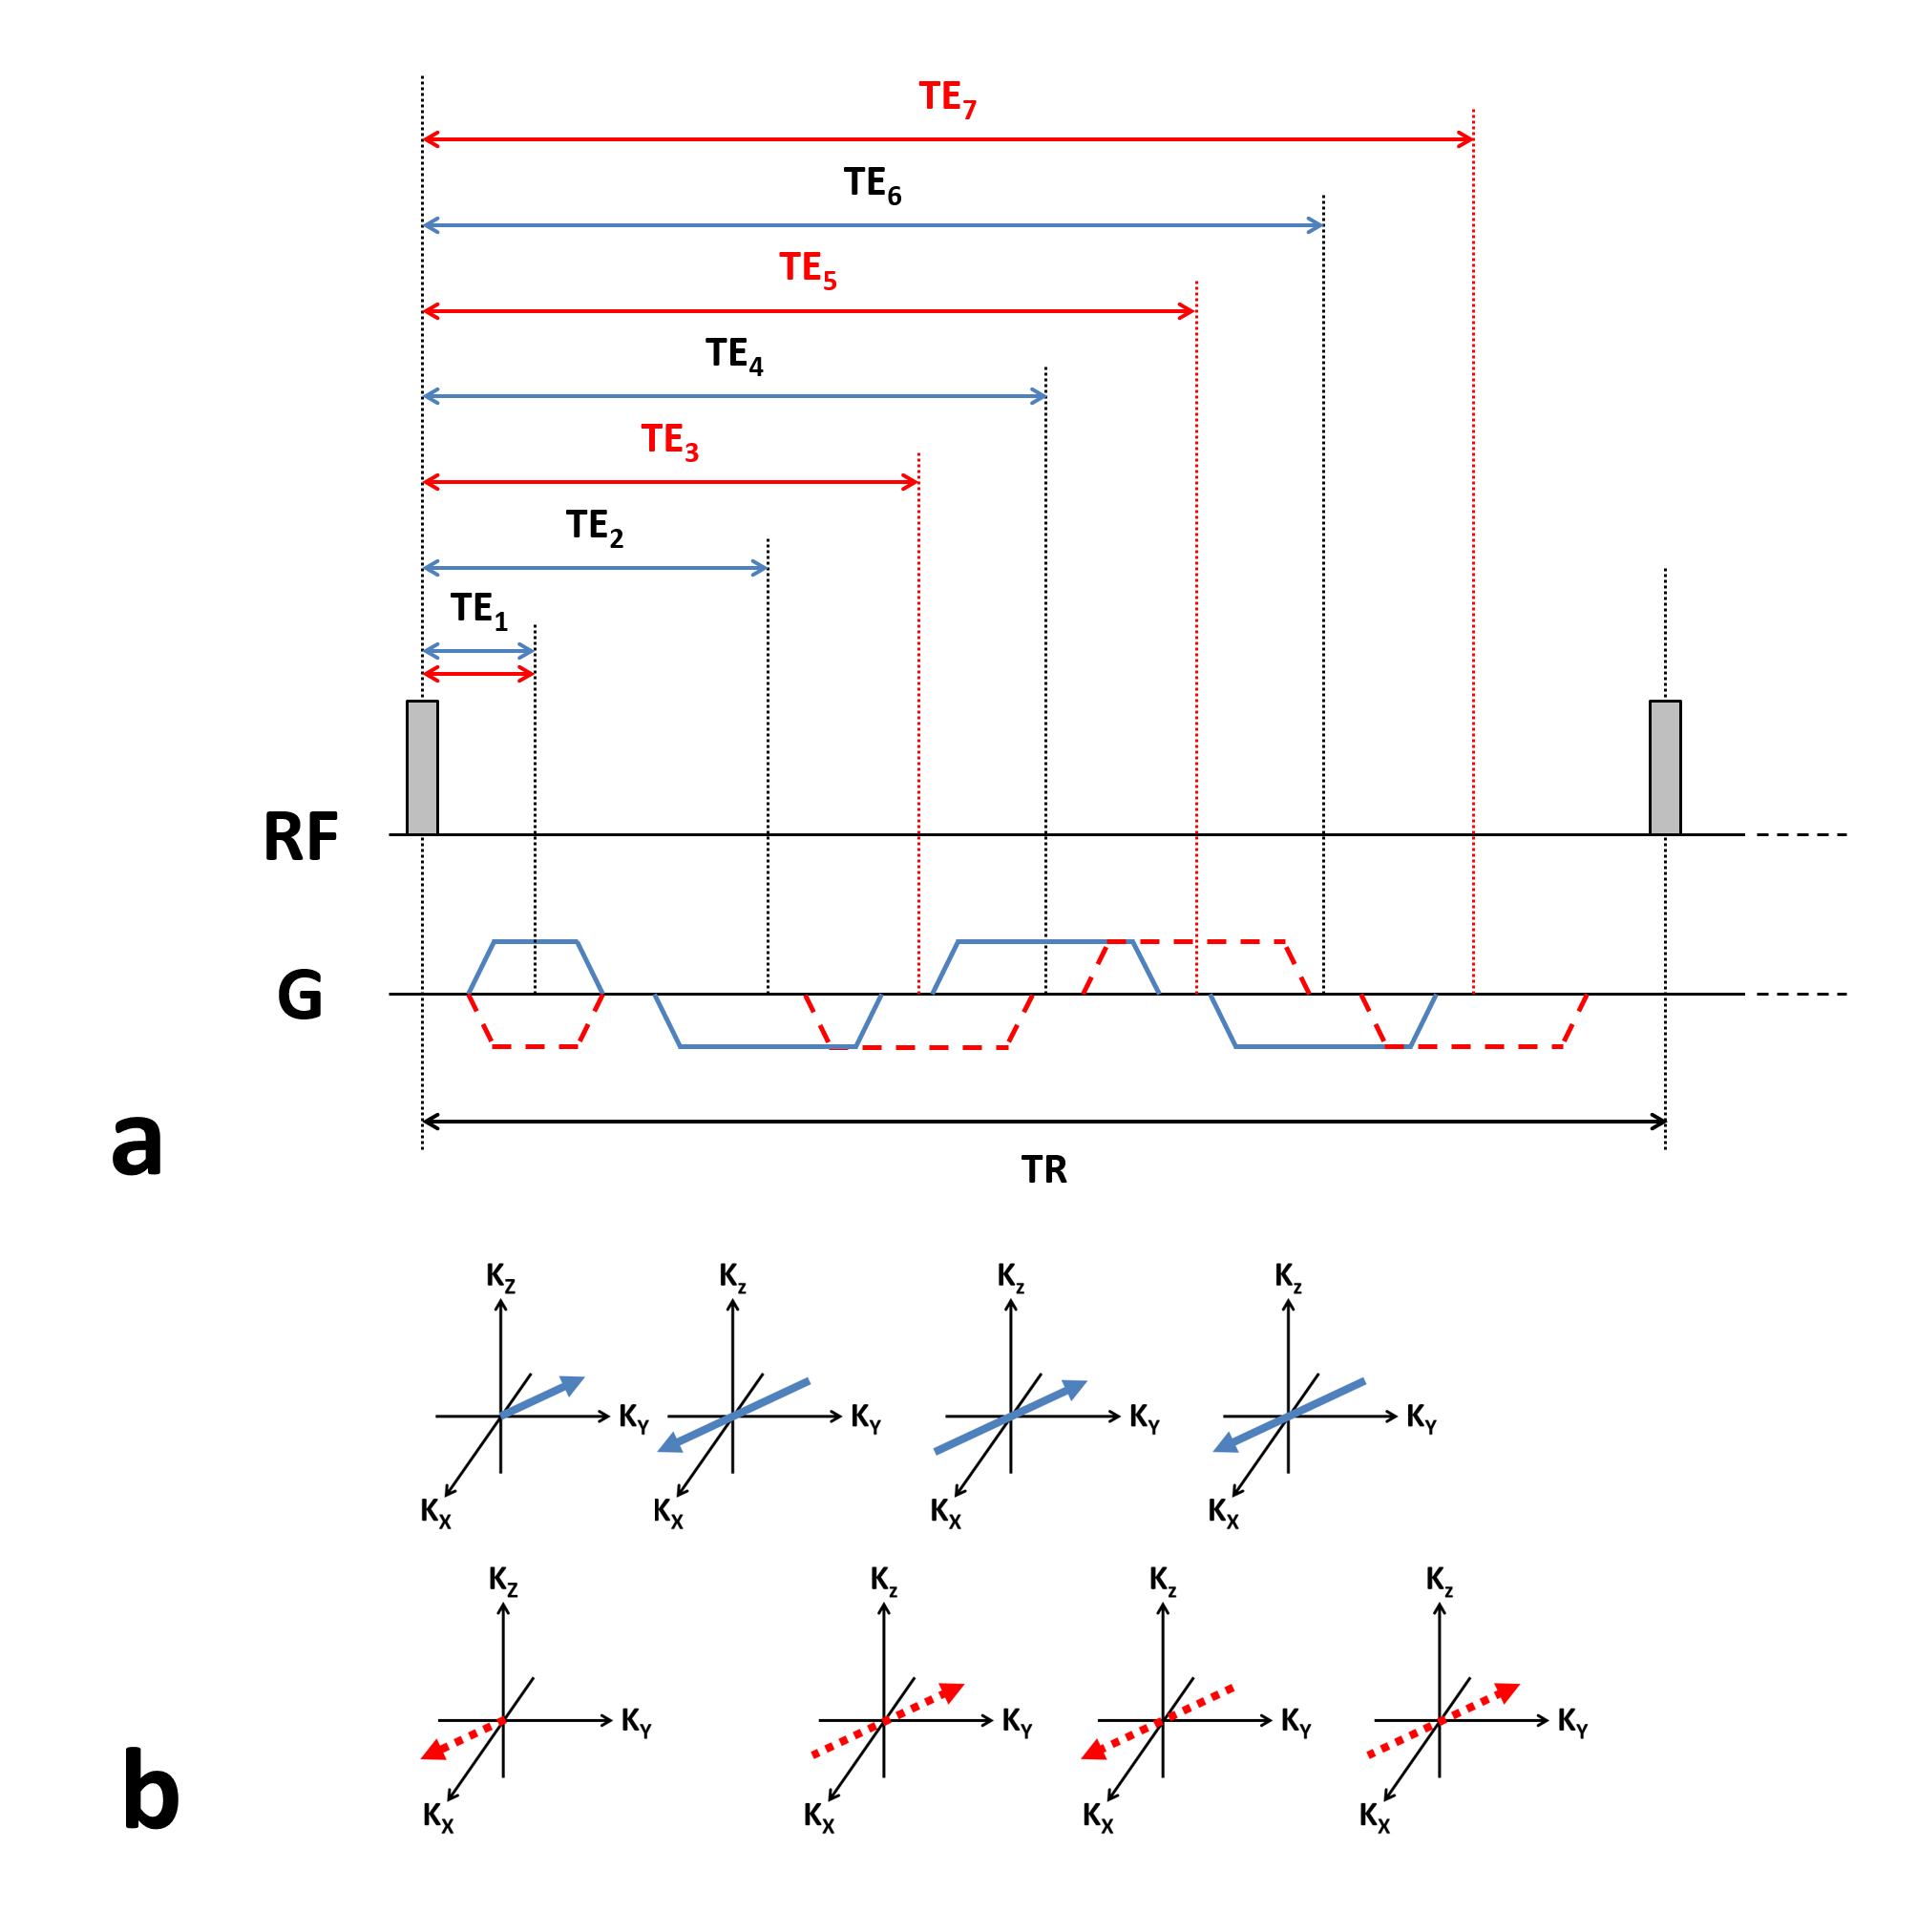
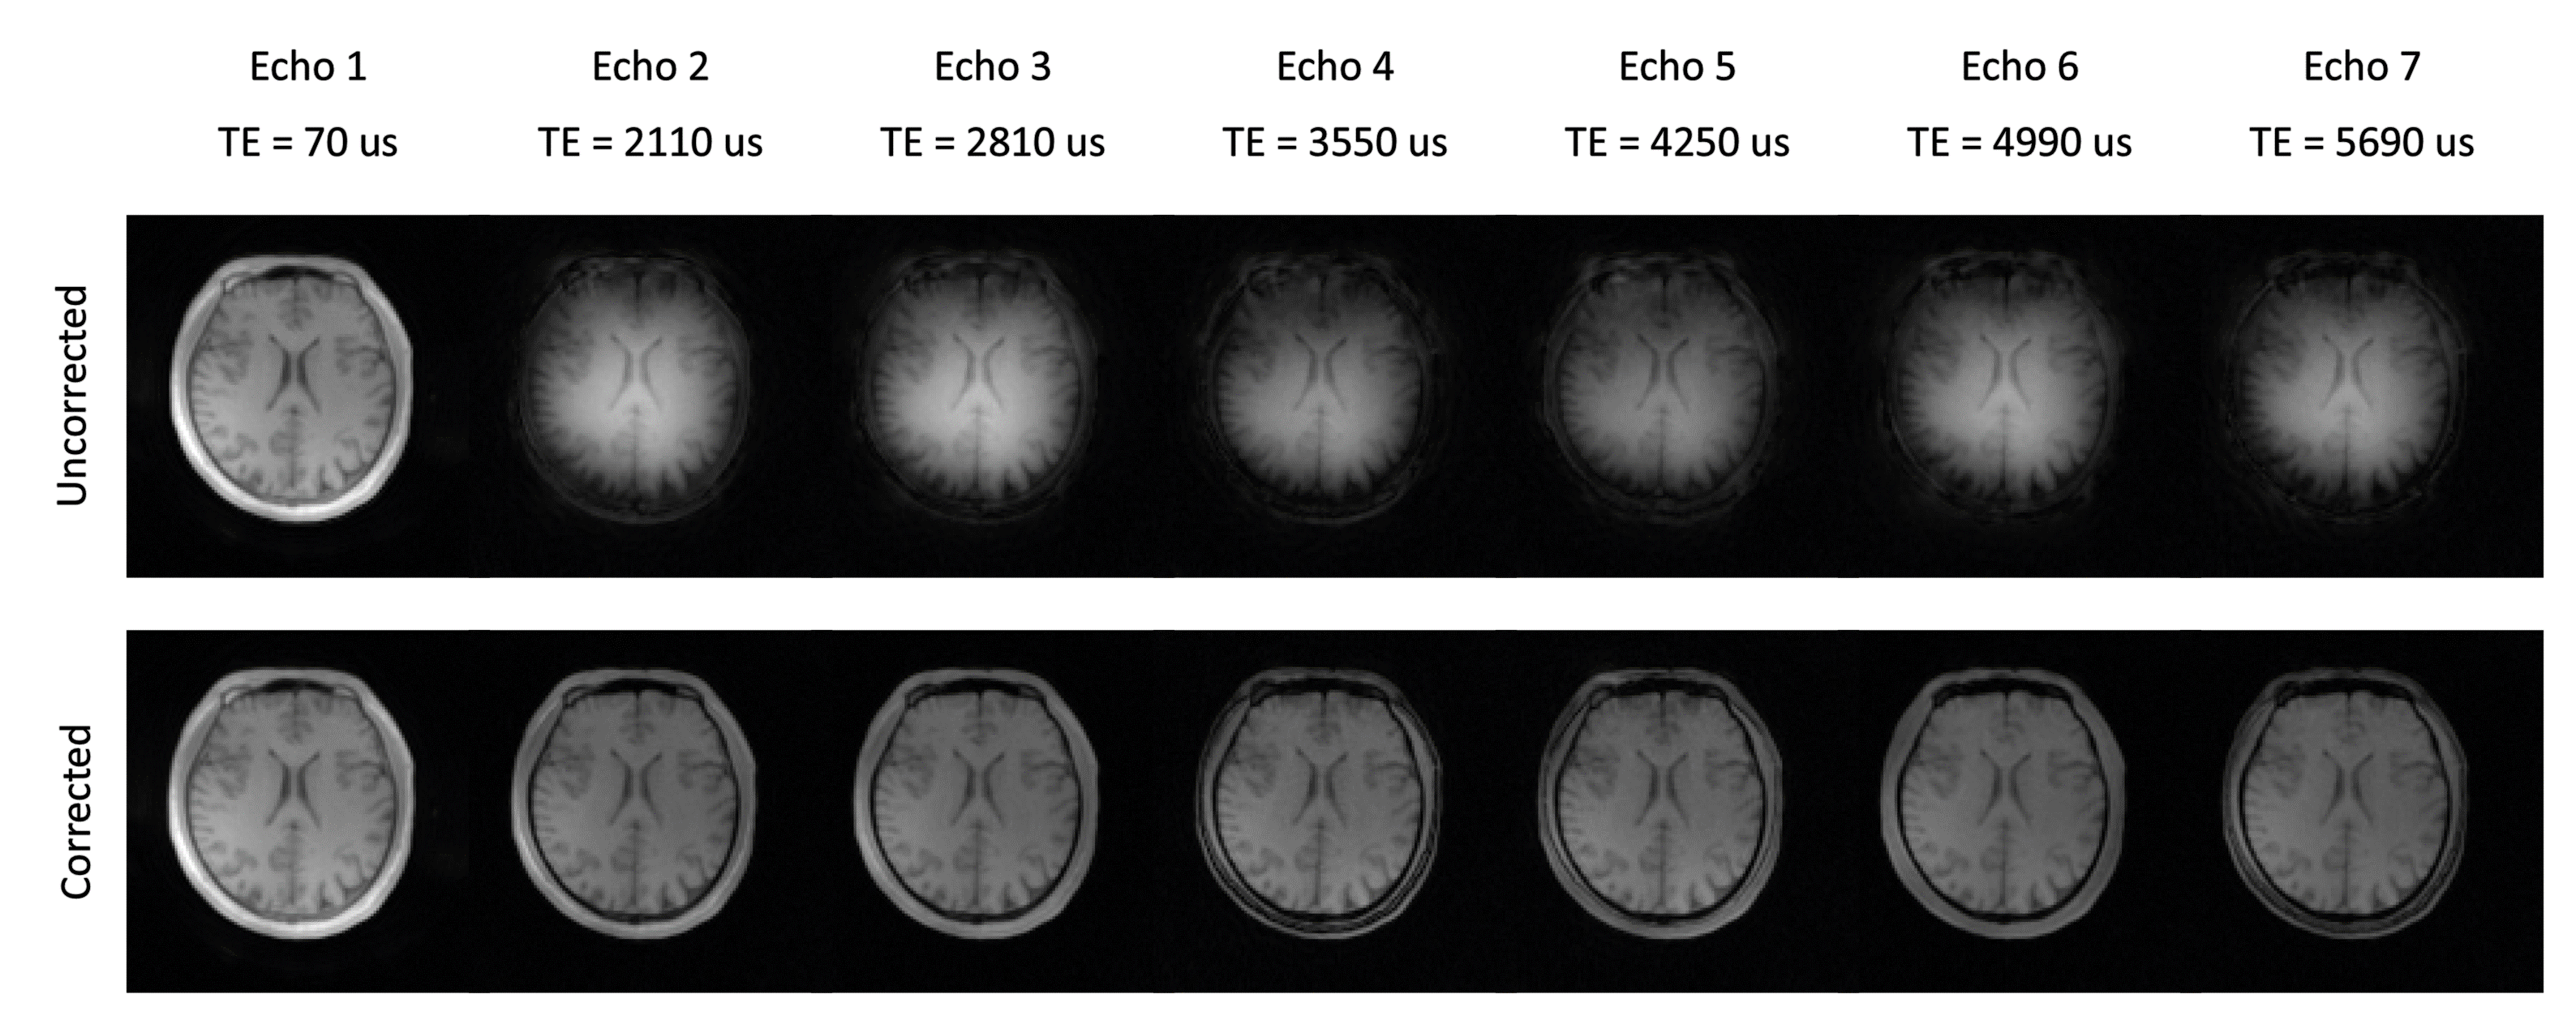
All experiments were performed on a whole-body PET-MR scanner (mMR, Siemens Healthcare, Erlangen, Germany) using head coil for both transmission and signal reception. A healthy volunteer was scanned using the proposed 3D UTE multi-echo radial sequence (Fig.1). The study protocol was approved by our local Institutional Review Board (IRB). The imaging parameters were: field-of-view (FOV) = 240$$$\times$$$240$$$\times$$$240 $$$mm^3$$$, matrix size = 128$$$\times$$$128$$$\times$$$128, TR = 9.9 $$$ms$$$, TE1/TE2/TE3/TE4/TE5/TE6/TE7 = 70/2110/2810/3550/4250/4990/5690 $$$\mu s$$$, hard pulse duration = 100 $$$\mu s$$$, gradient ramp time = 400 $$$\mu s$$$ (gradient slew rate = 48.9 $$$mT/m/ms$$$), plateau gradient amplitude = 19.57 $$$mT/m$$$, dwell time = 2.5 $$$\mu s$$$, number of TR units = 6434 (corresponding to acceleration factor of 8), and total scan time = ~1 $$$min$$$. A separate calibration scan was acquired from a water phantom to correct the k-space trajectory for each echo using a method similarly described previously [16]. Image reconstruction was performed using SENSE reconstruction [17,18] and non-uniform fast Fourier transform (NUFFT) reconstruction [19].
The composition of water and fat signals were jointly estimated as follows [20]:
$$\left\{\hat{\rho}_W,\hat{\rho}_F,\hat{R}_2^*,\triangle\hat{\omega}_0\right\}=arg\min_{\rho_W,\rho_F,R_2^*,\triangle \omega_0} \sum_{q=1}^Q\sum_{p=1}^P\mid I_q(TE_p) - (\rho_{W,q}+\rho_{F,q}\sum_{m=1}^M \alpha_m e^{-i\cdot \omega_m\cdot TE_p})\cdot e^{-TE_p\cdot R_{2,q}^*} \cdot e^{-i\cdot \triangle\omega_{0,q}\cdot TE_p} \mid^2 +\mu\sum_{q=1}^Q V(\rho_{W,q},\rho_{F,q},R_{2,q}^*,\triangle \omega_{0,q})$$
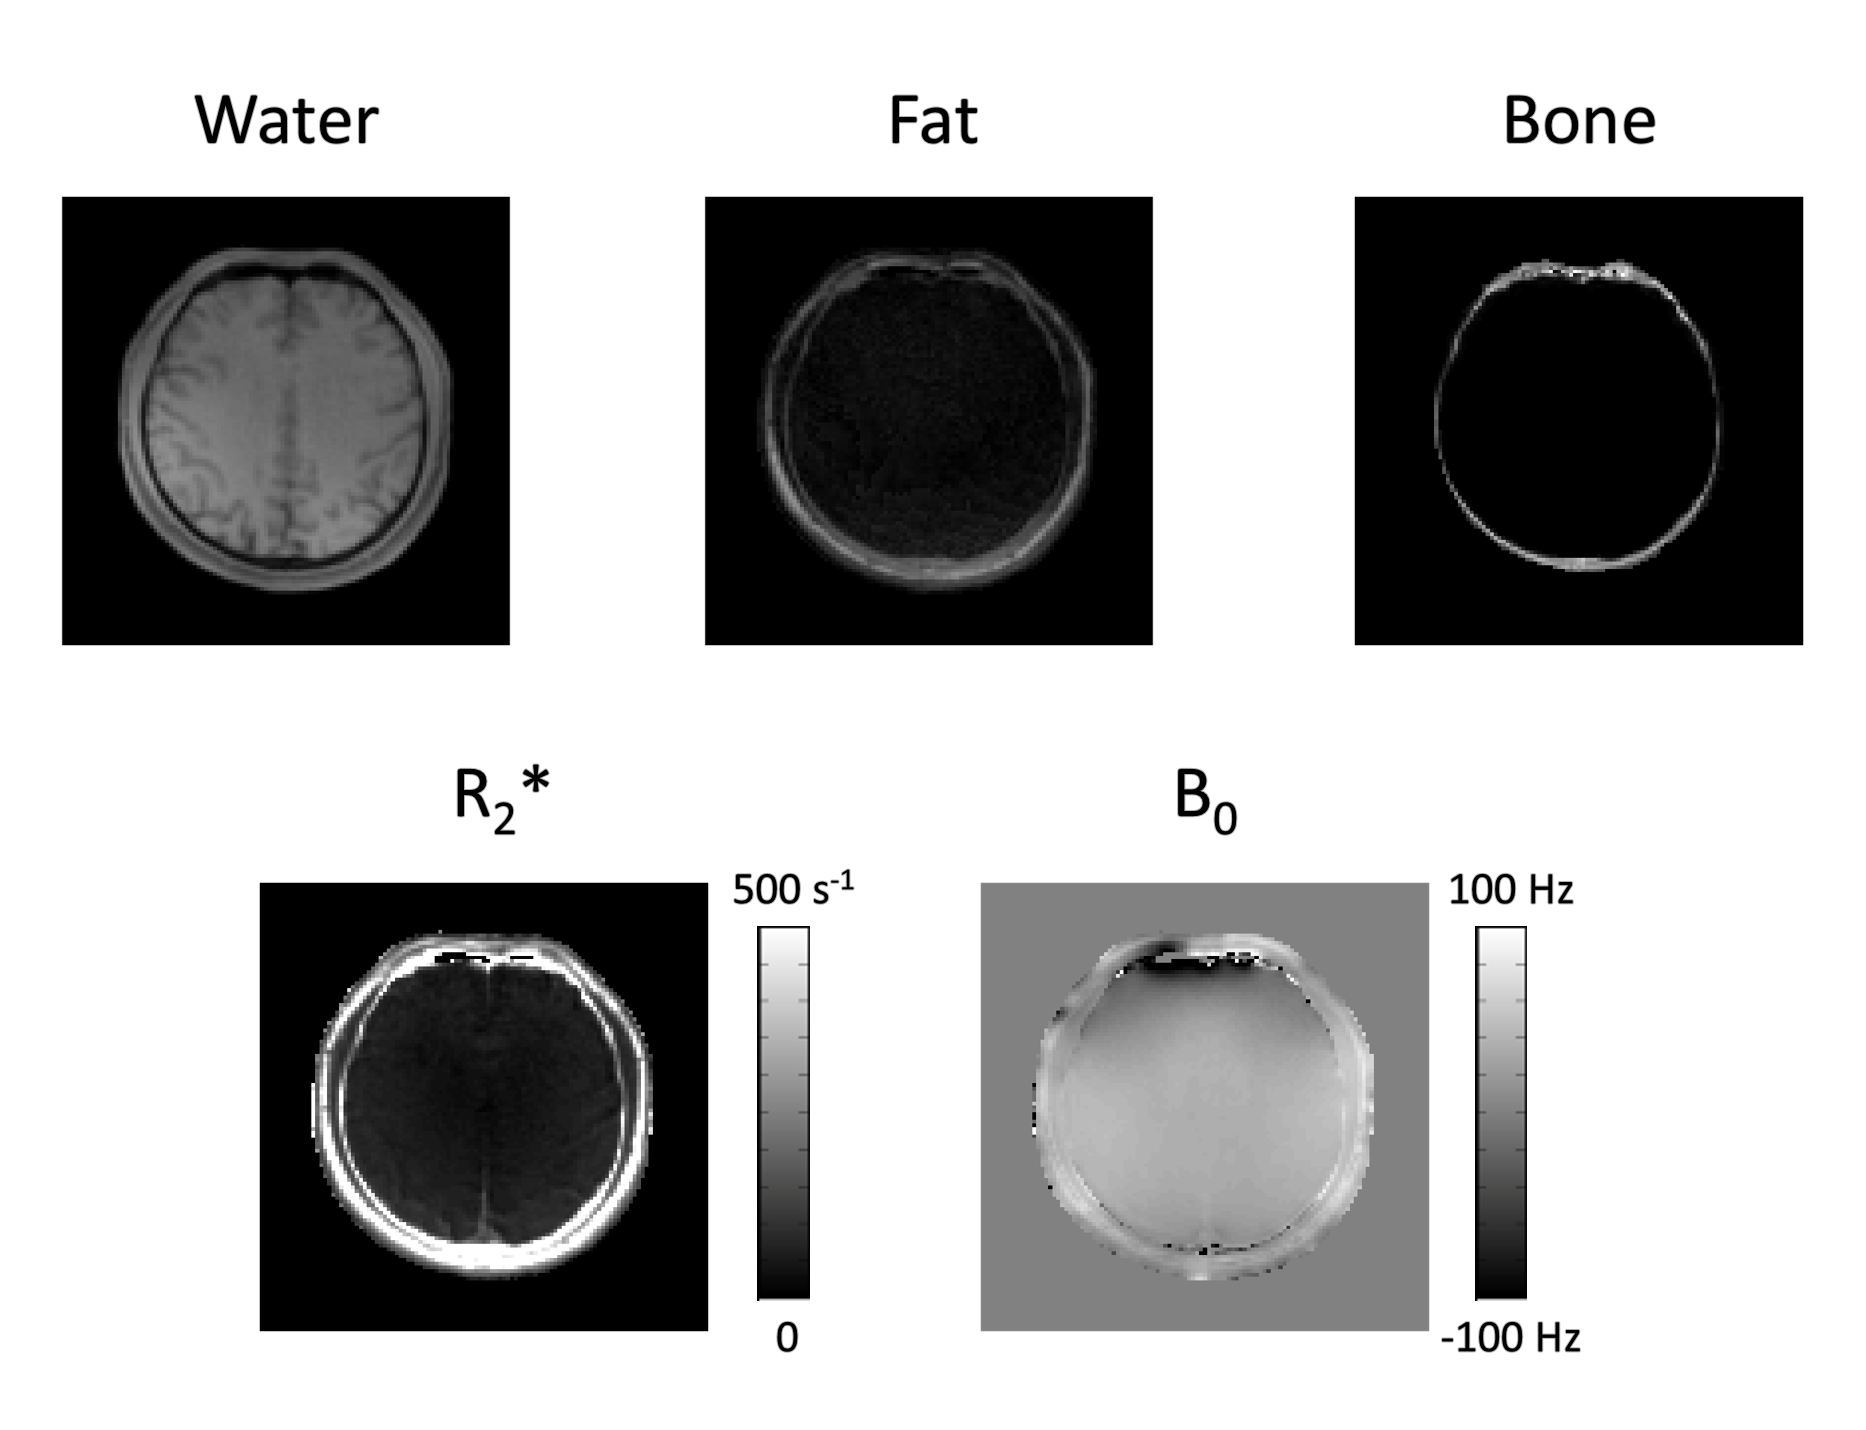
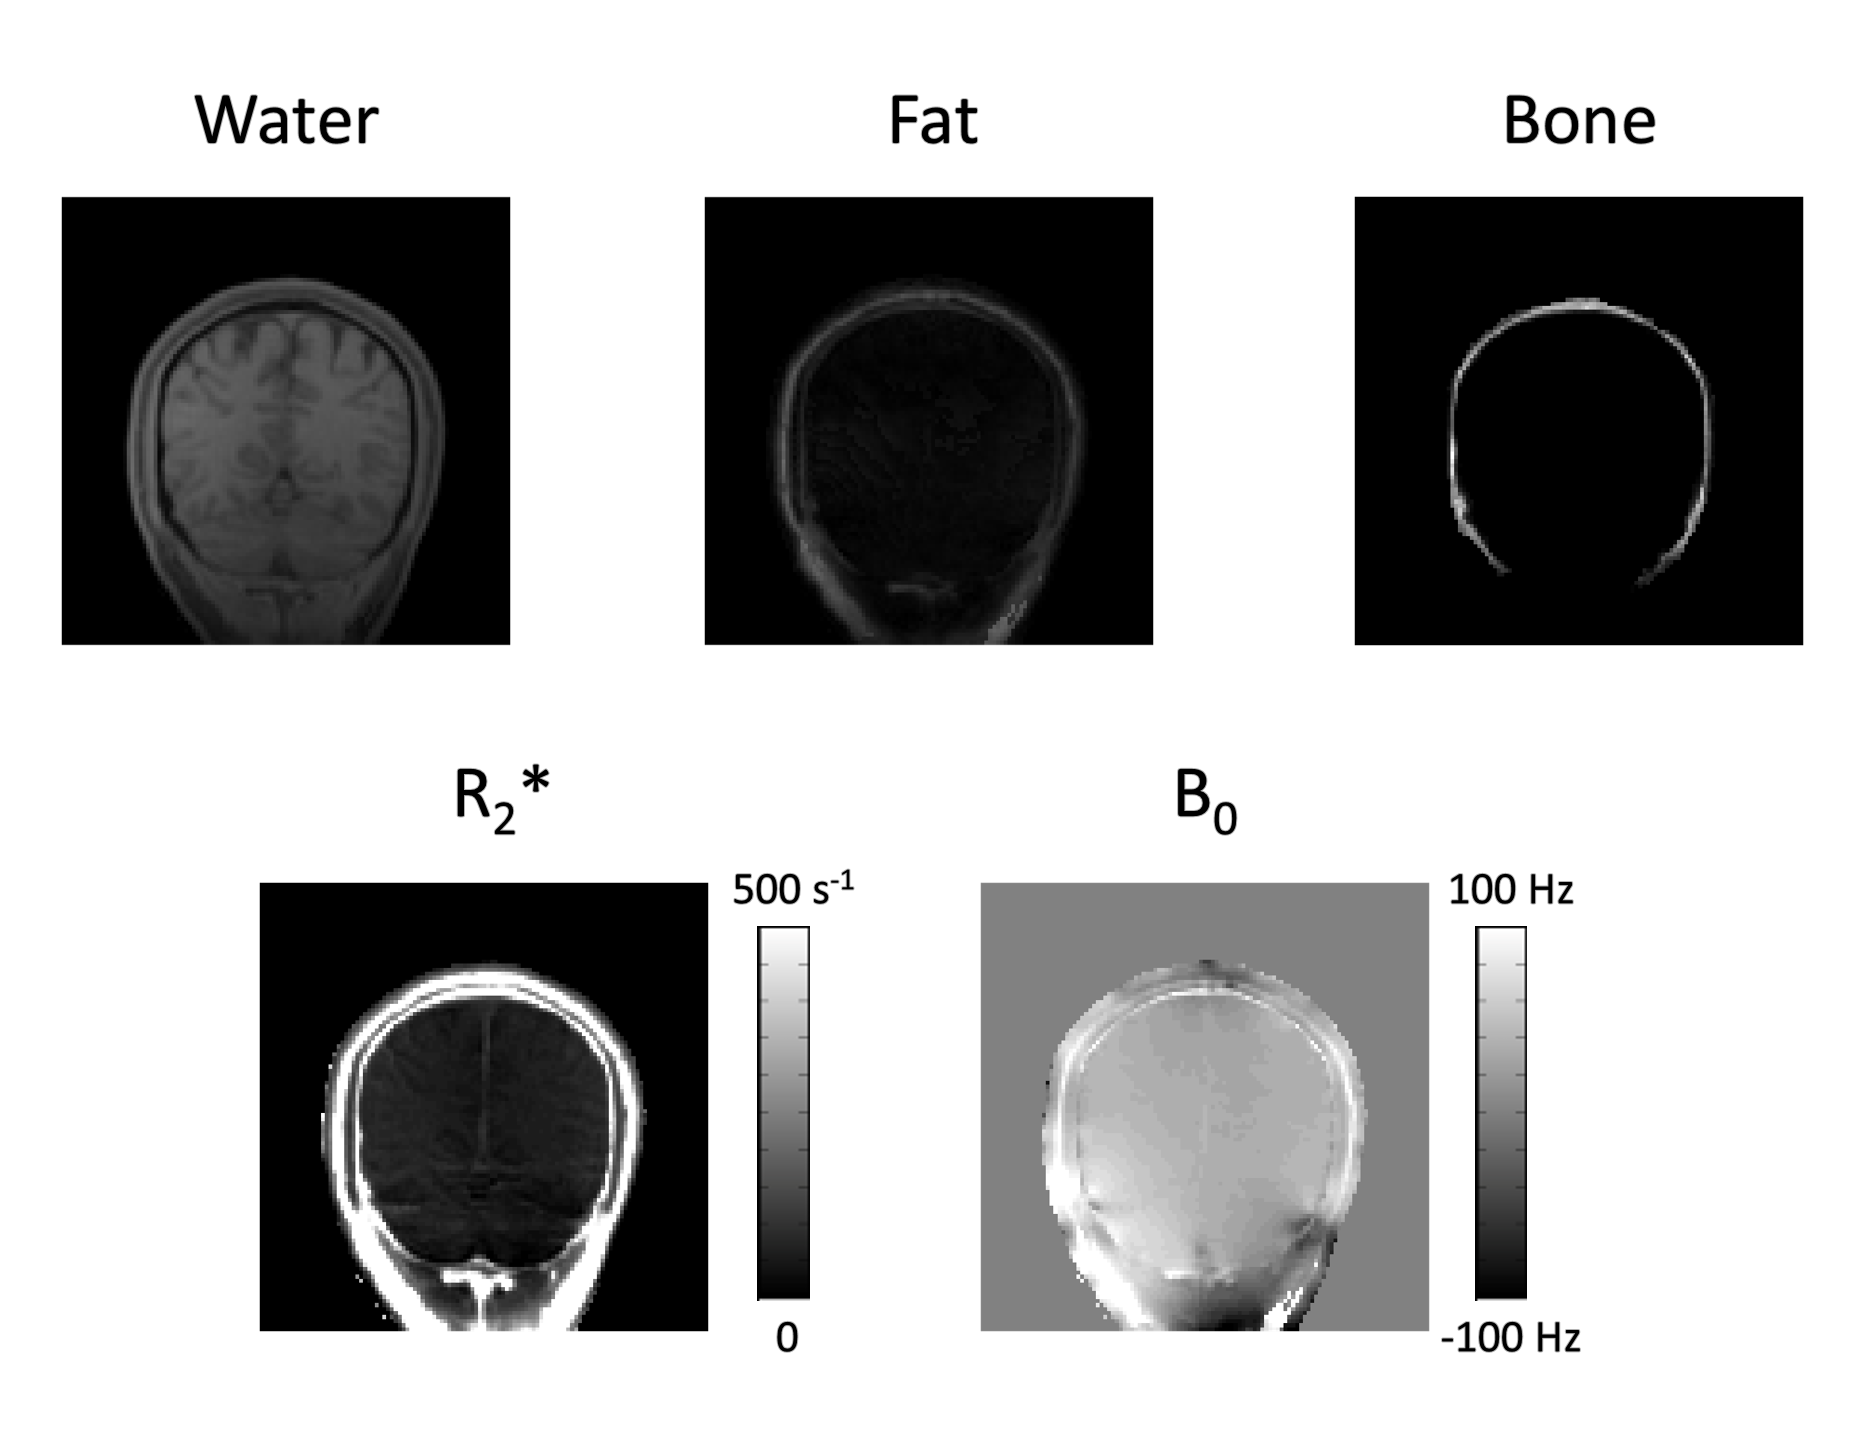
where $$$I_q(TE_p)$$$ denotes the signal at voxel $$$q = 1,…,Q$$$ and echo time $$$p=1,…7$$$, $$$\rho_{W,q}$$$ and $$$\rho_{F,q}$$$ denote the proton density signals from water and fat, respectively, $$$R_{2,q}^*$$$ denotes the single, representative relaxation rate of both water and fat, $$$\alpha_m$$$ and $$$\omega_m$$$ each denote the relative amplitudes (i.e., $$$\sum_{m=1}^M \alpha_m =1$$$) and frequency offsets of an M-peak (i.e., $$$M=6$$$) fat model [21], $$$\triangle\omega_{0,q}$$$ denotes the frequency offset due to magnetic field inhomogeneity ($$$\triangle B_0$$$), $$$\mu$$$ denotes the regularization parameter, and $$$V$$$ denotes a regularization function reflecting prior information. Subsequently, $$$\rho_W$$$ and $$$\rho_F$$$ were compared for image segmentation into water, fat, and bone components.
Results and Discussion
The proposed imaging scheme requires k-space trajectory correction to reliably reconstruct the multi-echo images (Fig.2). Water, fat, bone, R2*, and B0 maps were successfully obtained using the proposed method (Figs. 3-4). The fat images showed high values in the subcutaneous fat and the water images showed high values in the brain parenchyma (Figs. 3-4). Relatively high R2* values were shown for fat and bone regions in the brain (Figs. 3-4). Continuous signal distribution of bone was successfully obtained (Figs. 3-4), indicating potential usage of the proposed method for generating subject-specific AC maps.Conclusion
Continuous signal distribution of bone was successfully obtained, indicating potential usage of the proposed method for generating subject-specific AC maps.Acknowledgements
This work was partially supported by the National Institutes of Health (T32EB013180, R01CA165221, R21EB021710, and P41EB022544), National Natural Science Foundation of China (81471692), and Tsinghua Undergraduate Overseas Research Training Supporting Program (TOP OPEN).References
[1] Keereman, Vincent, et al. "Challenges and current methods for attenuation correction in PET/MR." Magnetic Resonance Materials in Physics, Biology and Medicine 26.1 (2013): 81-98.
[2] Wagenknecht, Gudrun, et al. "MRI for attenuation correction in PET: methods and challenges." Magnetic resonance materials in physics, biology and medicine 26.1 (2013): 99-113.
[3] Ouyang, Jinsong, et al. "Bias atlases for segmentation-based PET attenuation correction using PET-CT and MR." IEEE transactions on nuclear science 60.5 (2013): 3373-3382.
[4] Keereman, Vincent, et al. "MRI-based attenuation correction for PET/MRI using ultrashort echo time sequences." Journal of nuclear medicine 51.5 (2010): 812-818.
[5] Catana, Ciprian, et al. "Toward implementing an MRI-based PET attenuation-correction method for neurologic studies on the MR-PET brain prototype." Journal of Nuclear Medicine 51.9 (2010): 1431-1438.
[6] Berker, Yannick, et al. "MRI-based attenuation correction for hybrid PET/MRI systems: a 4-class tissue segmentation technique using a combined ultrashort-echo-time/Dixon MRI sequence." Journal of nuclear medicine 53.5 (2012): 796-804.
[7] Beyer, Thomas, et al. "MR-based attenuation correction for torso-PET/MR imaging: pitfalls in mapping MR to CT data." European journal of nuclear medicine and molecular imaging35.6 (2008): 1142-1146.
[8] Delso, Gaspar, et al. "Anatomic evaluation of 3-dimensional ultrashort-echo-time bone maps for PET/MR attenuation correction." Journal of Nuclear Medicine 55.5 (2014): 780-785.
[9] Juttukonda, Meher R., et al. "MR-based attenuation correction for PET/MRI neurological studies with continuous-valued attenuation coefficients for bone through a conversion from R2* to CT-Hounsfield units." Neuroimage 112 (2015): 160-168.
[10] Cabello, Jorge, et al. "MR-based attenuation correction using ultrashort-echo-time pulse sequences in dementia patients." Journal of Nuclear Medicine 56.3 (2015): 423-429.
[11] Ladefoged, Claes N., et al. "Region specific optimization of continuous linear attenuation coefficients based on UTE (RESOLUTE): application to PET/MR brain imaging." Physics in medicine and biology 60.20 (2015): 8047.
[12] Sekine, Tetsuro, et al. "Clinical evaluation of zero-echo-time attenuation correction for brain 18F-FDG PET/MRI: comparison with atlas attenuation correction." Journal of Nuclear Medicine57.12 (2016): 1927-1932.
[13] Khalifé, Maya, et al. "Subject-specific bone attenuation correction for brain PET/MR: can ZTE-MRI substitute CT scan accurately?." Physics in Medicine & Biology 62.19 (2017): 7814.
[14] Su, Kuan‐Hao, et al. "Generation of brain pseudo‐CTs using an undersampled, single‐acquisition UTE‐mDixon pulse sequence and unsupervised clustering." Medical physics 42.8 (2015): 4974-4986.
[15] Jang, Hyungseok, et al. "Rapid dual‐echo ramped hybrid encoding MR‐based attenuation correction (dRHE‐MRAC) for PET/MR." Magnetic Resonance in Medicine (2017).
[16] Alley, Marcus T., Gary H. Glover, and Norbert J. Pelc. "Gradient characterization using a Fourier‐transform technique." Magnetic resonance in medicine 39.4 (1998): 581-587.
[17] Pruessmann, Klaas P., et al. "SENSE: sensitivity encoding for fast MRI." Magnetic resonance in medicine 42.5 (1999): 952-962.
[18] Pruessmann, Klaas P., et al. "Advances in sensitivity encoding with arbitrary k‐space trajectories." Magnetic resonance in medicine 46.4 (2001): 638-651.
[19] Fessler, Jeffrey A., and Bradley P. Sutton. "Nonuniform fast Fourier transforms using min-max interpolation." IEEE Transactions on Signal Processing 51.2 (2003): 560-574.
[20] Hernando, Diego, et al. "Robust water/fat separation in the presence of large field inhomogeneities using a graph cut algorithm." Magnetic resonance in medicine 63.1 (2010): 79-90.
[21] Hernando, Diego, Zhi‐Pei Liang, and Peter Kellman. "Chemical shift–based water/fat separation: a comparison of signal models." Magnetic resonance in medicine 64.3 (2010): 811-822.
Figures