1251
ZTE MRI for attenuation correction in PET/MR: performance in a large cohort of cognitive disorder patients1Centre de NeuroImagerie de Recherche (CENIR), Institut du Cerveau et de la Moelle Epinière (ICM), Paris, France, 2Department of Nuclear Medicine, Groupe Hospitalier Pitié-Salpêtrière C. Foix, Paris, France, 3Laboratoire d’Imagerie Biomédicale, Sorbonne Universités, UPMC Univ Paris 06, Inserm U 1146, CNRS UMR 7371, Paris, France, 4Applications and Workflow, GE Healthcare, Orsay, France, 5Applications and Workflow, GE Healthcare, Cambridge, United Kingdom
Synopsis
Several attenuation correction (AC) methods based on Zero Echo Time (ZTE) MRI are available in brain PET/MR. However, most of them were evaluated in healthy subjects or in patients without apparent brain disease. In this work, we investigated ZTE-AC in a 50-patient cohort imaged for cognitive disorders and we compared its performance with default atlas-AC and reference CT-based AC. The impact of the two AC methods (ZTE-AC and atlas-AC) was evaluated and compared to reference CT-AC, using a Volume of Interest (VOI) analysis and voxelwise group comparison between patients with normal cortical metabolism vs. metabolic pattern suggestive of Alzheimer’s disease.
Introduction
PET/MRI is becoming increasingly available for clinical use. This modality combining structural and functional imaging is of high interest for neurodegenerative disease screening. Nevertheless, as tissue attenuation measurement is not available with MRI, attenuation correction (AC) has been achieved so far using a head CT template. A newer method based on ZTE MRI and its ability to measure bone signal has been suggested as subject-specific method to be used for brain AC. ZTE-AC has been validated in small groups of patients with no apparent pathology in the brain.1,2,3 However, its impact on PET quantification and diagnosis for patients with neurological diseases has not been demonstrated. In this work, we aim to evaluate ZTE-AC and atlas-AC on a cohort of 50 patients referred for cognitive disorders by comparing it to CT-AC as reference.Methods
50 patients (mean age 70±11; 23 men) underwent 18F-FDG PET-MR scan (GE SIGNA, PET/MR, Waukesha, USA) in the context of neurocognitive disorders investigation. All patients had a brain CT scan without iodinated contrast agent injection (time interval between CT and PET/MR 16±25 months). Among the 50 patients, 22 had a metabolic pattern suggestive of Alzheimer’s disease (AD) (mean age 73±8.1; 12 men) and 15 patients had a normal PET scan (mean age 67±16.1; 9 men). A two-point LAVA-Flex (pixel size 1.95 x 1.95 mm2, 120 slices, slice thickness 5.2 mm with 2.6 mm overlap) used for atlas-AC map generation as well as a ZTE (3D radial acquisition, voxel size 2.4 x 2.4 x 2.4 mm3, FOV 26.4 x 26.4 cm2, flip angle 0.8°, bandwidth ±62.5 kHz) were acquired during the PET acquisition. Three AC maps were used for PET image reconstructions for each patient:
- PETATLAS with atlas-AC: the default method, uses LAVA-Flex in-phase image to register CT template in patient space,
- PETZTE with ZTE-AC: AC map generated by segmenting ZTE MRI into 3 segments (bone, soft tissue and air) and scaling bone intensity into CT intensity in Hounsfield Units (HU),2
- PETCT with CT-AC: measured CT used as reference AC map.
A VOI analysis using the AAL atlas (90 VOIs) in SPM12 was done to assess the SUVr relative difference between PETATLAS, PETZTE and PETCT. Furthermore, we performed voxel-based analysis with SPM12 between PETATLAS, PETZTE and PETCT images using paired t-test (PETATLAS/ZTE>PETCT and PETATLAS/ZTE<PETCT) with a height threshold set at p<0.001 corrected with cluster-wise family-wise error (FWE) method to evaluate the impact of each AC on cortex metabolism. In addition, we performed voxel-based comparisons between patients with normal PET images (n=15) vs. patients with PET images suggestive of AD (n=22) using consecutively PETATLAS, PETZTE and PETCT images. The SPM t-maps yielded by the three AC were subsequently compared. Considering the small sample size, the height threshold was lowered to p<0.001 uncorrected.
Results
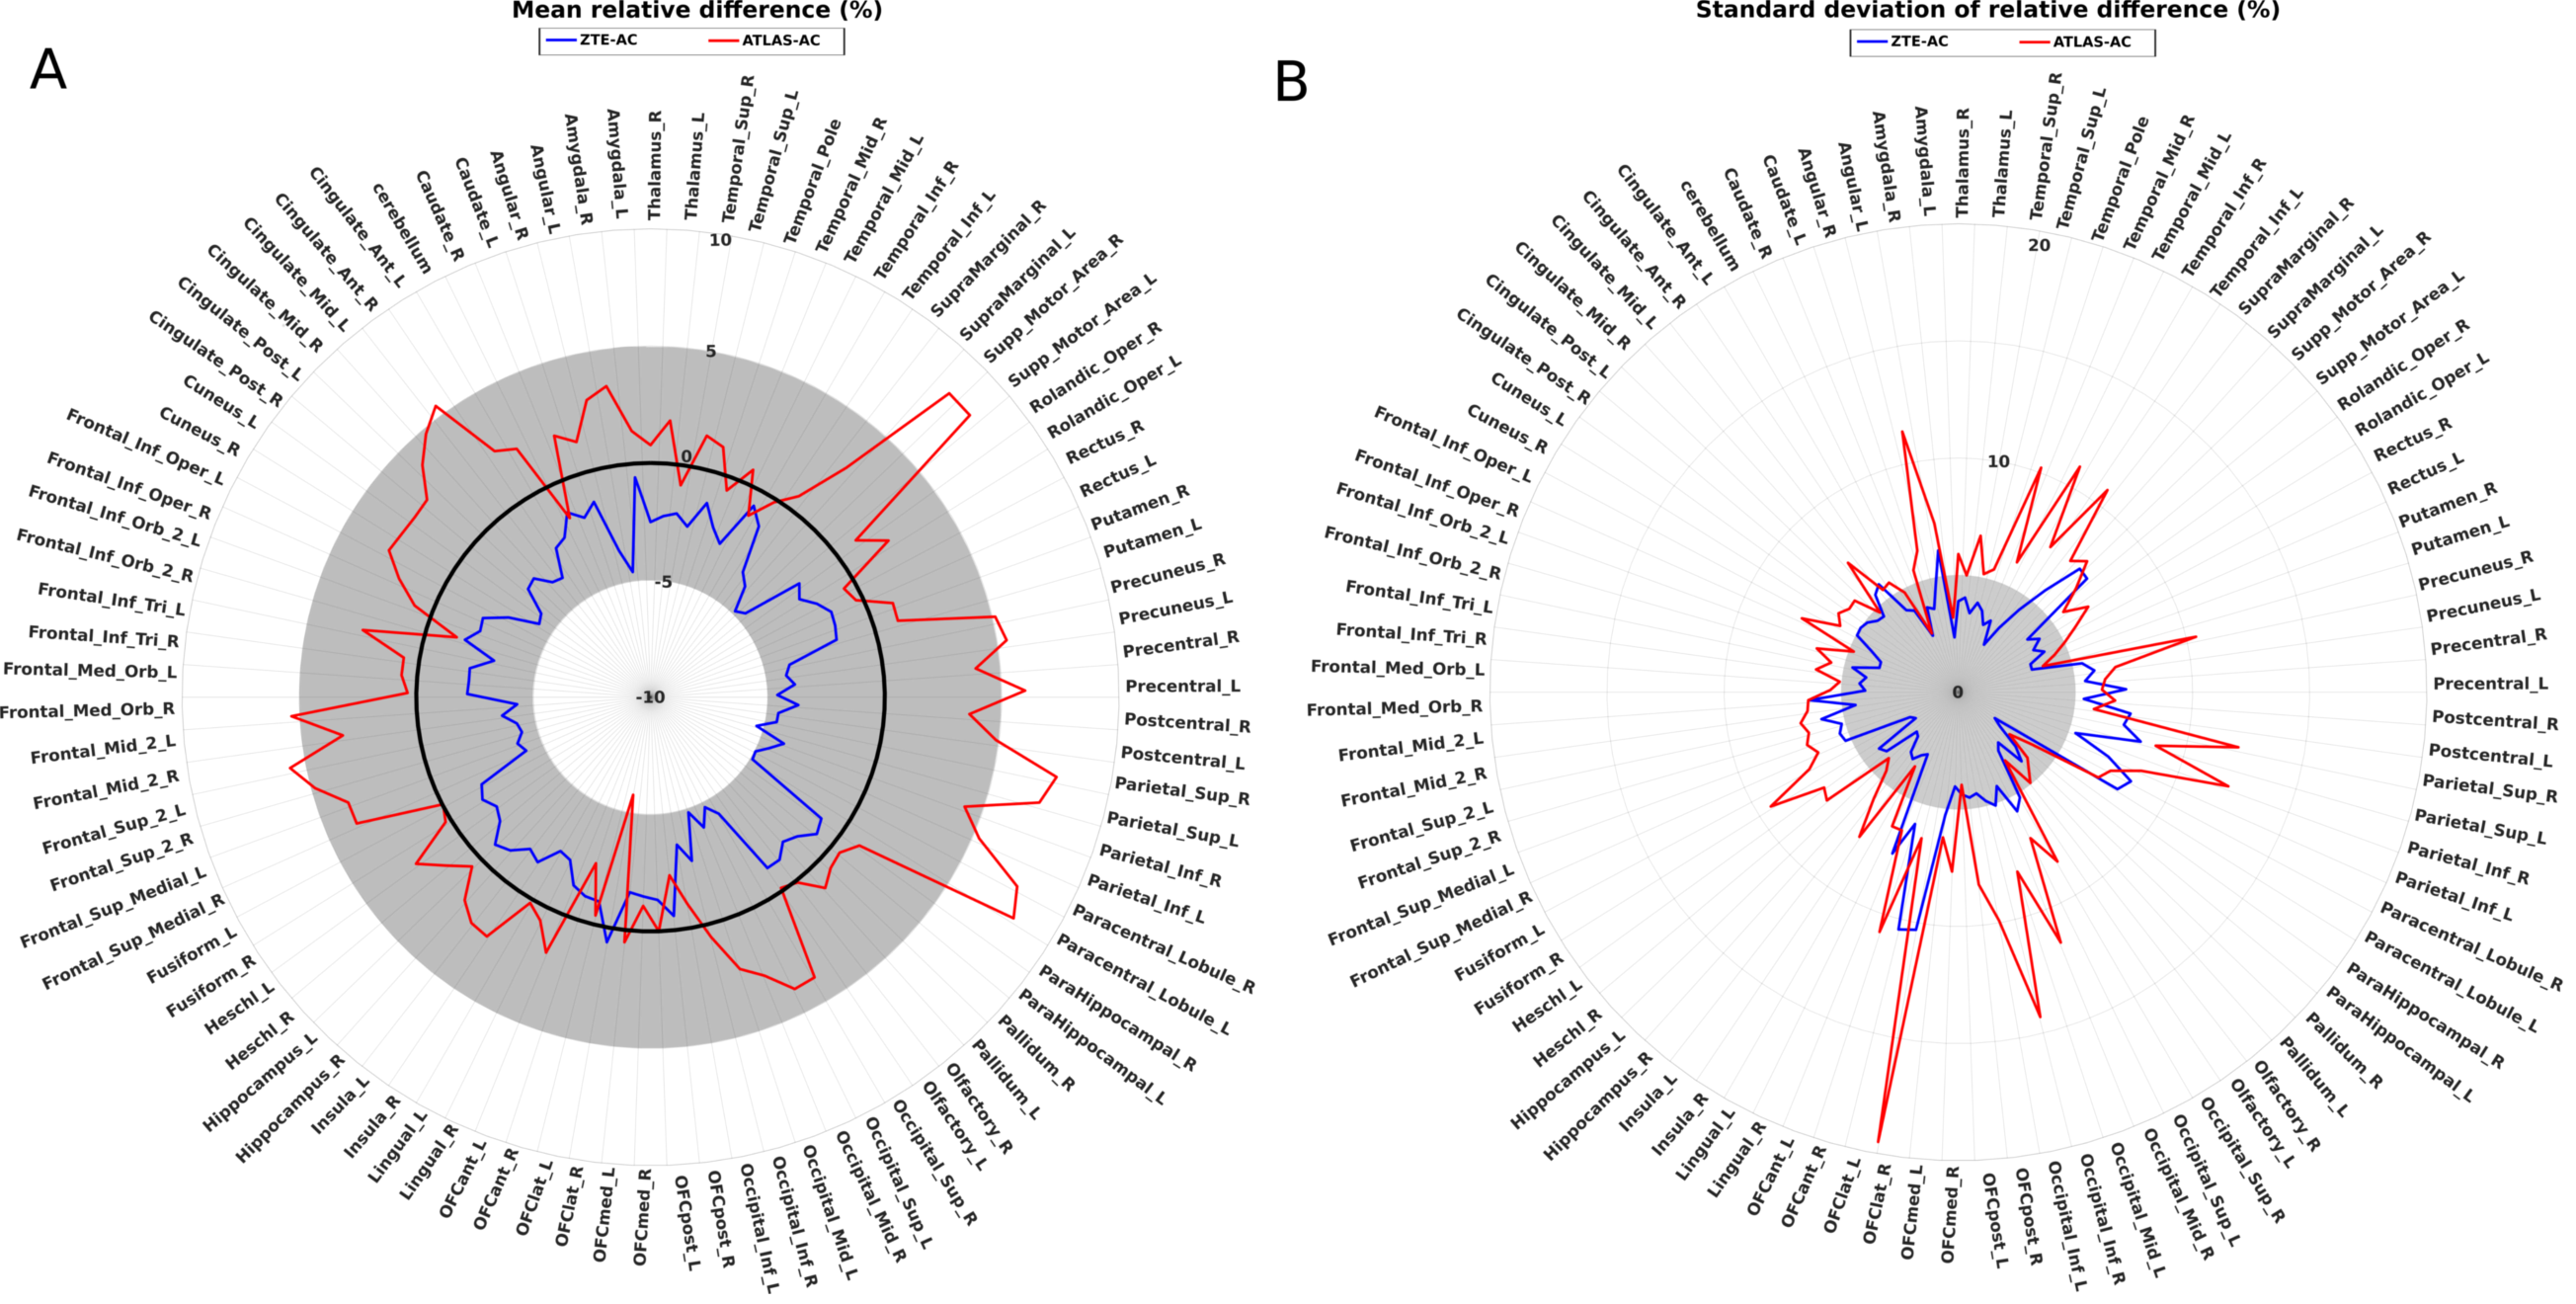
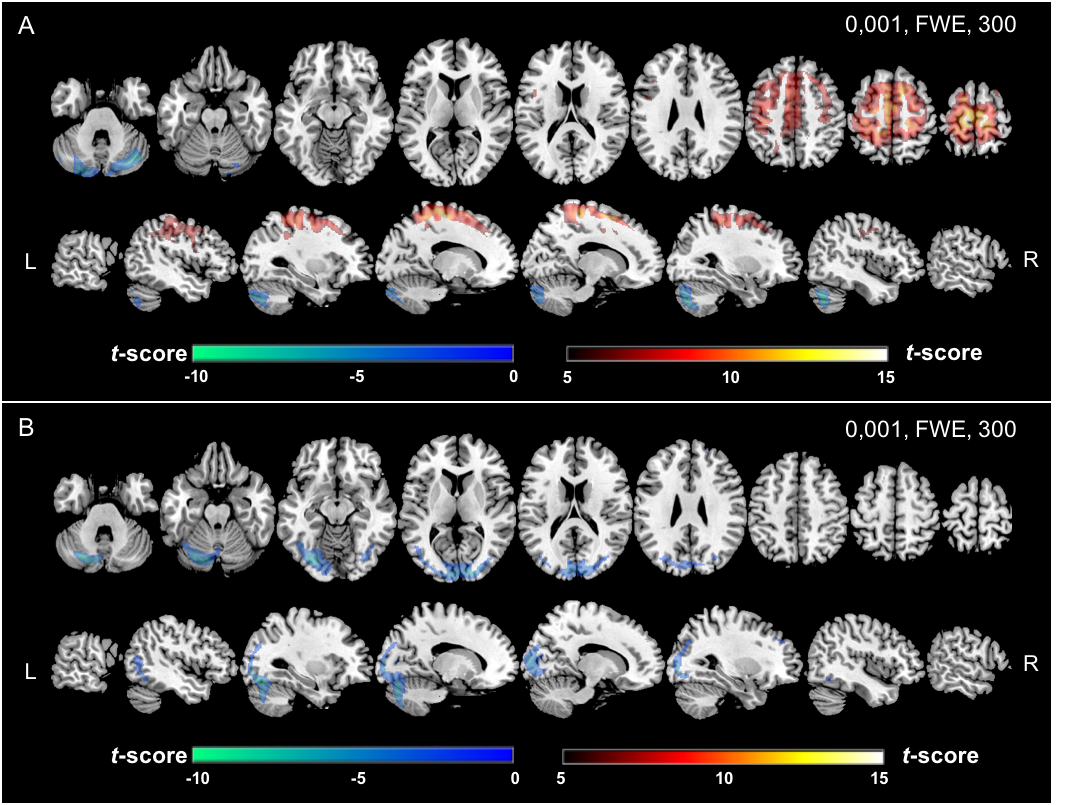
Atlas-AC resulted in metabolism overestimation in cortical regions near the vertex, mainly para-central lobule (7.9 ± 7.1%) and upper parietal cortex (7.4 ± 10.3 %) and metabolism underestimation in temporal cortex (0.2 ± 8.1%) and cerebellum (1.6 ± 2.8%). ZTE-AC led to moderate metabolism underestimation in upper parietal cortex (4.9 ± 7.7%), paracentral lobule (4.9 ± 8.1%) and upper frontal cortex (4, 2 ± 5.5%) (fig.1). In PETATLAS images, cortical metabolism was significantly overestimated in the middle frontal gyrus, the upper left temporal gyrus and underestimated in the cerebellum. In PETZTE, only a significant underestimation of cerebellar metabolism was found without significant metabolism overestimation in the other regions (fig.2) (all p<0.001 corrected).
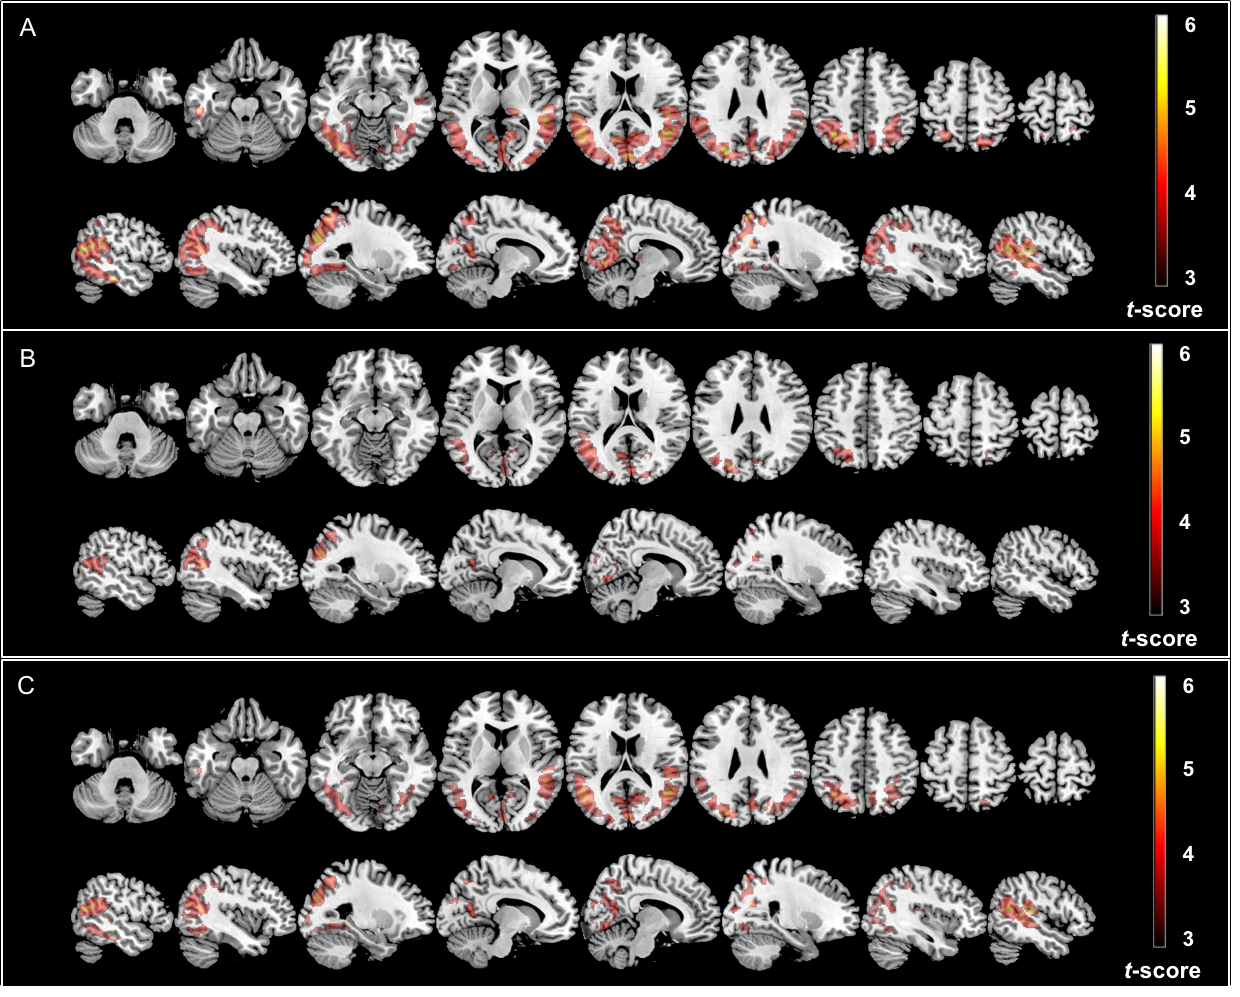
The voxelwise comparisons showed that significant clusters were of slightly smaller size but similar location for PETZTE (28538 voxels) compared to PETCT (49942 voxels) whereas PETATLAS showed only a smaller cluster of significant difference between the two groups of patients (9354 voxels) (fig.3).
Conclusion/Discussion
We evaluated two AC methods performance in brain 18F-FDG PET/MR in 50 patients explored for cognitive impairment and compared them to the reference CT-based method. Compared to previously published studies, this work includes a large number of subjects and is the first one to include patients with brain pathology. ZTE-AC yielded a moderate metabolic underestimation and low inter-individual and inter-regional variability. Atlas-AC presented a significant and heterogeneous overestimation and underestimation with important regional and inter-individual variability. Sub-group analysis suggested that PETZTE yielded larger differences between normal and pathological groups, with bigger significant clusters, in comparison with PETATLAS. Our results suggest that ZTE-AC is more suited for exploring cognitive disorders than atlas-AC as it may be the case in other nervous central system pathologies.Acknowledgements
This work was performed on a platform of France Life Imaging network partly funded by the grant ANR- 11-INBS-0006. The authors would like to thank GE Healthcare for providing access to research tools and prototype pulse sequences.References
- Delso G, Wiesinger F, Carl M, et al. ZTE-based clinical bone imaging for PET/MR. J Nuc Med 2015; 56(suppl 3):1806–1806.
- Sekine T, ter Voert E, Warnock G, et al. Clinical Evaluation of Zero-Echo-Time Attenuation Correction for Brain 18F-FDG PET/MRI: Comparison with Atlas Attenuation Correction. J. Nucl Med 2016; 57:1927–1932.
- Khalifé M, Fernandez B, Jaubert O, et al. Subject-specific bone attenuation correction for brain PET/MR: can ZTE-MRI substitute CT scan accurately? Phys Med Biol 2017; 62(19):7814.
Figures