1250
CORTICAL BONE VESSEL IDENTIFICATION ON CONTRAST-ENHANCED MR IMAGES1Radiology and Biomedical Imaging, University of California - San Francisco, San francisco, CA, United States, 2School of Medicine, Radiology, University of Colorado Denver - Anschutz Medical Campus, Aurora, CO, United States
Synopsis
Pathological cortical bone porosity negatively impacts bone strength, but the mechanisms of pathological pore growth are not understood. We hypothesize that the contents of cortical bone pores (marrow or vessels) may be useful indicators of pore expansion mechanisms. In this study, we developed a technique using high resolution CT and DCE-MRI to visualize and identify pore contents. Dynamic features such as temporal intensity difference and transition slope within pore voxels were evaluated and clustered by a K-means clustering algorithm. The average intensity of segmented vessel-filled pores increased over time, demonstrating the ability of our technique to positively identify vessel-filled pores.
Introduction
Cortical bone porosity is a major determinant of bone strength1. Metrics of cortical bone porosity can be quantified from high resolution peripheral quantitative computed tomography (HR-pQCT), and are widely used in musculoskeletal research. Such indicators of porosity, however, are unable to explain the mechanisms of pore growth and therefore fail to predict the development of pathological porosity. To understand the mechanisms of pore growth, more detailed data are needed. Pore space content may be a useful indicator of the mechanisms of pore expansion. Specifically, vessels within newly expanded pores may indicate pore growth driven by the expansion of the vascular system. Fat cells or marrow within pores may indicate pore growth driven by marrow compartment expansion. Dynamic contrast-enhanced MRI (DCE-MRI) is used widely for evaluating tissue perfusion. In this study, DCE-MRI has been applied for visualization and identification of the contents of cortical bone pores (marrow or vessels). This novel imaging application is challenging due to the need for high spatial and contrast resolution.Methods
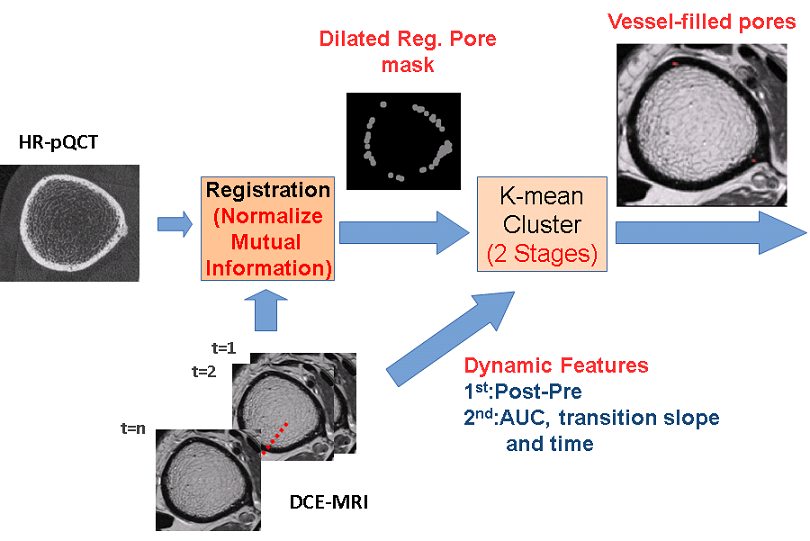
UCSF IRB approval was obtained for this study. Distal tibias of 4 volunteers were imaged using HR-pQCT (XtremeCT Scanco Medical AG) with 60 kVp, 900 μA and isotropic voxel size 82 μm for cortical bone segmentation and pore mask definition3. Gadolinium DCE-MRI (3T Signa GE Medical) with T1-weighted FSE (Slice thickness: 2 mm; TR/TE:500/11.0 ms; Bandwidth: 244.1 Hz/pixel; Flip Angle:; Matrix size: 512x512; FOV=12cm) and SPGR (Slice thickness: 1 mm; TR/TE:11.8/3.6 ms; Bandwidth: 162.8 Hz/pixel; Flip Angle:; Matrix size: 512x512; FOV=12 cm) sequences were performed for vessel visualization. DCE-MRI was applied for 8 minutes with 1 minute injection delay (Gd-DTPA, 0.2mmol/kg). The DCE-MRI and HR-pQCT scans were co-registered using maximal normalized mutual information2 (FMRIB Software Library). To eliminate any influence of mis-registration, the pore masks were dilated before transforming to DCE-MRI coordinates to assure full coverage of pores. The intensity difference between each post-enhanced and pre-enhanced MRI volume was calculated for all pixels inside the dilated, transformed pore mask, and K-means clustering was performed to detect the candidates of vessel-filled pores4,5. The area under the post-pre intensity difference curve (AUC), the transition slope (defined as the change rate of post-pre intensity difference within the “transition period”, defined as the signal change from 20% to 80% of maximum) and the transition time (the time interval of the transition period) of candidate pixels were calculated and evaluated, and a second iteration of K-means clustering was applied to refine the results of vessel-filled pore identification6 (Fig.1).Results
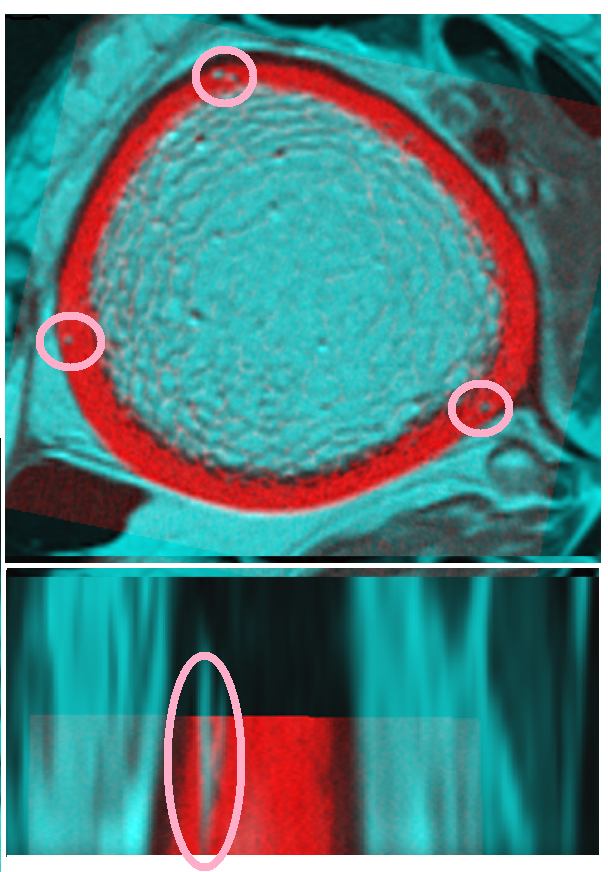
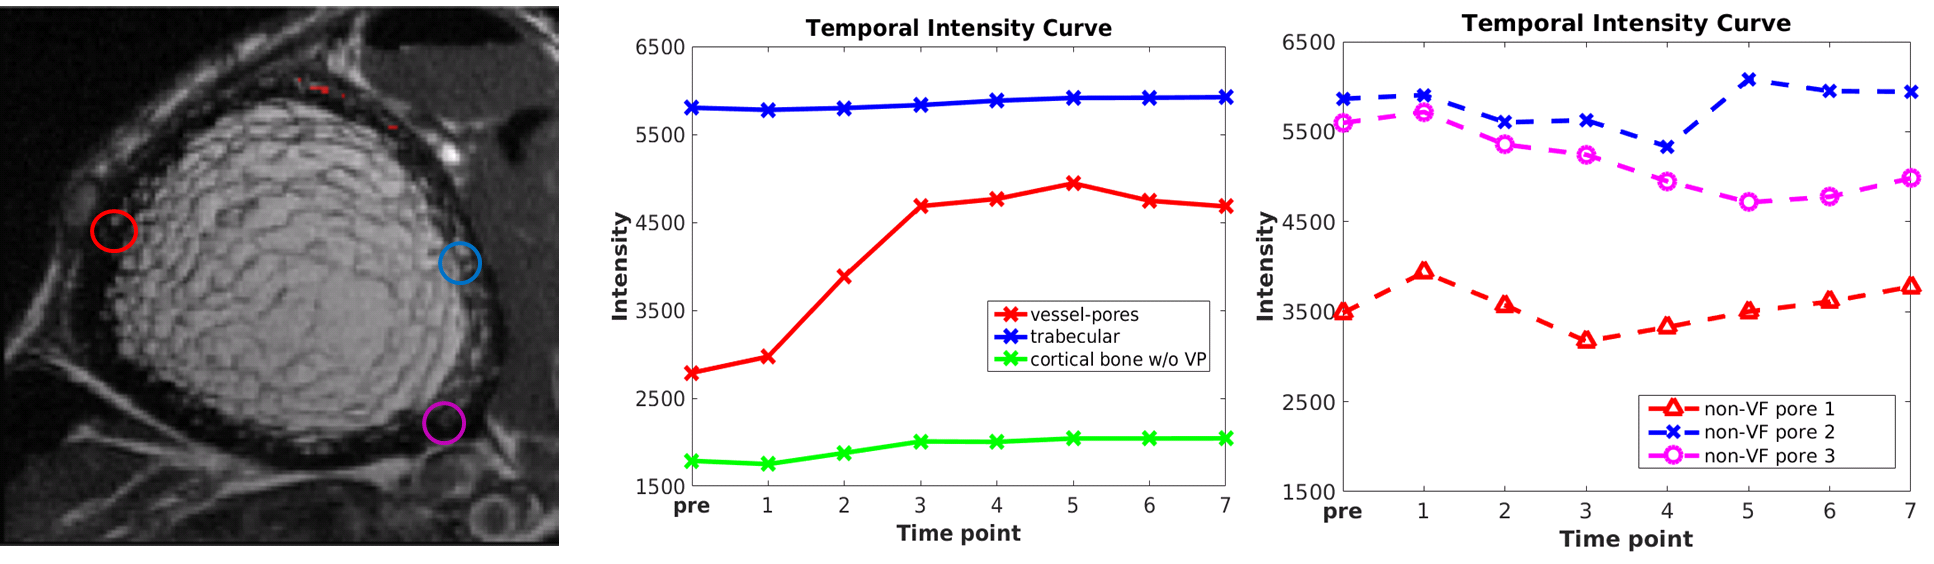
Our results demonstrate that DCE-MRI enables the visualization of vessels within cortical bone pores (Fig. 2), and K-means vessel clustering enables classification of voxels representing vessels within the 3D data set (Fig.3). The average intensity of segmented vessel-filled pores increased over time, while the intensity of non-vessel-filled pores (marrow-filled pores) remained constant after contrast injection. These results indicate that – within the spatial resolution limits of our MRI sequences – vessel-filled pores can be discriminated from marrow-filled pores by the proposed method.Discussion and Conclusion
We have demonstrated the ability of the proposed technique to positively identify vessel-filled pores and classify pore content within cortical bone by DCE-MRI and image processing A limitation of this technique is that many smaller cortical pores and vessels are below the resolution limits of our imaging techniques; however, we have demonstrated that large intracortical pores and their contents can be studied using this proposed technique. By applying these techniques to a longitudinal study, we can investigate the relationships between pore growth and the expansion of the vascular system and/or the marrow compartment. Once these relationships are understood, we can identify biomarkers to predict the progression of porosity and evaluate therapies to prevent pathological pore progression.Acknowledgements
Funding support was provided by National Institutes of Health (NIH-NIAMS) Grant NOs. R01AR069670 and R03AR064004References
1. McCalden R. W, McGeough J. A, Barker M. B, et al. Age-related changes in the tensile properties of cortical bone. The relative importance of changes in porosity, mineralization, and microstructure. Journal of Bone & Joint Surgery 1993
2. Jenkinson M, Bannister P, Brady M, et al. Improved Optimization for the Robust and Accurate Linear Registration and Motion Correction of Brain Images. NeuroImage 2002;17(2): 825-841
3. Burghardt A.J, Kazakia G.J, Sode M, et al.A longitudinal HR-pQCT study of alendronate treatment in postmenopausal women with low bone density: Relations among density, cortical and trabecular microarchitecture, biomechanics, and bone turnover. J Bone Miner Res 2010;25(12):2558-2571
4. Arthur D, Vassilvitskii S, k-means++: The Advantages of Careful Seeding. SODA;2007:1027-1035
5. Lloyd S. Least squares quantization in PCM. IEEE Trans. Inf. Theory 1982;28(2):129-137
6. Liu J, Pedoia V, Heilmeier U, et al. High-temporospatial-resolution dynamic contrast-enhanced (DCE) wrist MRI with variable-density pseudo-random circular Cartesian undersampling (CIRCUS) acquisition: evaluation of perfusion in rheumatoid arthritis patients. NMR BIOMED 2016;29(1):15-23
Figures