1249
Three-Dimensional Ultrashort Echo Time Cones Actual Flip Angle Imaging with Variable Repetition Time (3D UTE-Cones AFI-VTR) for Accurate T1 mapping of Short T2 Tissues1University of California, San Diego, San Diego, CA, United States, 2GE Healthcare, San Diego, CA, United States, 3VA San Diego Healthcare System, San Diego, CA, United States
Synopsis
To overcome the challenges (i.e. fast signal decay and low excitation efficiency) which would other render T1 measurements inaccurate for short T2 tissues, we propose a new approach by combining 3D UTE-Cones the actual flip angle imaging (AFI) with UTE-Cones variable repetition time (VTR) (3D UTE-Cones-AFI-VTR) method, where the identical RF pulses and flip angles are used for signal excitation in both sequences.
Introduction
T1 can be measured using various techniques, each with considerations and challenges, but one commonly used volumetric technique is the variable repetition time (VTR) method. Due to challenges with B1 inhomogeneity, correction is required and the actual flip angle imaging (AFI) technique has been proposed for this purpose 1. However, the typical AFI sequence cannot be used on short T2 tissues since signal has largely decayed prior to acquisition and because of the typically large flip angles (>40°) that are used for increased sensitivity 2. An ultrashort echo time based AFI technique (UTE-AFI) would be ideal to capture signal prior to decay, but would not overcome the low excitation efficiency when large flip angles are used on short T2 tissues (e.g. relaxation during excitation). To overcome these challenges which would other render T1 measurements inaccurate, we propose a new approach by combining 3D UTE-Cones-AFI with UTE-Cones VTR (3D UTE-Cones-AFI-VTR), where the identical RF pulses and flip angles are used for signal excitation in both sequences.Methods
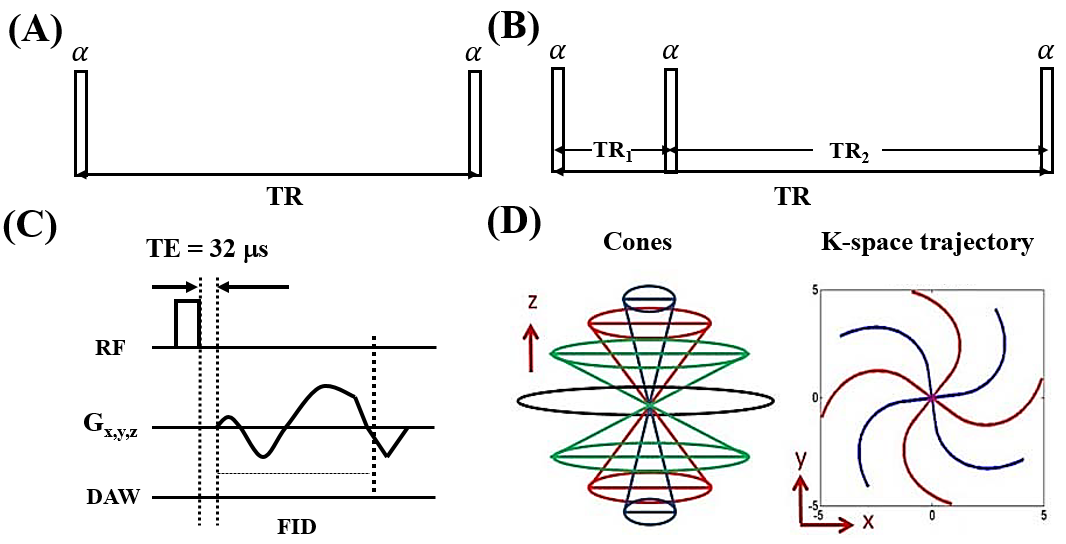
AFI mapping was achieved with the 3D dual-TR UTE-Cones sequence (Fig. 1B) 1,3. For both UTE-Cones (Fig. 1A) and UTE-Cones-AFI sequences, a short rectangular pulse was used for non-selective signal excitation (Fig. 1C) with TE=32µs, followed by 3D spiral trajectories with conical view ordering (Fig. 1D). Steady state signals acquired in TR1 and TR2 of the 3D UTE-Cones-AFI can be expressed as follows 1,4:
\[S_1=M_0f_{xy}(\alpha,\tau,T_2)\frac{1-E_2+(1-E_1)E_2f_{z}(\alpha,\tau,T_2)}{1-E_1E_2f_z^2(\alpha,\tau,T_2)}[1]\]
\[S_2=M_0f_{xy}(\alpha,\tau,T_2)\frac{1-E_1+(1-E_2)E_1f_{z}(\alpha,\tau,T_2)}{1-E_1E_2f_z^2(\alpha,\tau,T_2)}[2]\]
With E1=exp(-TR1/T1) and E1=exp(-TR2/T1). fxy(α,τ,T2) and fz(α,τ,T2) representing the transverse and longitudinal magnetization mapping functions induced by an RF pulse respectively. α and τ are the flip angle and the duration of the rectangular excitation pulse respectively. With short TRs relative to T1, the signal ratio r of S1 and S2 can be simplified with a first-order approximation to the exponential terms 1:
\[r=\frac{S_2}{S_1}\approx\frac{1+nf_z(\alpha,\tau,T_2)}{n+f_z(\alpha,\tau,T_2)}[3]\]
\[f_z(\alpha,\tau,T_2)\approx(rn-1)/(n-r)[4]\]
where n = TR2/TR1. Thus, the ratio r can be used as a T1 independent measurement of fz(α,τ,T2). In this study, α was not calculated as it was in previous studies, but rather the obtained fz(α,τ,T2) was directly used as an input for T1 measurement with the VTR method. The signal acquired with the 3D UTE-Cones can be expressed as follows:
\[S_{spgr}=M_0f_{xy}(\alpha,\tau,T_2)\frac{1-E}{1-Ef_z(\alpha,\tau,T_2)}[5]\]
with E=exp(-TRs/T1). TRs is the repetition time of the UTE-Cones. Transverse and longitudinal mapping functions are identical to Eqs. [1] and [2] since the same RF pulse and flip angle are used. Fitting of Eq. [5] can be used to obtain T1 values from the VTR UTE-Cones data.
The UTE-Cones-AFI and conventional UTE-Cones were implemented on a 3T scanner (GE Healthcare) with an 8-channel transmit/receive knee coil. The TRs and flip angles of UTE-Cones-AFI are fixed for both ex vivo and in vivo studies: TR1/TR2=20/100ms and flip angle=45°. A bovine cortical bone sample was used to compare two VTR T1 measurements with different excitation flip angles of 20°/45°, whose RF durations were 60µs/150µs. TRs used in the two VTR measurements were 15/30/50/80ms. UTE-Cones-AFI was used to get fz(α,τ,T2) to correct T1 measurement errors induced by both B1 inhomogeneity and imperfect excitation of the 45° pulse. The 20° pulse was more accurate for excitation with a shorter duration of 60µs, which is much less than the typical T2* of cortical bone (around 300µs). Thus the measured T1 values were expected to mainly suffer from B1 inhomogeneity effects. In addition, after IRB approval and written informed consent, the UTE-Cones-AFI-VTR method was tested on three healthy male volunteers using similar imaging parameters.
Results and Discussion
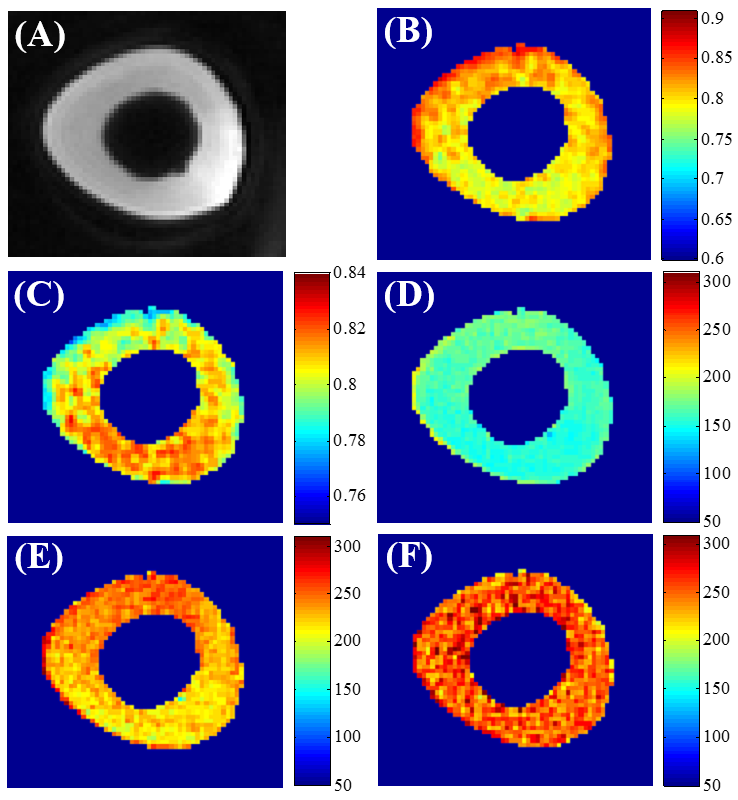
Figure 2 shows T1 measurements on bovine cortical bone using the proposed UTE-Cones-AFI-VTR method (45°/150µs) and conventional VTR method (20°/60µs and 45°/150µs). Fig. 2D (VTR: 45°/150µs) suggests that T1 measurement using a RF pulse with lower excitation efficiency tends to underestimate T1. Using the UTE-Cones-AFI-VTR method (Fig. 2F), values are more uniform and closer to those in Fig. 2E (VTR: 20°/60µs). The proposed UTE-Cones-AFI-VTR method can correct both B1 inhomogeneity and excitation efficiency.
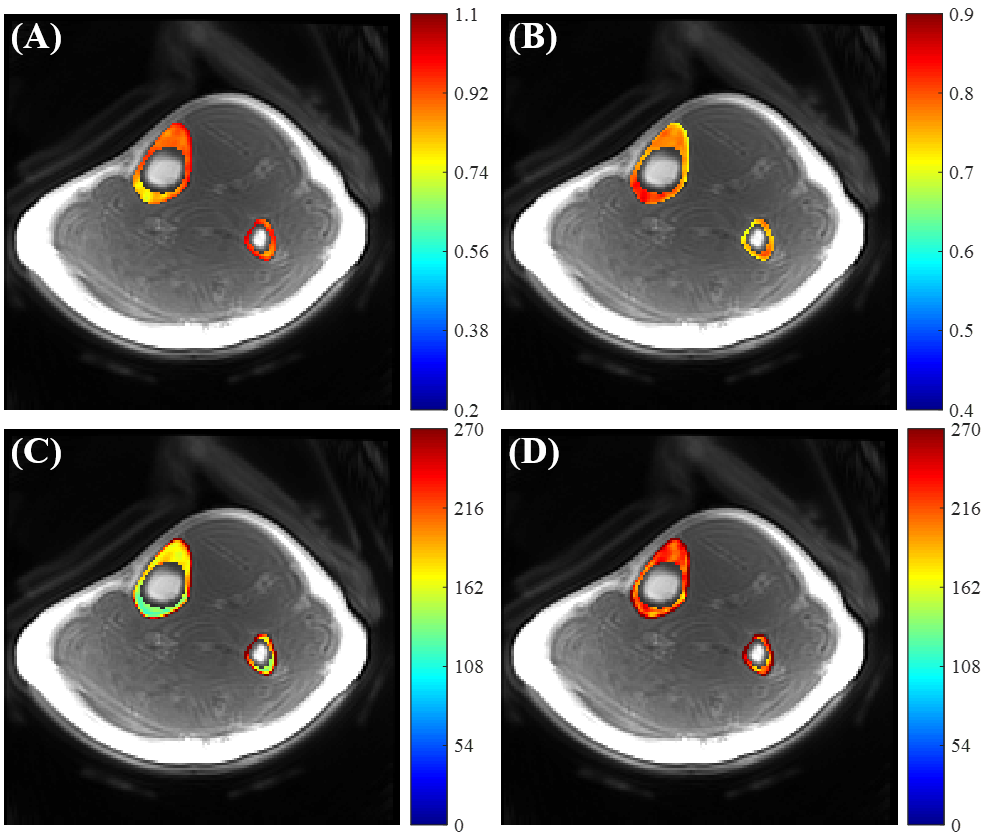
Figure 3 shows tibial cortical bone results from a healthy volunteer. The VTR T1 maps without correction show lower T1 values than the T1 maps generated by the proposed UTE-Cones-AFI-VTR, which is consistent to the specimen results. More uniform T1 maps were generated with the UTE-Cones-AFI-VTR method.
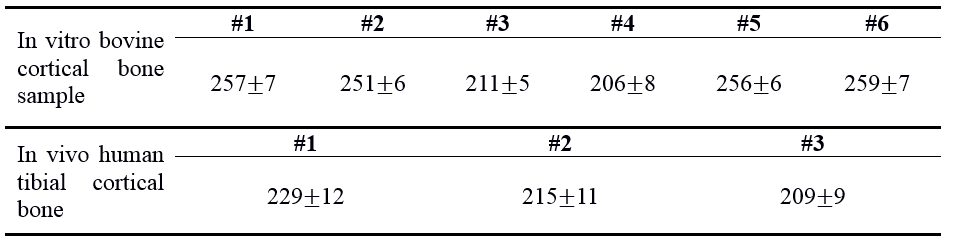
Table 1 summarizes T1 measurements for the bovine cortical bone samples (n=6) and tibial midshaft cortical bone in the healthy volunteers (n=3).
Conclusion
The 3D UTE-Cones-AFI-VTR can minimize B1 inhomogeneity and estimation errors due to excitation inefficiency, thus providing accurate T1 measurement for short T2 tissues.Acknowledgements
The authors acknowledge grant support from GE Healthcare, NIH (1R01 AR062581 and 1R01 AR068987), and the VA Clinical Science Research & Development Service (1I01CX001388).References
1. Yarnykh VL. Actual flip-angle imaging in the pulsed steady state: a method for rapid three-dimensional mapping of the transmitted radiofrequency field. Magn Reson Med 2007;57:192–200.
2. Du J, Bydder GM. Qualitative and quantitative ultrashort-TE MRI of cortical bone. NMR Biomed 2013;26:489-506.
3. Carl M, Bydder GM, Du J. UTE imaging with simultaneous water and fat signal suppression using a time-efficient multispoke inversion recovery pulse sequence. Magn Reson Med 2016;76:577–582.
4. Sussman MS, Pauly JM, Wright GA. Design of practical T2-selective RF excitation (TELEX) pulses. Magn Reson Med 1998;40:890–899.
Figures