1247
In Vivo Bone 31P Relaxation Measurement and Its Implications on Mineral Quantification1University of Pennsylvania, Philadelphia, PA, United States
Synopsis
In MRI-based bone mineral assessment, pixel intensity of the bone is compared against that of the sample to estimate the 31P density after correcting for their relaxation properties. Knowledge of bone 31P relaxation times is therefore crucial. Using saturation-recovery spectroscopy and ZTE-PETRA, T1, T2* and density of bone 31P in healthy subjects (26 to 76 y/o) were measured yielding 36.8±1.4s, 196.9±10.1μs and 6.10±0.62 mol/L. Measured T1 and T2* errors are expected to be within 6% and 15%, resulting in an error of quantified [31P] of ≤ 6.3%. The small inter-subject variations may therefore obviate the need for individual T1 measurements.
Introduction
Bone mineral phosphorus has been shown to be quantifiable by solid-state 31P MRI [1]. While proper quantification requires accurate knowledge of the relaxation times, the T1 of bone 31P is particularly difficult to measure since T2*/T1<<1 [1-4]. Therefore, assumed T1 values have previously been used [5]. Here we measured T1 of bone 31P in a cohort of healthy subjects with wide age range at 3 T, and the possible implications of errors in T1 on 31P quantification. The accuracy of the technique was analyzed by simulation and the measured T1 and T2* were subsequently used to estimate bone mineral density from 31P zero echo time (ZTE) images. Repeatability was also evaluated in three subjects.Methods
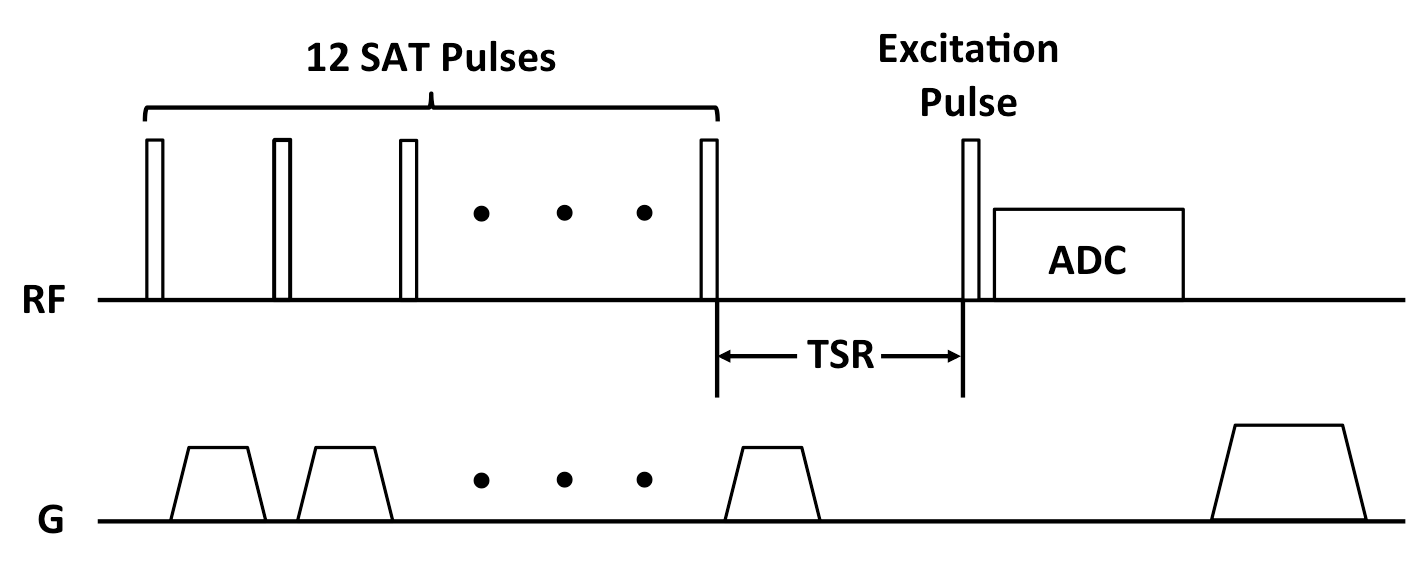
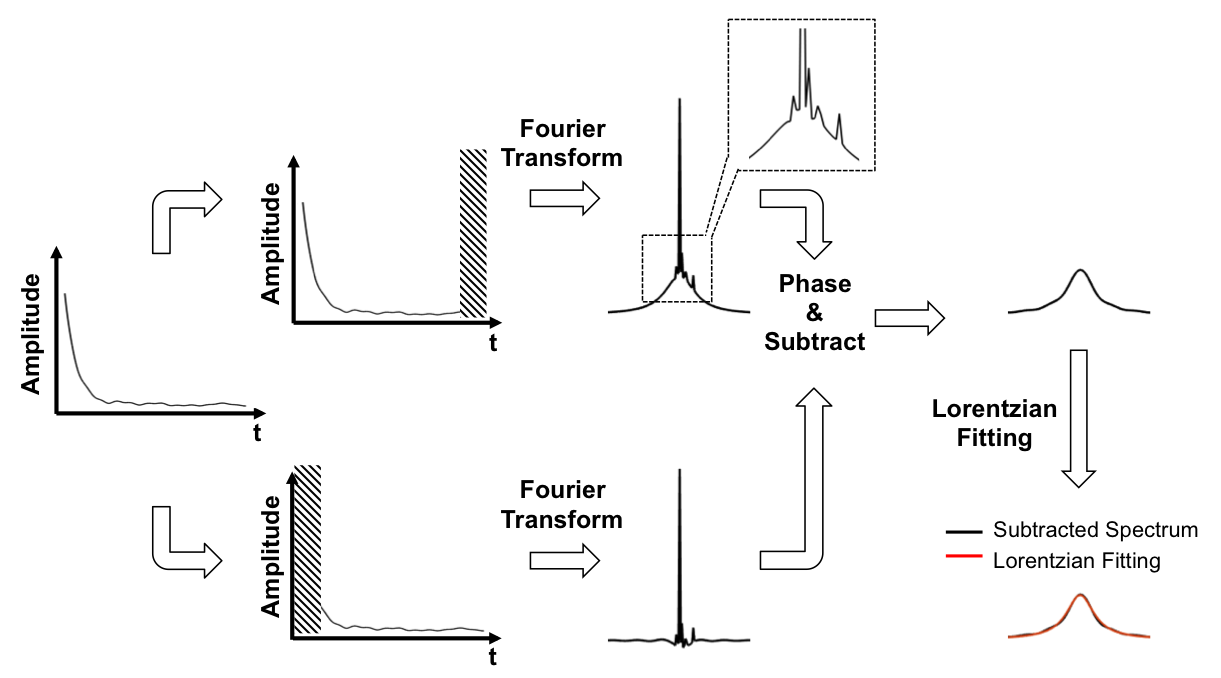
The tibial mid-shafts of ten healthy subjects (26 to 76 y/o) were scanned on a Siemens 3 T Trio system with a 1H/31P dual frequency birdcage calf coil. T1 of bone 31P was measured with the saturation recovery (SR) sequence in Figure 1. Since both the phosphate metabolites in muscle and bone mineral phosphate contribute to the spectroscopic signal, bone signal was isolated by creating two spectra: one directly from the acquired FID (Total_Spec) and a second one from the same FID after deleting the first 150 points (dominated by the fast-decaying bone signal; Metabolite_Spec). After phase correction, subtraction of the two spectra yielded the bone 31P spectrum (Figure 2), which was fitted to a Lorentzian. The integral of this resonance line was fit to a mono-exponential model to extract T1. Errors in T1 estimation due to interference from metabolite signals was evaluated via simulation using literature value of relaxation times [6], taking into account B1 inhomogeneity of the coil measured with the Bloch-Siegert method [7]. 31P images were acquired with a custom-made ZTE-PETRA sequence [8, 9] and [31P] was quantified relative to a calibration sample [5]. Three subjects underwent three scans each for test-retest repeatability evaluation.Results
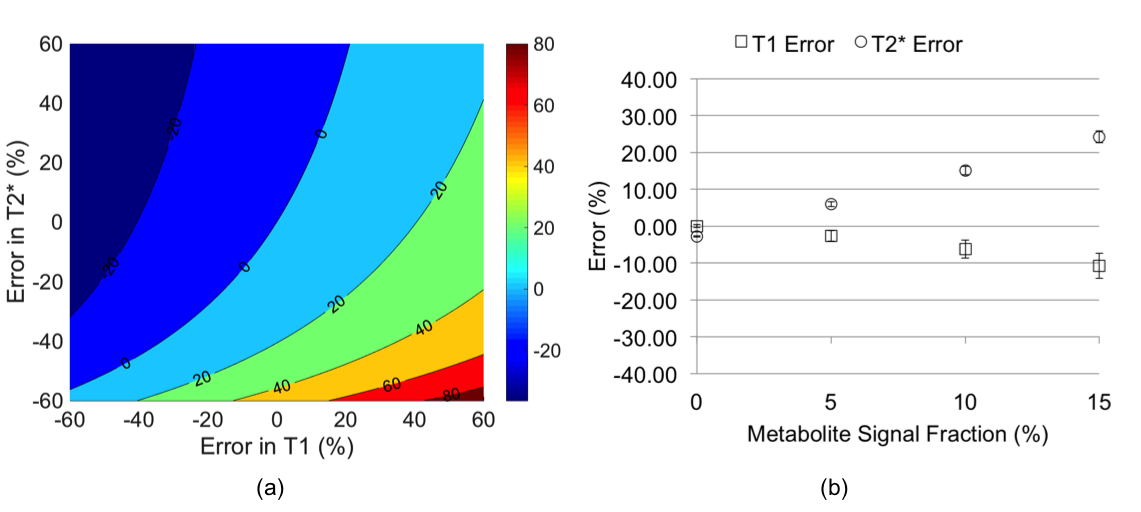
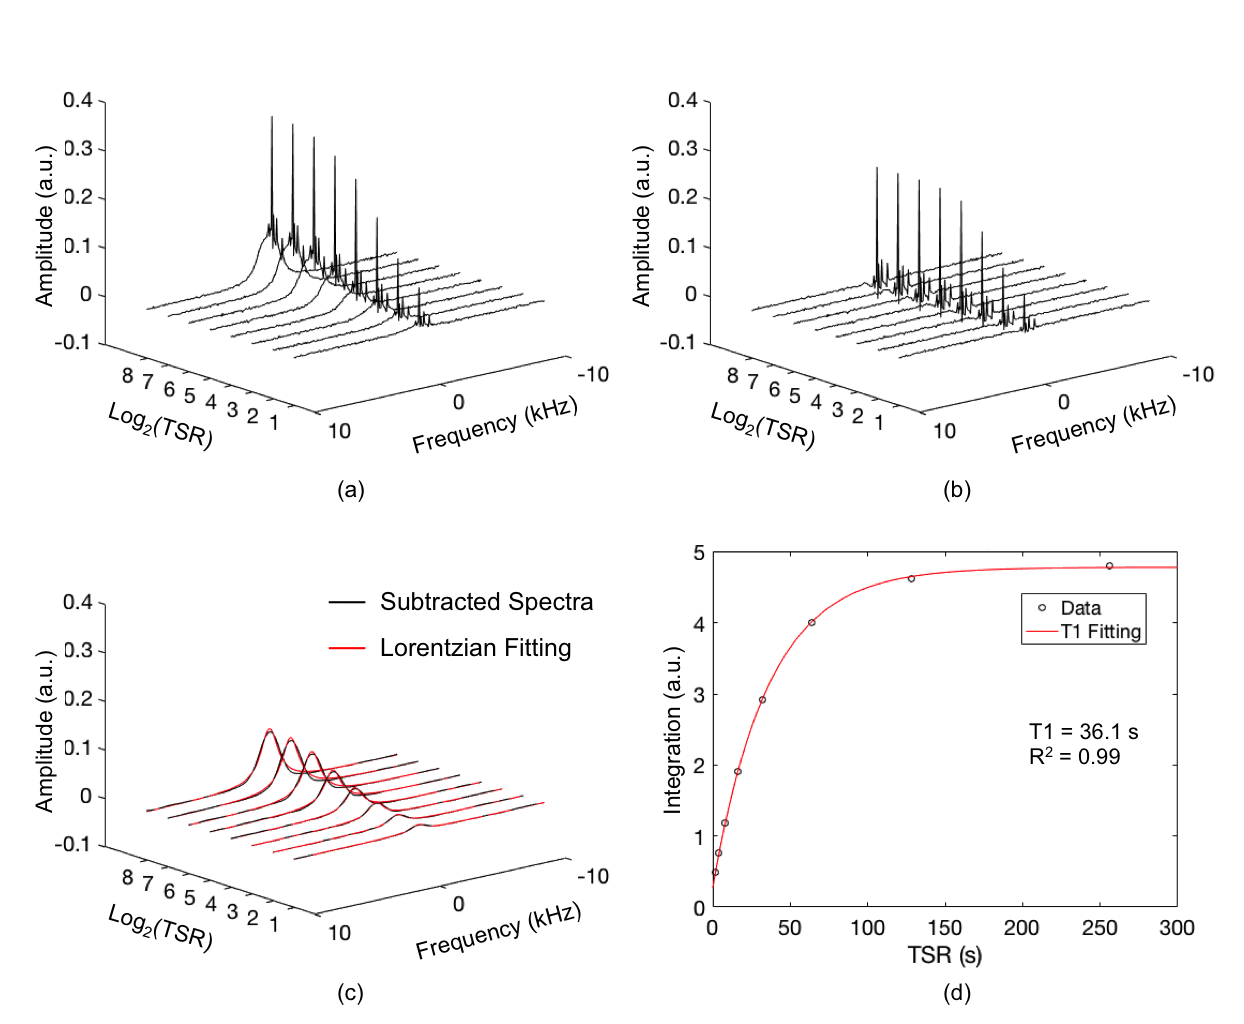
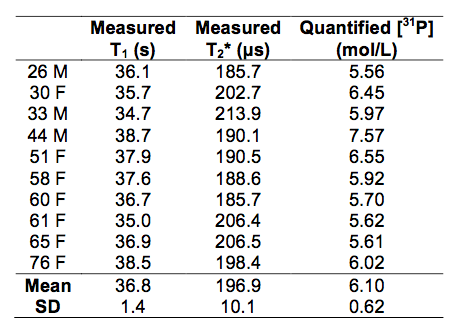
Figure 3a plots percent error in quantified [31P] as a function of the error in relaxation times. Effects of relative contributions from metabolites to total signal on the relaxation times measured are shown in Figure 3b. Spectra generated from an in vivo dataset are shown in Figures 4a-b. Figure 4c displays bone 31P SR spectra after removal of the metabolite signals. The result of mono-exponential fitting is given in Figure 4d. Table 1 summarizes the relaxation times measured for all ten subjects as well as bone [31P] quantified from ZTE images using the measured relaxation values. Repeatability experiments yielded average coefficients of variation of 1.53% for T1, 2.64% for T2* and 4.77% for [31P]. Neither the relaxation times nor [31P] was found to be significantly correlated with age.Discussion and Conclusions
According to Figure 3b, T1 is progressively underestimated with increasing fraction of metabolite 31P in the total signal (since metabolite T1s are shorter by about one order of magnitude). T1 is underestimated by ~10% while T2* is overestimated by ~24% when 15% of the total signal arises from the metabolites, which would result in [31P] being underestimated by 9.7% according to Figure 3a. However, using typical muscle metabolite concentrations [10], bone [31P] measured ex vivo [1] and muscle volume measured from gradient echo images, a rough estimate done on a few subjects indicated that over 90% of in vivo 31P total signal actually originates from bone, limiting the measurement error for T1 and T2* to within -6% and 15%, respectively. According to the simulation in Figure 3a, this magnitude of relaxation time error translates into an error in estimated [31P] of less than 6.3% if relaxation is the only error source, suggesting the reliability of the proposed method for measuring bone 31P relaxation. However, the variation in T1 across subjects observed in this study is very small (36.8±1.4 s), which parallels the relatively small variation in T1 (96.7±10.8 s measured at 7 T) for a group of 16 tibia specimens from donors aged 27 to 97 years at death [1], and no correlation with age was observed in that study as well. In addition, mean [31P] quantified using measured relaxation times in the present study (6.10±0.62 mol/L) is close to measurements ex vivo (6.74±1.22 mol/L) [1], where the experiment was free from interference of metabolites signal. In conclusion, the finding of the current study might obviate the need to measure individual bone 31P T1 altogether, using instead estimated values, thereby shortening the scan protocol.Acknowledgements
NIH R01-AR50068References
1. Seifert, A.C., et al., Bone mineral 31P and matrix-bound water densities measured by solid-state 31P and 1H MRI. NMR in Biomedicine, 2014. 27(7): p. 739-748.
2. Seifert, A.C., et al., 31P NMR Relaxation of Cortical Bone Mineral at Multiple Magnetic Field Strengths and Levels of Demineralization. NMR in Biomedicine, 2013. 26(9): p. 1158-66.
3. Robson, M.D., et al., Human imaging of phosphorus in cortical and trabecular bone in vivo. Magn Reson Med, 2004. 51(5): p. 888-92.
4. Wu, Y., et al., Evaluation of bone mineral density using three-dimensional solid state phosphorus-31 NMR projection imaging. Calcif Tissue Int, 1998. 62(6): p. 512-8.
5. Zhao, X., et al., Feasibility of assessing bone matrix and mineral properties in vivo by combined solid-state 1H and 31P MRI. PLoS One, 2017. 12(3): p. e0173995.
6. Meyerspeer, M., M. Krssak, and E. Moser, Relaxation times of 31P-metabolites in human calf muscle at 3 T. Magn Reson Med, 2003. 49(4): p. 620-5.
7. Sacolick, L.I., et al., B1 mapping by Bloch-Siegert shift. Magn Reson Med, 2010. 63(5): p. 1315-22.
8. Grodzki, D.M., P.M. Jakob, and B. Heismann, Ultrashort echo time imaging using pointwise encoding time reduction with radial acquisition (PETRA). Magn Reson Med, 2012. 67(2): p. 510-8.
9. Li, C., et al., Selective in vivo bone imaging with long-T2 suppressed PETRA MRI. Magn Reson Med, 2016.
10. Kemp, G.J., M. Meyerspeer, and E. Moser, Absolute quantification of phosphorus metabolite concentrations in human muscle in vivo by 31P MRS: a quantitative review. NMR Biomed, 2007. 20(6): p. 555-65.
Figures