1246
Preliminary Application Researches of Quantitative Susceptibility Mapping in Evaluating the Osteoporosis1Department of Medical Radiology, The Third Affiliated Hospital of Southern Medical University, Guangzhou, China, 2School of Biomedical Engineering, Guangdong Provincial Key Laboratory of Medical Image Processing, Southern Medical University, Guangzhou, China, 3Philips Healthcare, Guangzhou, China
Synopsis
The purpose of this work was to explore the clinical application of quantitative susceptibility mapping(QSM)using an ultrashort echo time (UTE) gradient echo (GRE) sequence in evaluating the bone mineral density(BMD)of lumbar vertebra by analyzing the correlation between QSM and quantitative computed tomography (QCT). Our results showed that there was strong correlation between QSM and QCT. QSM has the potential to be a biomarker providing new insights into osteoporosis.
Purpose
Osteoporosis is diagnosed on measurements of bone mineral density (BMD) using dual energy x-ray absorptiometry (DXA) and quantitative computed tomography (QCT) at present. However, DXA is suspiciously over-accurate by the tenets of too much overlapping objects during the X-ray exposure process. Additionally, QCT is limited in usage as its much higher radiation dose than DXA. Therefore, a new and safe diagnostic tool for evaluating BMD without using ionizing radiation is still needed in clinical work. Quantitative susceptibility mapping (QSM) can provide quantitative, reproducible images of magnetic susceptibility sources to assess the health and disease of many tissues [1]. Further, QSM has been investigated in skeletal system recently [2]. The purpose of this study was to explore the clinical application of using QSM in evaluating the BMD of lumbar vertebra by analyzing the correlation between QSM and QCT, trying to provide a new imaging method for diagnosing osteoporosis.Materials and Methods
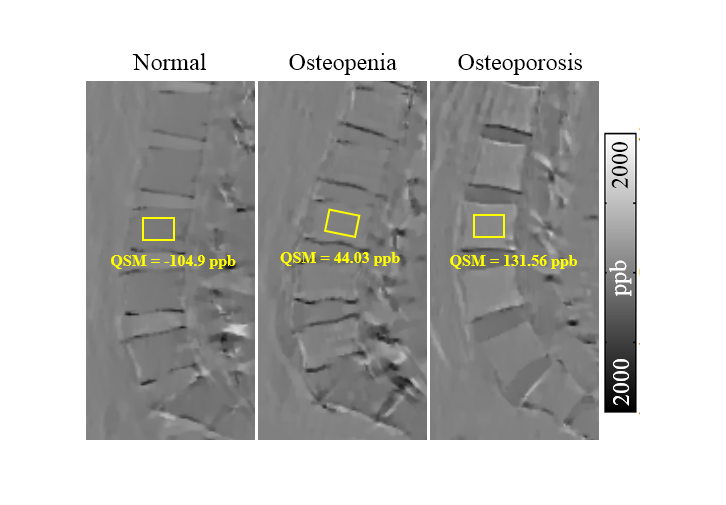
Ninety subjects (16 males and 74 females; mean age, 53.4 years; range 20~75 years) were evaluated for this study. This prospective study had been approved by the institutional review board and all participants provided signed informed consent. All the subjects underwent QCT detecting the lumbar bone density and were divided into three groups (normal: QCT > 120 mg/cm3; osteopenia: 80 mg/cm3 < QCT < 120 mg/cm3; osteoporosis: QCT < 80 mg/cm3). A radial 3D GRE-UTE sequence was implemented on a clinical 3 Tesla (T) scanner (Ingenia, Philips) using the following parameters: TE = 0.142, 2.4, 4.6, 6.8 ms, TR = 20 ms, FA = 25 , voxel size = 1 1 2 mm3, matrix size = 256× 256× 75, total acquisition time for all echoes = 9 min. Assuming the negligible effect of chemical shift at the acquired TE, the total field map was obtained from complex MR signals using nonlinear least squares fitting method [3], and subsequently was unwrapped with a continuous Laplacian approach. Then, background field removal was performed by using projection onto dipole fields [4]. Finally, susceptibility maps were estimated with the L1-regularization. QSM values were measured and recorded in the L3 (Figure 1). Single-factor analysis of variance (ANOVA) was used to analyze the differences of QSM values among the three groups. QSM value was correlated with QCT using a standard Pearson’s correlation coefficient.Results
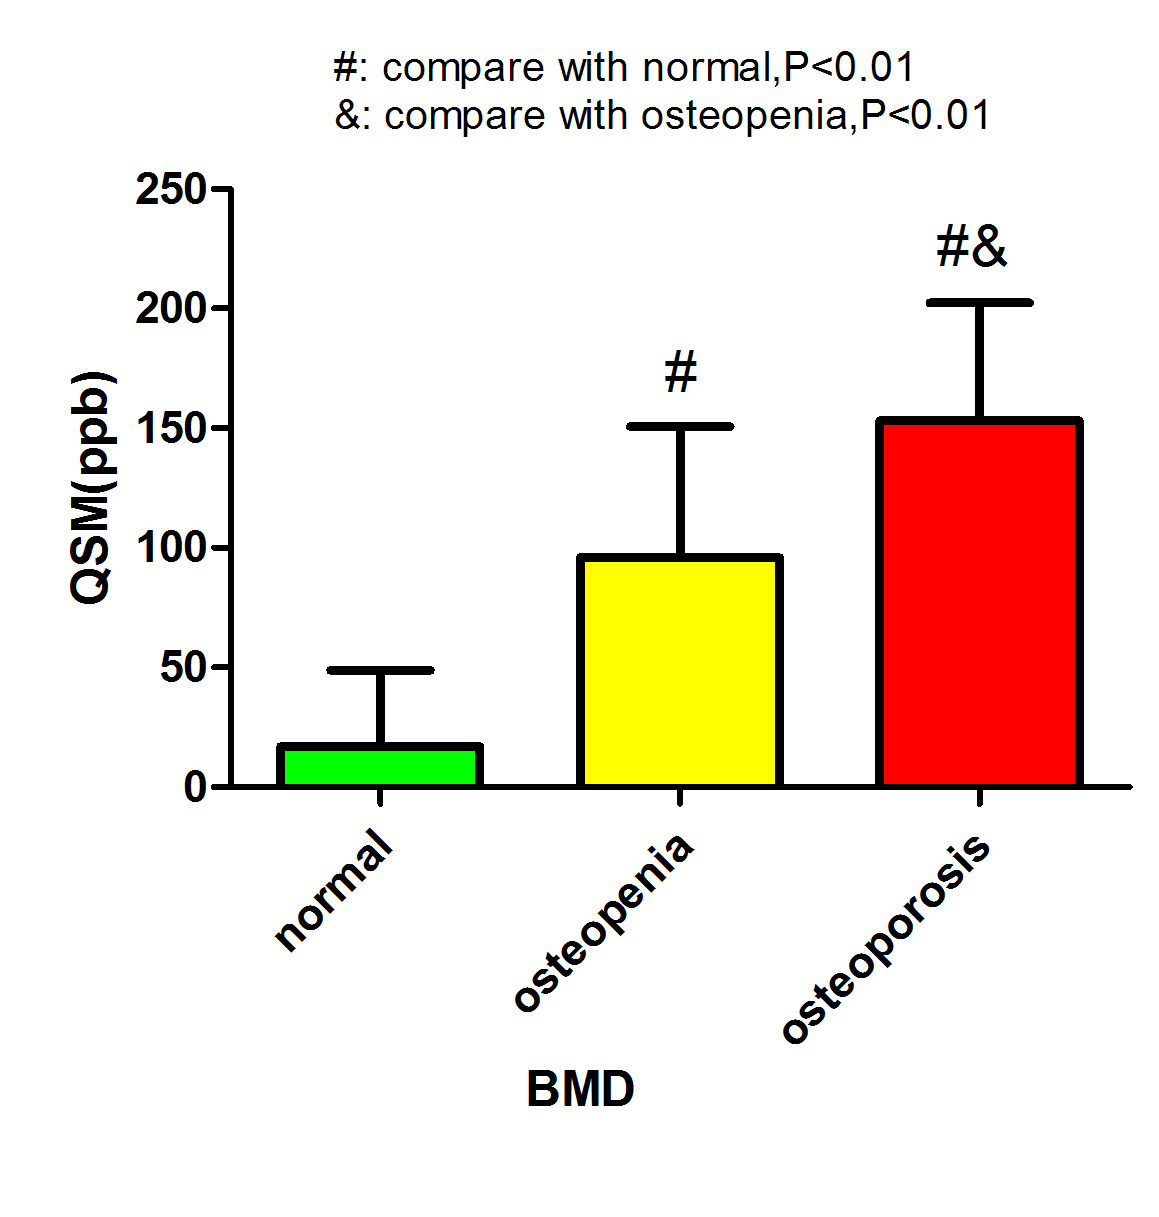
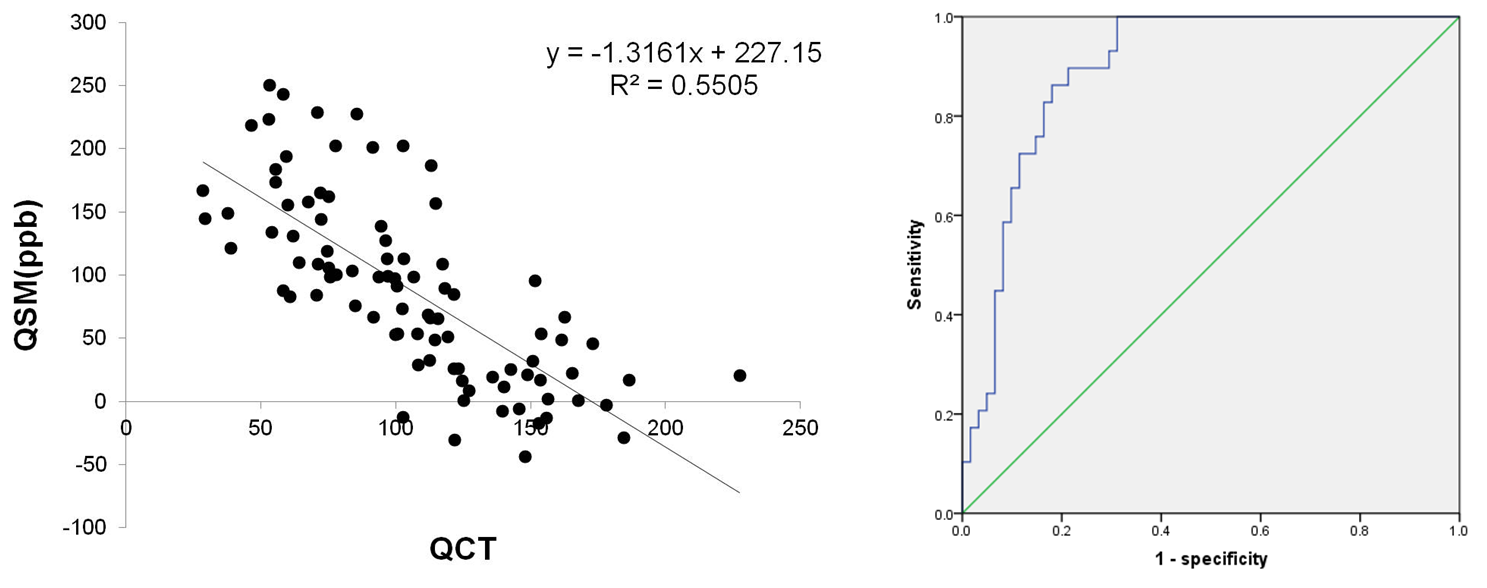
The result showed that the QSM value for the subjects with osteoporosis was significantly higher than the normal (P < 0.01) and the osteopenia (P < 0.01) (Figure 2). The correlation coefficient between QSM and QCT is r = -0.742 (P < 0.01), demonstrating the strong correlation between them. ROC curve analysis showed that AUC = 0.895. The sensitivity and specificity of the diagnosis of osteoporosis was 86.2% and was 82.0% with the optimal threshold of QSM (99.76 ppb). (Figure 3).Discussion
The results demonstrate the clinical application value of mapping bone magnetic susceptibility in vertebral body bone marrow for evaluating BMD. This method uses a radial UTE-GRE sequence to acquire the rapidly decaying signal of bone. The QSM value increased for the subject with osteoporosis and the results showed excellent correlation with QCT . As the highly concentrated calcification is the dominant susceptibility source, QSM allows noninvasive quantitative mapping of bone mineralization without the need for radiation.Conclusion
The QSM of bone is feasible using UTE with ultrashort echo time GRE acquisition. There was strongly correlation between QSM and QCT. QSM has a high sensitivity and specificity in diagnosing osteoporosis and has the potential to be a biomarker providing new insights into osteoporosis.Acknowledgements
No acknowledgement found.References
[1] Chen W, et al. Intracranial calcifications and hemorrhages: characterization with quantitative susceptibility mapping.Radiology 2014;270(2):496.
[2] Dimov AV, et al. Bone quantitative susceptibility mapping using a chemical species-specific R2* signal model with ultrashort and conventional echo data. Magn Reson Med. 2017 Mar 5.
[3] Liu T, et al. Nonlinear formulation of the magnetic field to source relationship for robust quantitative susceptibility mapping. MRM 2013;69(2):467-476.
[4] Liu T, et al. A novel background field removal method for MRI using projection onto dipole fields. NMR 2011;24(9):1129-1136.
Figures