1245
Quantitative Susceptibility Mapping of Human Spine: Correlation with Quantitative Computed Tomography and Reproducibility1Guangdong Provincial Key Laboratory of Medical Image Processing,School of Biomedical Engineering, Southern Medical University, Guangzhou, China, 2Philips Healthcare, Guangzhou, China, 3Department of Medical Imaging, The Third Affiliated Hospital, Southern Medical University, Guangzhou, China
Synopsis
This work aim to investigate the correlation between quantitative susceptibility mapping (QSM) and quantitative computed tomography (QCT) values, and the reproducibility of QSM value in human spine. Sixty-one subjects underwent QCT measurement for once and QSM measurement for twice in spine. The results showed that QSM value has strong correlation with QCT value, and has good reproducibility between two scans. These indicated that QSM has the potential to be an effective and stable measurement of BMD in clinical application.
Introduction
QCT has been applied to be an effective marker in measuring bone mineral density (BMD) 1, but suffers from ionizing radiation. A recent study reported that quantitative susceptibility mapping (QSM) has good correlation with bone CT in porcine hoof 2, suggesting the potential of QSM as an effective indicator for measurement of BMD. In this work, we aim to evaluate the feasibility of QSM in measurement of BMD by investigating the correlation between QCT and QSM, and the reproducibility of QSM in human spine.Methods
This study had been approved by the institutional review board and all participants provided signed informed consent. Sixty-one subjects (mean age, 55.5 years; range 20~79 years) were enrolled in this study, including 15 normal subjects, 24 osteopenia subjects and 22 osteoporosis subjects. All the subjects underwent QCT measurement for once and MR scan on the same day. A repeated MR scan was performed one day later for the evaluation of inter-scan reproducibility. For MR scan, a radial 3D GRE-UTE sequence was implemented on a clinical 3.0 T scanner (Ingenia, Philips) with the following parameters: TR = 20 ms, TE = 0.142, 2.4, 4.6, and 6.8 ms, FA = 25° , voxel size = 1 × 1 × 2 mm3, matrix size = 256 × 256 × 75. The total acquisition time was approximately 9 mins for each scan.
The total field map was obtained from complex MR signals using nonlinear least squares fitting method 3 without regarding to the effect of chemical shift because of water-fat in the same direction at the acquired TE, and was unwrapped with a continuous Laplacian approach 4. Then, background field removal was performed by using projection onto dipole fields 5. Finally, susceptibility maps were estimated with the L1-regularization 6.
Results
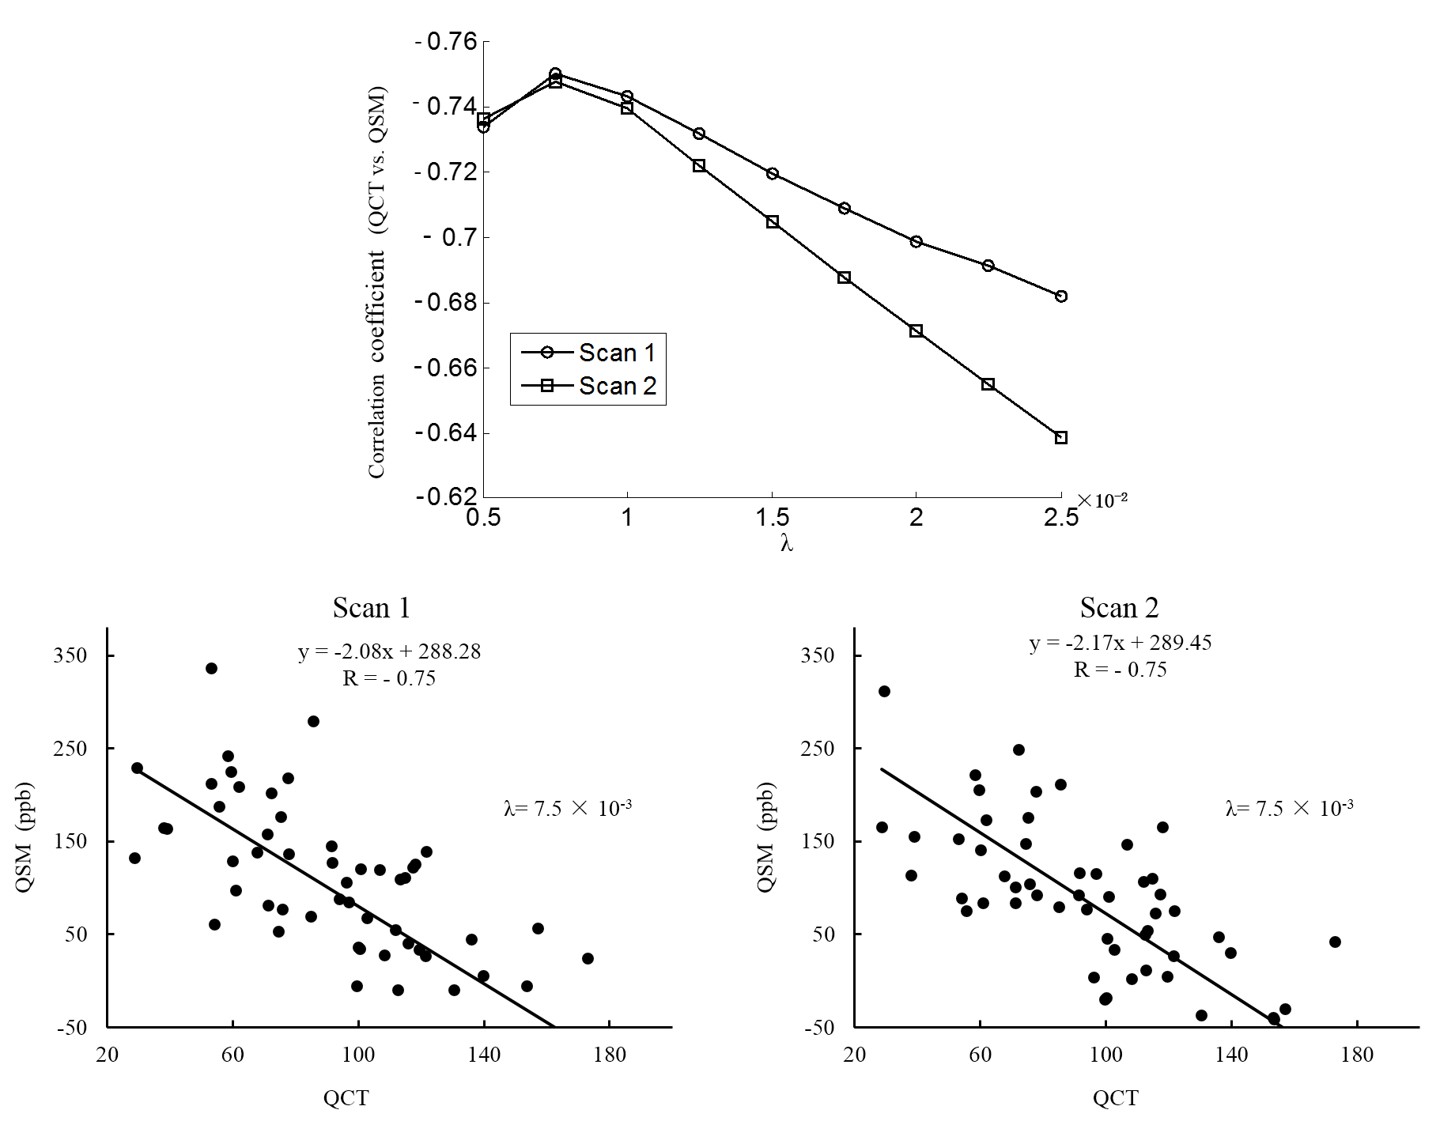
In the top row of Figure 1, it can be observed that the correlation coefficient between QCT and QSM values is susceptible to the regularization parameter value. The regularization parameter value corresponding to the largest correlation coefficient between QCT and QSM values was found to be λ = 7.5 × 10⁻³ for both scans. In the bottom row of Figure 1, QSM value showed a strong correlation with QCT value (R = - 0.75 for both two scans) in 61 subjects, and the slopes of QSM and QCT values were close (k = -2.08 for the Scan 1 and k = -2.17 for the Scan 2).
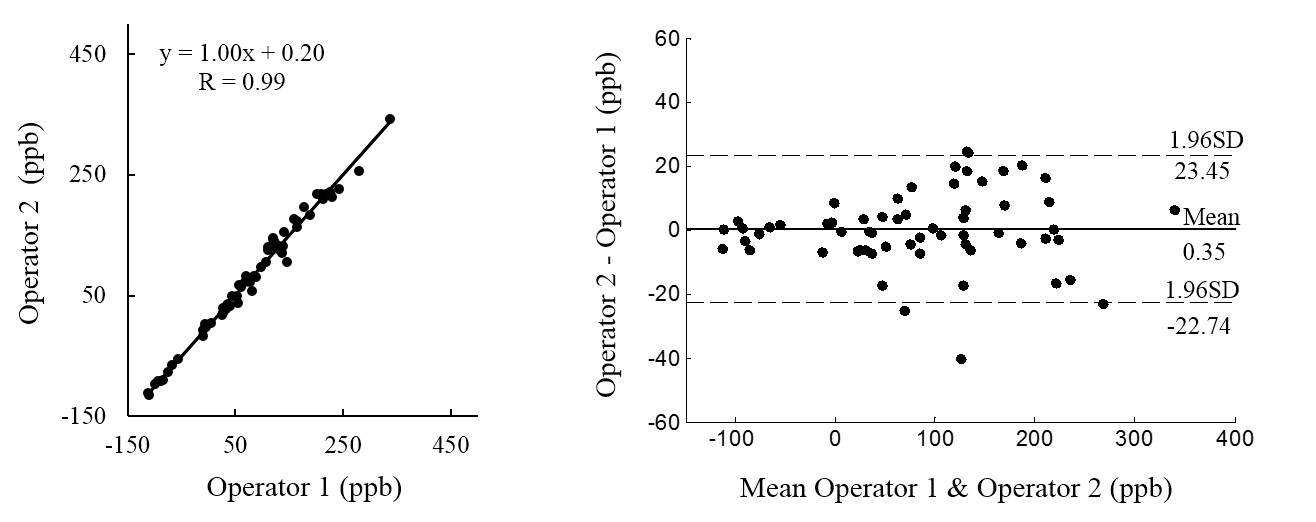
In the measurements of QSM value, an excellent agreement with intraclass correlation coefficient ICC = 0.99 can be observed between two operators in Scan 1(Figure 2). Measurement of Operator 1 versus Operator 2 showed correlation coefficient R = 0.99 and slope k = 1.00. Bland-Altman plots showed a bias of 0.35 ppb with 95% limits of agreement of [-22.74, 23.45] ppb.
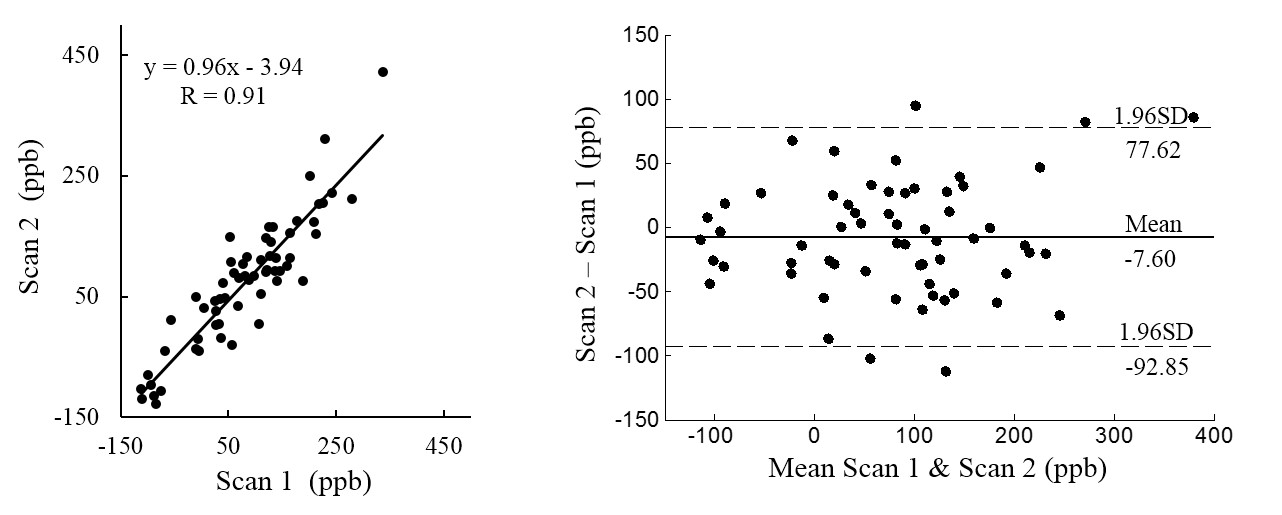
QSM value measurement showed good reproducibility intraclass correlation coefficient ICC = 0.91 between two scans. Measurement of Scan 1 versus Scan 2 showed correlation coefficient R = 0.91 and slope k = 0.96. Bland-Altman plots showed a bias of -7.6 ppb with 95% limits of agreement of [-92.85, 77.62] ppb.
Discussion and Conclusion
This study investigated the feasibility and reproducibility of QSM in predicting BMD in human spine. The preliminary results showed that QSM value has strong correlation with QCT value, and has good inter-operator and inter-scan reproducibilities. Spine QSM has the potential to be an effective and stable marker for predicting BMD, and can be applied to evaluate osteoporosis in clinical application.Acknowledgements
No acknowledgement found.References
1. Pickhardt PJ, Lee LJ, del Rio AM, et al. Simultaneous screening for osteoporosis at CT colonography: bone mineral density assessment using MDCT attenuation techniques compared with the DXA reference standard. Journal of bone and mineral research : the official journal of the American Society for Bone and Mineral Research. 2011 Sep;26(9):2194-203.
2. Dimov AV, Liu Z, Spincemaille P, Prince MR, Du J, Wang Y. Bone quantitative susceptibility mapping using a chemical species-specific R2* signal model with ultrashort and conventional echo data. Magnetic resonance in medicine : official journal of the Society of Magnetic Resonance in Medicine / Society of Magnetic Resonance in Medicine. 2017 Mar 05.
3. Liu T, Wisnieff C, Lou M, Chen W, Spincemaille P, Wang Y. Nonlinear formulation of the magnetic field to source relationship for robust quantitative susceptibility mapping. Magnetic resonance in medicine : official journal of the Society of Magnetic Resonance in Medicine / Society of Magnetic Resonance in Medicine. 2013 Feb;69(2):467-76.
4. Acosta-Cabronero J, Cardenas-Blanco A, Betts MJ, et al. The whole-brain pattern of magnetic susceptibility perturbations in Parkinson's disease. Brain : a journal of neurology. 2017 Jan;140(Pt 1):118-31. 5. Liu T, Khalidov I, de Rochefort L, et al. A novel background field removal method for MRI using projection onto dipole fields (PDF). NMR in biomedicine. 2011 Nov;24(9):1129-36.
6. Bilgic B, Fan AP, Polimeni JR, et al. Fast quantitative susceptibility mapping with L1-regularization and automatic parameter selection. Magnetic resonance in medicine : official journal of the Society of Magnetic Resonance in Medicine / Society of Magnetic Resonance in Medicine. 2014 Nov;72(5):1444-59.
Figures