1244
Unravelling bone marrow adipose tissue composition in proximal femur sub-regions through 3T Chemical Shift Encoded-MRI: differences between osteoporosis and glucocorticoid-induced osteoporosis1Department of Radiology, NYU Langone Health, New York, NY, United States, 2Université de Lyon; CREATIS CNRS UMR 5220, Inserm U1206, INSA-Lyon, UCBL Lyon 1, Villeurbanne, France, 3Department of Rheumatology, NYU Langone Health, New York, NY, United States, 4Radiology, NYU Langone Health, New York, NY, United States, 5Osteoporosis Center, Hospital for Joint Diseases, NYU Langone Health, New York, NY, United States
Synopsis
Osteoporosis (OP) is due to weak bone and can ultimately lead to fracture. Recent findings shows link between bone marrow adipose tissue (bMAT) composition and amount and OP. OP can be induced by drugs such as glucocorticoids resulting in glucocorticoid-induced osteoporosis (GIO) and can affect energy metabolism pathways, induce changes in bone including increased total marrow adiposity and changes in bMAT composition. The composition of bMAT in GIO has not been previously investigated. Our aim was to assess the bMAT composition of a GIO population and compare it to OP patients using 3T Chemical Shift Encoded- MRI (CSE-MRI).
Introduction
Osteoporosis (OP) is due to weak bone and can ultimately lead to fracture. There has been a growing focus on the role of bone marrow adipose tissue (bMAT) in OP, including investigations of how marrow fat quantity and composition relates to common clinical parameters, such as bone mineral density (BMD), age, and body mass index (BMI). OP can be primary and can also be induced by drugs such as glucocorticoids used to treat asthma or rheumatologic diseases, resulting in glucocorticoid-induced osteoporosis (GIO). Glucocorticoids affect energy metabolism pathways and can induce changes in bone including increased total marrow adiposity, decreased bone mineral density, and changes in bMAT composition 1-3. Recent findings 4-6 suggest that bMAT composition may serve as a biomarker of OP. The composition of bMAT in GIO has not been previously investigated. Therefore, our aim was to assess the bMAT composition of a GIO population and compare it to that of OP patients using 3T Chemical Shift Encoded- MRI (CSE-MRI).Material & Method
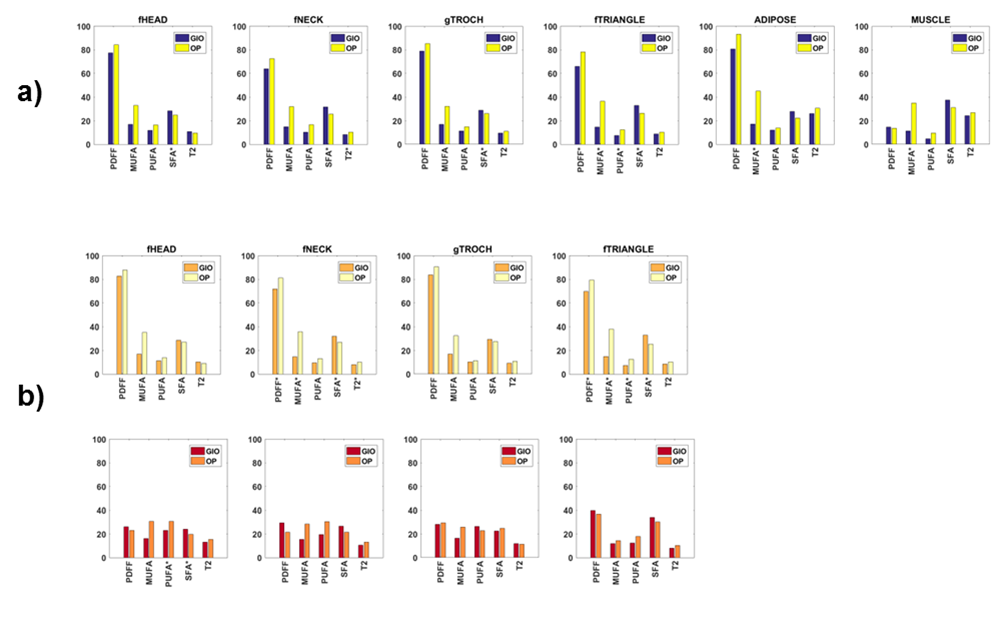
This study had institutional review board approval and written informed consent was obtained from all subjects. All subjects were recruited from the Rheumatology division at our institution. The inclusion criteria for GIO subjects was a greater than 12 month history of glucocorticoid use (equivalent of ≥ 5 mg prednisone daily). OP subjects had a history of fragility fracture or BMD T-score < -2.5 by DXA. Exclusion criteria for OP subjects was any secondary cause of OP including history of inflammatory, endocrinologic, or gastrointestinal disorder that may affect bone or any drug that may negatively affect bone (e.g., steroids, antidepressants). The subject characteristics are provided in table 1. MR acquisitions were performed on a 3T system (Siemens healthcare, Erlangen, Germany) using an 3D spoiled gradient echo sequence with a n=12 echoes train length (n ×1.2ms) with flyblack readout gradient. TR/FA = 16ms/5° and BW= 2000 Hz/px. 32 coronal slices were acquired. Using method described in 7,8, fat content (i.e. Proton Density Fat Fraction (PDFF)) and fatty acid composition quantification (i.e. saturated (SFA), monounsaturated (MUFA) and polyunsaturated (PUFA)) were computed as parametric maps. Semi-automatic bone segmentation was performed using an active contour method on the fat image to segment bMAT and from the PDFF-bMAT masked image, a k-mean algorithm (k=2) was used to cluster adipose tissue into red (rMAT) and yellow (yMAT) marrow. Subregions of the proximal femur were defined by drawing ROIs in the femoral head (fHead), femoral neck (fNeck), great trochanter (gTroch), Ward’s triangle (fTriangle), subcutaneous adipose tissue of the thigh (adipose) and in in the thigh muscle (muscle). Statistical differences in bMAT,rMAT,yMAT composition betwenn OP/GIO were investigated through using the Mann-Whitney non-parametric test.Results
Typical parametric maps are shown in Figure 1. Differences between GIO and OP patients are shown in Figure 2. With regards to bMAT composition, we found higher SFA within the femoral head, femoral neck, Ward’s triangle, and greater trochanter in GIO subjects compared to OP subjects (p < 0.05). We also found that there was lower MUFA within Ward’s triangle, subcutaneous fat, and muscle in GIO subjects compared to OP subjects (p < 0.05). Within yMAT, we found that there was higher SFA and lower MUFA within both the femoral neck and Ward’s triangle in GIO subjects compared to OP subjects (p < 0.05 for both). Within rMAT, we found that there was higher SFA and lower PUFA within the femoral head in GIO subjects compared to OP subjects (p < 0.05 for both).Conclusion
3T CSE-MRI allows detection of differences in bMAT composition in GIO subjects compared to OP subjects. Specifically, overall GIO subjects demonstrated higher SFA and lower MUFA and PUFA compared to OP subjects. The results provide further evidence for the role of marrow fat composition in bone health.Acknowledgements
No acknowledgement found.References
1. Cawthorn WP, Scheller EL, Parlee SD. Expansion of Bone Marrow Adipose Tissue During Caloric Restriction Is Associated With Increased Circulating Glucocorticoids and Not With Hypoleptinemia. Endocrinology. 2015;157:508-521.
2. Fillmore N, Huqi A, Jaswal JS, et al. Effect of fatty acids on human bone marrow mesenchymal stem cell energy metabolism and survival. PLoS One. 2015;10(3):e0120257.
3. Li G-W, Xu Z, Chen Q-W, Chang S-X, Tian Y-N, Fan J-Z. The temporal characterization of marrow lipids and adipocytes in a rabbit model of glucocorticoid-induced osteoporosis. Skeletal Radiol. 2013;42(9):1235-1244.
4. Yeung DK, Griffith JF, Antonio GE, Lee FK, Woo J, Leung PC. Osteoporosis is associated with increased marrow fat content and decreased marrow fat unsaturation: a proton MR spectroscopy study. J Magn Reson Imaging. 2005;22(2):279-285.
5. Pansini V, Monnet A, Salleron J, Hardouin P, Cortet B, Cotten A. 3 Tesla (1) H MR spectroscopy of hip bone marrow in a healthy population, assessment of normal fat content values and influence of age and sex. J Magn Reson Imaging. 2014;39(2):369-376.
6. Pietro G, Capuani S, Manenti G, R. M. Di : Bone Marrow Lipid Profiles from Peripheral Skeleton as Potential Biomarkers for Osteoporosis: A 1H-Study. Acad Radiol. 2016;23:273-283.
7. Leporq B, Lambert SA, Ronot M, et al. Hepatic fat fraction and visceral adipose tissue fatty acid composition in mice: Quantification with 7.0T MRI. Magn Reson Med. 2016;76(2):510-518.
8. Leporq B, Lambert SA, Ronot M, Vilgrain V, Van Beers BE. Quantification of the triglyceride fatty acid composition with 3.0 T MRI. NMR Biomed. 2014;27(10):1211-1221.
Figures