1241
Simultaneous PET-MRI for Investigating Associations Between Bone and Cartilage Biomarkers of Knee Osteoarthritis1Radiology & Biomedical Imaging, University of California, San Francisco, San Francisco, CA, United States, 2Physiology, Anatomy, Genetics, University of Oxford, Oxford, United Kingdom
Synopsis
Knee osteoarthritis (OA) is caused by cartilage degeneration which has been shown to be accompanied by the changes in adjacent subchondral bone. Simultaneous PET-MRI enables investigating the biomarkers of cartilage degeneration in OA with MRI (i.e. T1ρ, T2 and Gadolinium uptake) as well as biomarkers of bone remodeling in OA with PET (uptake of NaF tracer in bone) at the same time. PET-MRI also allows for probing the associations between different bone and cartilage markers. Voxel-wise assessment of these associations provides insight into the local correlations between different OA markers and yields comprehensive assessment of knee OA progression.
Introduction
Knee osteoarthritis (OA) causes significant pain and disability in patients and is associated with loss of collagen and proteoglycans from cartilage extracellular matrix1. Cartilage degeneration is accompanied by changes in the adjacent subchondral bone2,3. Simultaneous PET-MRI of knee enables probing both cartilage degeneration and bone remodeling caused by OA as well as their associations4,5. Considering OA related changes in bone and cartilage occur locally6, this study investigates the correlations between PET, MRI, and patient-reported outcomes markers of OA on voxel level to determine the extent interconnection between these biomarkers.Methods: Materials
Population: Twenty-one subjects were recruited (age:55.3±9.4years, BMI:26.2±3.6Kg/m2, 13males). Seven subjects had radiographic OA symptoms (Kellgren-Lawrence 2-3). Patient-reported outcome was also measured with KOOS survey7.
Imaging: Simultaneous PET/MRI was acquired on a 3T-TOF-PET/MR GE scanner.
PET: Immediately following intravenous injection of 240 or 340.4Mbq [18F]-NaF, dynamic PET data was acquired for 45mins (30 time-points, variable temporal resolution:10s to 240s). Static PET data was reconstructed from this 45min acquisition.
MRI: Composite T1ρ/T2 imaging was performed using a 3D segmented SPGR sequence (FOV=14cm2, Slice=4mm,22slices,TR=6ms,FA=10,ARC=2x1. Spin-Lock Frequency=500Hz, TSL=0/10/40/80ms, TE=0/12.87/25.69/51.39ms8.
For eight subjects, DCE-MRI was also acquired (IV Gavodist injection) for 3min or 5min with 6s temporal resolution.
Methods: Analysis
Voxel-based relaxometry (VBR)6 was used for statistical parametric mapping (SPM) which involved:
1.Registration of all images at each scan (T1ρ/T2,PET,DCE-MRI) to first echo of T1ρ.
2.Co-registering first echo of T1ρ to a template atlas (determined through minimum deformation analysis).
3.Performing SPM and calculating correlations between parameter pairs for each voxel across the entire cohort.
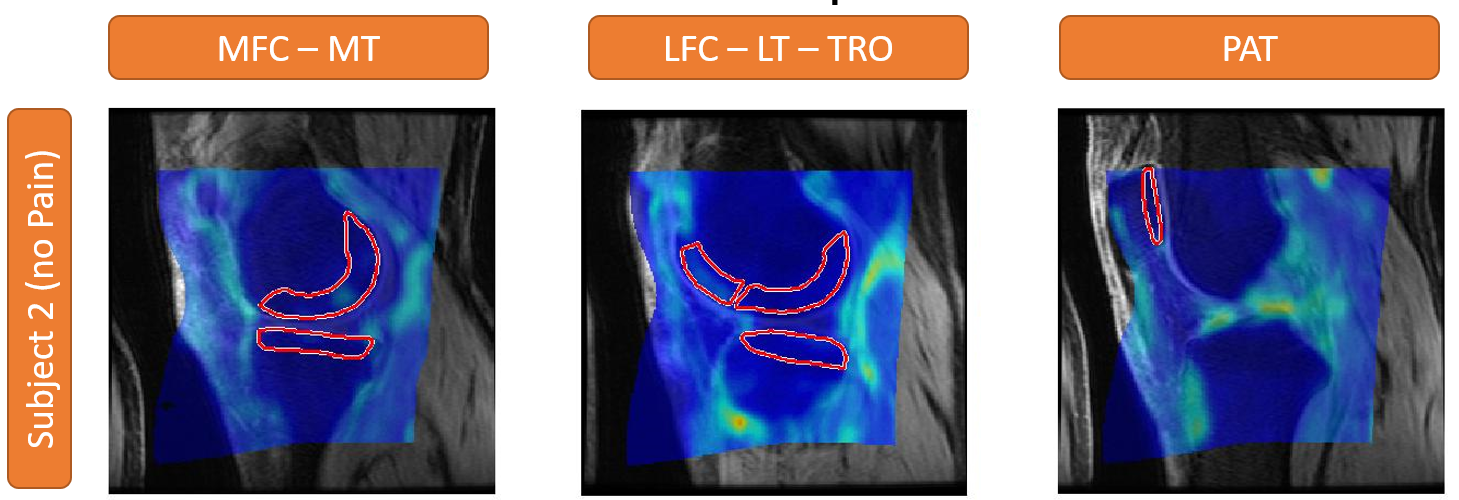
Projection: To determine associations between bone and cartilage biomarkers, each marker was projected onto the bone-cartilage interface (identified from manual bone segmentation). For cartilage markers (MRI), the average parameter value over cross-section of the cartilage perpendicular to the bone-cartilage interface was calculated. For bone markers (PET), an area along the interface was selected (Figure1), and marker was averaged over cross-section perpendicular to the interface.
Static PET: Average standardized Uptake Values (SUVmean) was computed for 45min static PET acquisition using the injected dose and patient weight.
Dynamic PET: Hawkins9 and Patlak10 tracer-kinetic models were used to analyze dynamic PET data. Arterial input function (AIF) was measured by automatically isolating the signal of popliteal artery. Data was then fitted to the model equations. KPat which represents the plasma clearance rate was calculated in Patlak model, and Ki for Hawkins model which represents the net tracer influx rate, were calculated for each projection voxel.
T1ρ/T2 mapping was performed through voxel-by-voxel mono-exponential decay-curve fitting. Maps were then projected to the bone-cartilage surface.
DCE-MRI data at 3 min post-injection was normalized to the baseline DCE-MRI data (representing the contrast agent uptake) and was then projected into the bone-cartilage interface.
ROI-wise analysis: PET uptake was averaged over each bone compartment (Figure1) and correlations between different PET markers were calculated.
Results
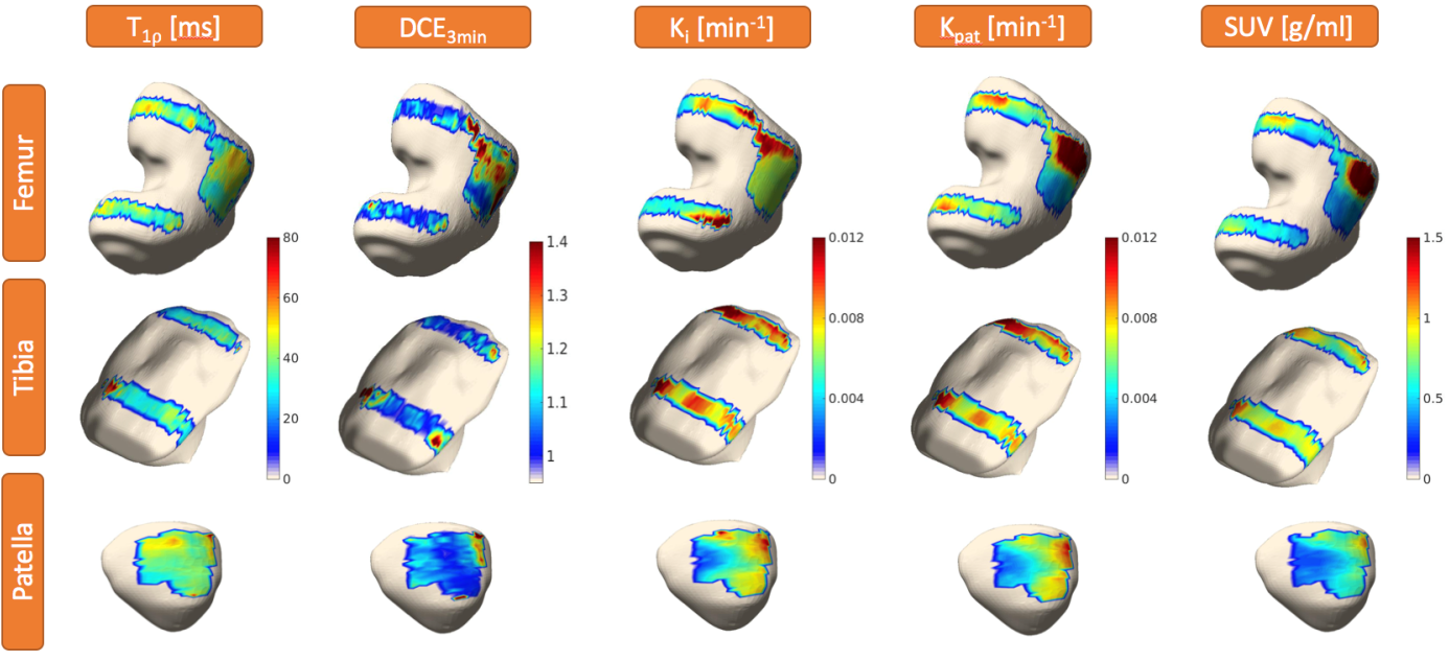
Figure2 shows parametric maps of Ki,Kpat,SUVmean,T1ρ,DCE3min for a representative subject, projected on knee bones (Femur, Tibia, Patella). VBR was used to calculate local Pearson partial correlation (adjusted for age/gender/BMI) to study the associations between bone remodeling and cartilage degenerations. Figure3 shows the correlation map between various combinations of the PET/MRI/KOOS biormarkers for entire cohort.
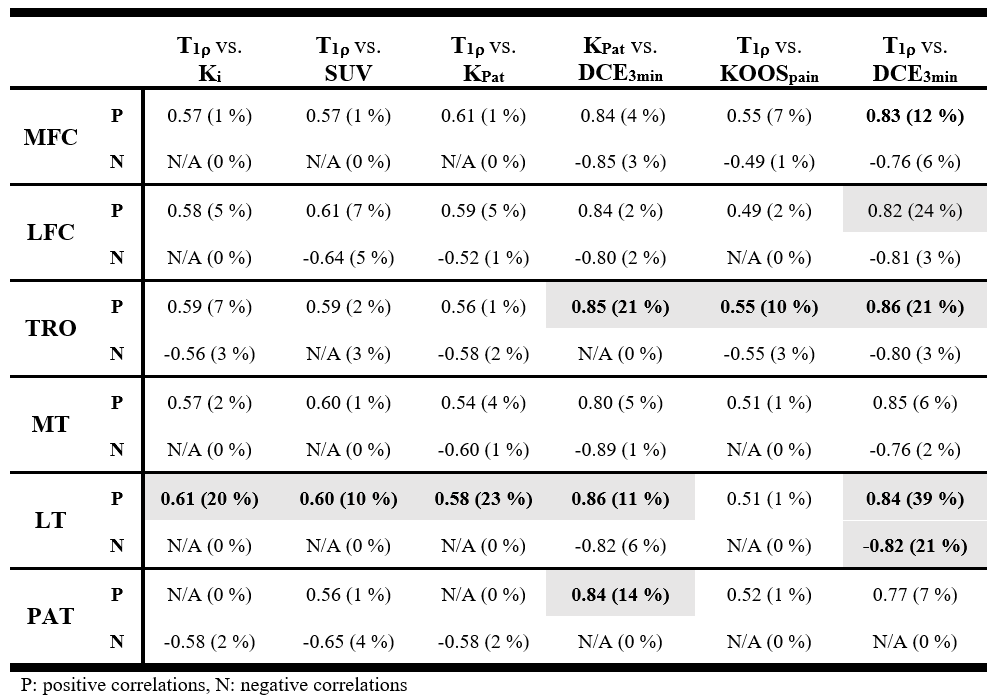
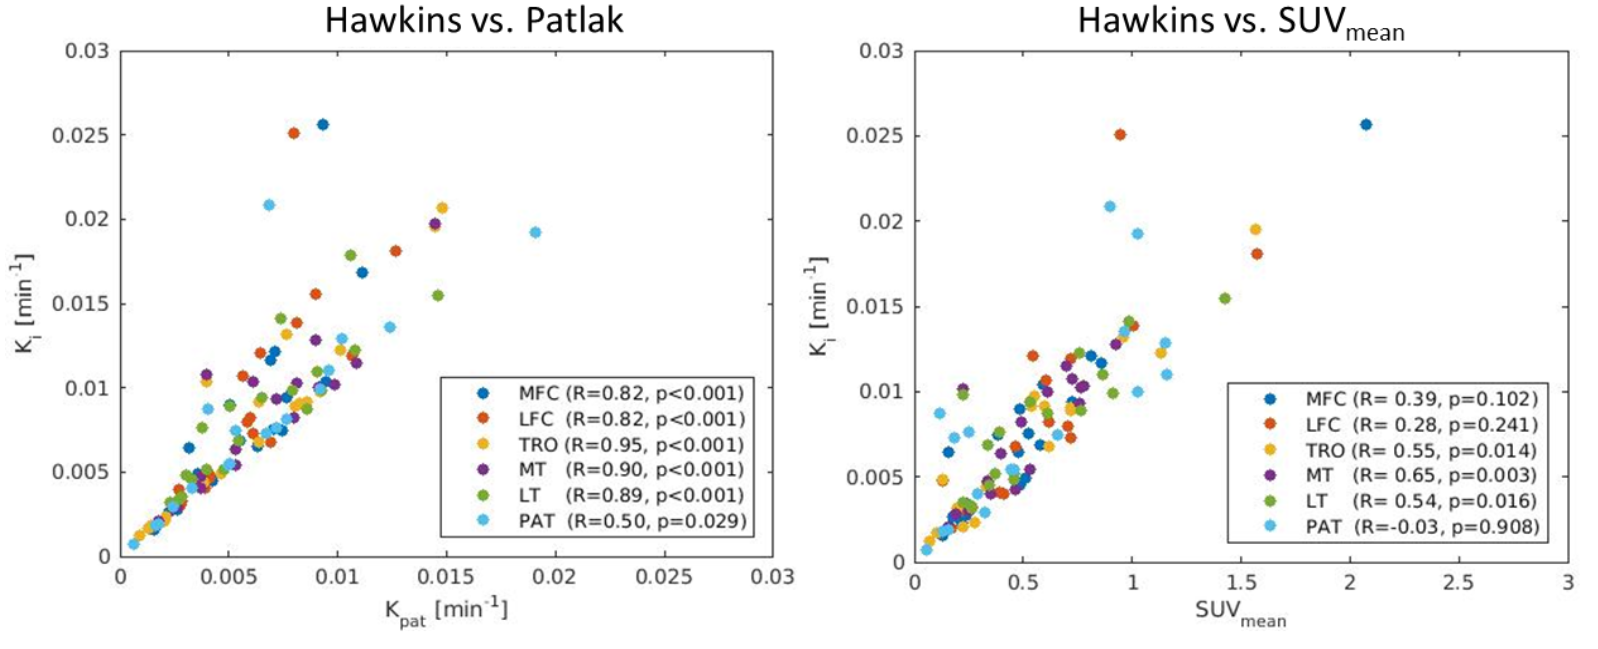
In addition to voxel-wise analysis, correlations between bone PET markers over each compartment were also calculated (Figure4) showing very high correlations between them. Table1 reports the correlations of biomarker pairs for 6 knee compartments: Medial Femoral Condyle (MFC), Lateral Femoral Condyle (LFC), Trochlea (TRO), Medial Tibia (MT), Lateral Tibia (LT), and Patella (PAT). For each compartment the percentage of voxels with statistically significant (p<0.05) correlations, and average correlation coefficient of significant voxels are reported.
Discussions
There was a very high correlation between PET bone biomarkers: Ki/Kpat/SUVmean (Figure4) which demonstrates that the main driver of changes in these markers is the rate of tracer uptake in the bone.
When considering entire knee compartments for associations, only one compartment (LT) demonstrated a substantial fraction of voxels with statistically significant correlations between the bone markers and cartilage biochemical composition (T1ρ). Similarly, for correlations between cartilage markers (DCE3min) and KOOSpain score and bone markers, few compartments demonstrate higher than 10% of voxels with significant correlations. These results show that when considering the entire compartment, markers of bone/cartilage/pain are not correlated for most compartments.
However, when considering local regions of each compartment (figure3), there were sub-regions in which bone and cartilage changes were happening concurrently and their markers demonstrated high correlation. These multi-parametric OA biomarkers provide a more thorough assessment of metabolic/morphological changes in OA, providing new insight into OA progression which could potentially lead to new treatments.
Acknowledgements
This study was funded by GE healthcare and NIH - P50AR060752.References
1. Lohmander, L. S. Articular cartilage and osteoarthrosis. The role of molecular markers to monitor breakdown, repair and disease. J. Anat. 184, 477–492 (1994).
2. Radin, E. L. & Rose, R. M. Role of Subchondral Bone in the Initiation and Progression of Cartilage Damage. Clin. Orthop. Relat. Res. 213, (1986).
3. Burr, D. B. & Gallant, M. A. Bone remodelling in osteoarthritis. Nat. Rev. Rheumatol. 8, 665–673 (2012). 4. Savic, D. et al. Imaging Bone–Cartilage Interactions in Osteoarthritis Using [(18)F]-NaF PET-MRI. Mol. Imaging 15, 1536012116683597 (2016). 5. Kogan, F. et al. PET/MRI of metabolic activity in osteoarthritis: A feasibility study. J. Magn. Reson. Imaging 45, 1736–1745 (2017).
6. Pedoia, V., Li, X., Su, F., Calixto, N. & Majumdar, S. Fully automatic analysis of the knee articular cartilage T1ρ relaxation time using voxel-based relaxometry. J. Magn. Reson. Imaging 43, 970–980 (2016).
7. Roos, E. M., Roos, H. P., Lohmander, L. S., Ekdahl, C. & Beynnon, B. D. Knee Injury and Osteoarthritis Outcome Score (KOOS)--development of a self-administered outcome measure. J. Orthop. Sports Phys. Ther. 28, 88–96 (1998).
8. Li, X. et al. Simultaneous Acquisition of T 1 r and T 2 Quantification in Knee Cartilage : Repeatability and Diurnal Variation. J. Magn. Reson. Imaging 39, 1287–1293 (2014).
9. Hawkins, R. a et al. Evaluation of the skeletal kinetics of fluorine-18-fluoride ion with PET. J. Nucl. Med. 33, 633–42 (1992).
10. Patlak, C. S., Blasberg, R. G. & Fenstermacher, J. D. An evaluation of errors in the determination of blood flow by the indicator fractionation and tissue equilibration (Kety) methods. J. Cereb. Blood Flow Metab. 4, 47–60 (1984).
Figures