1240
Longitudinal Evaluation of Glioblastoma (GBM) Response to Chemo-radiation with Quantitative Magnetization Transfer (qMT)1Physical Sciences, Sunnybrook Research Institute, Toronto, ON, Canada, 2Radiology & Biomedical Imaging, University of California, San Francisco, San Francisco, CA, United States, 3Radiation Oncology, Sunnybrook Health Sciences Centre, Toronto, ON, Canada
Synopsis
Assessing
Purpose
To characterize GBM response to concurrent radiotherapy and chemotherapy with quantitative MT (qMT).Introduction
Glioblastoma (GBM) is the most common malignant primary brain tumor in adults and has a dismal survival rate1,2. GBM patients are treated with a combination of surgical resection, radiotherapy and chemotherapy3. Advanced quantitative MRI biomarkers may identify non-responders early and allow for change or adjustment of the therapy.Materials & Methods
Patients: 19 patients were recruited (REB approved) and were treated for six weeks with concurrent radiation (2Gy/day) and daily Temozolomide. Patients were MRI-scanned 4 times:
1. before treatment (Day0),
2. After 10 treatment sessions (Day14),
3. After 20 treatment sessions (Day28),
4. One month after last treatment day (Day70).
MRI: was performed on a 3T Philips Achieva scanner. An axial slice passing through the tumor was imaged with TFE (TR/TE=7.78/4.5ms, Matrix=144×144, FOV=20×20cm, slice=3mm).
qMT acquisition: Six MT spectrums were acquired. MT preparation involved 2 & 4 block pulses of 242.5ms each (total duration=970ms & 485ms), and for each duration three RF powers of 1.5/3/5µT were used. MT spectrum covered 250Hz to 100kHz with 14 offsets (with equal log scale separation).
Analysis: All images (MT, T1, T2, post Gd-T1w, FLAIR were co-registered to the first acquired MT image. Tumor ROI was identified at each scan on the post-Gd T1w. Metrics were calculated voxel-by-voxel and then averaged over tumor ROI.
qMT Modeling: The six MT spectrums were fit to the two-pool MT model proposed by Henkelman4 in transient state, and the four model [R, T2b, RM0b/Ra, 1/(RaT2a)] were calculated where RM0b/Ra, M0b, R represent amount of magnetization transfer, macromolecular pool size, and exchange rate.
Results
Tumor progression was determined by an oncologist blinded to the MRI analysis at 3-8 months after the end of the 6-week chemo-radiation treatment and was based on clinically used RANO criteria. Data of three patients were discarded due to incomplete scans or presence of imaging artifacts. Six patients had tumor progression (progressors cohort), the other 10 patients were classified as non-progressors.
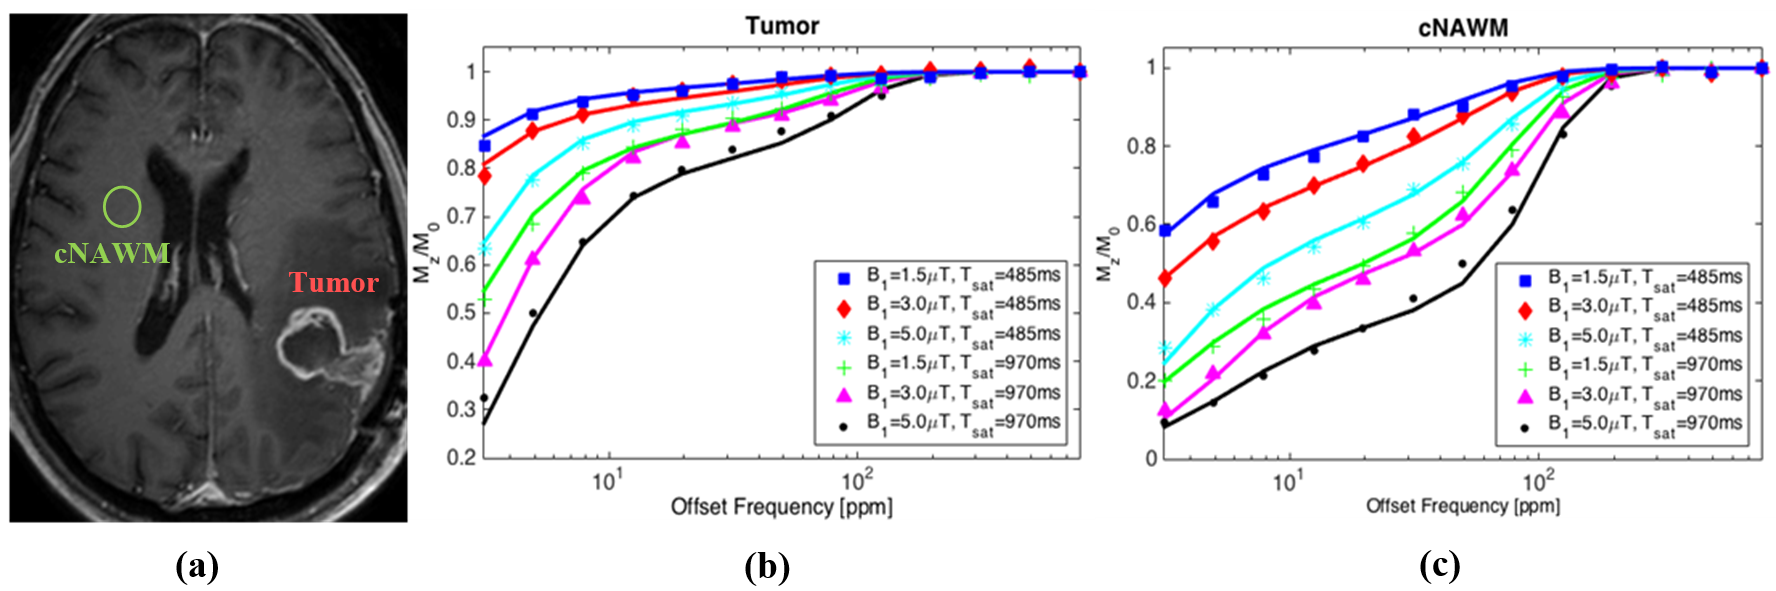
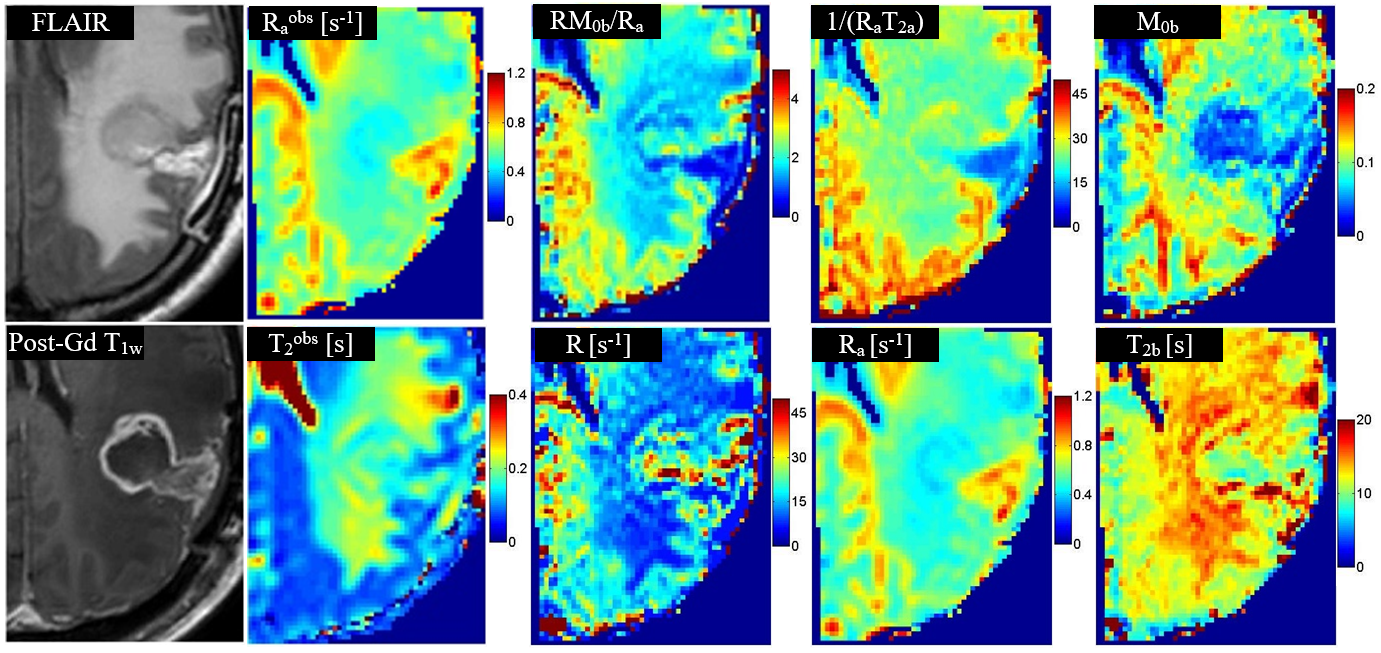
Figure1 shows the six MT spectrums as well as the fit to the data for a representative patient. Figure2 shows the qMT parametric maps for a representative patient. Raobs and T2obs are the observed longitudinal and transverse relaxations of the tissue and were measured independent of the qMT.
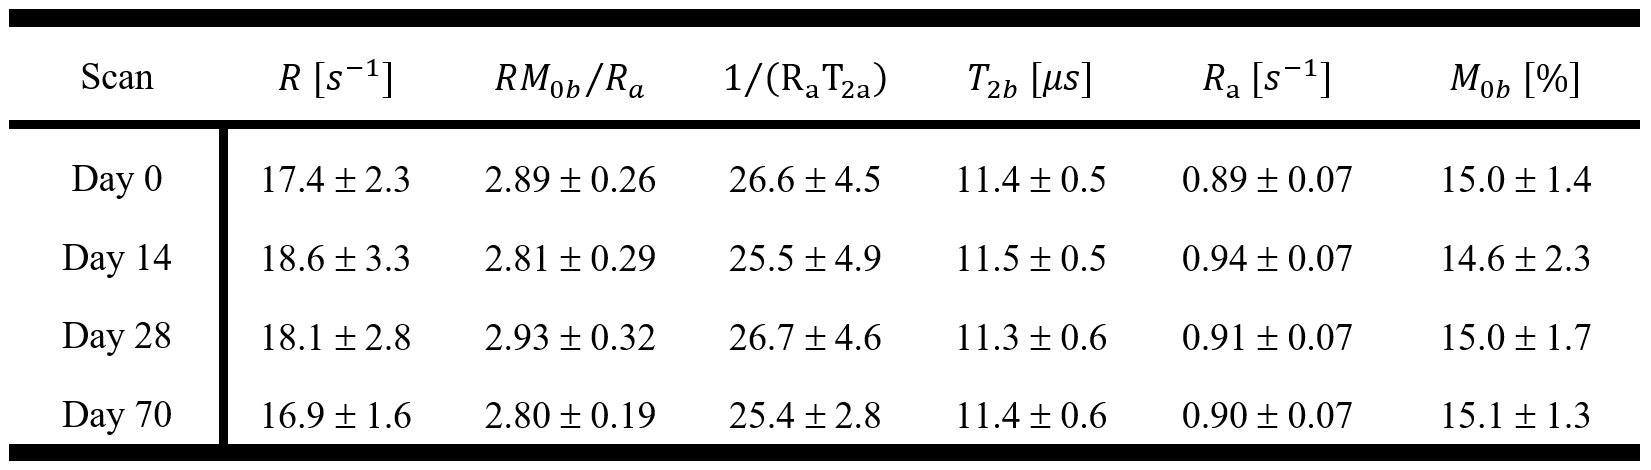
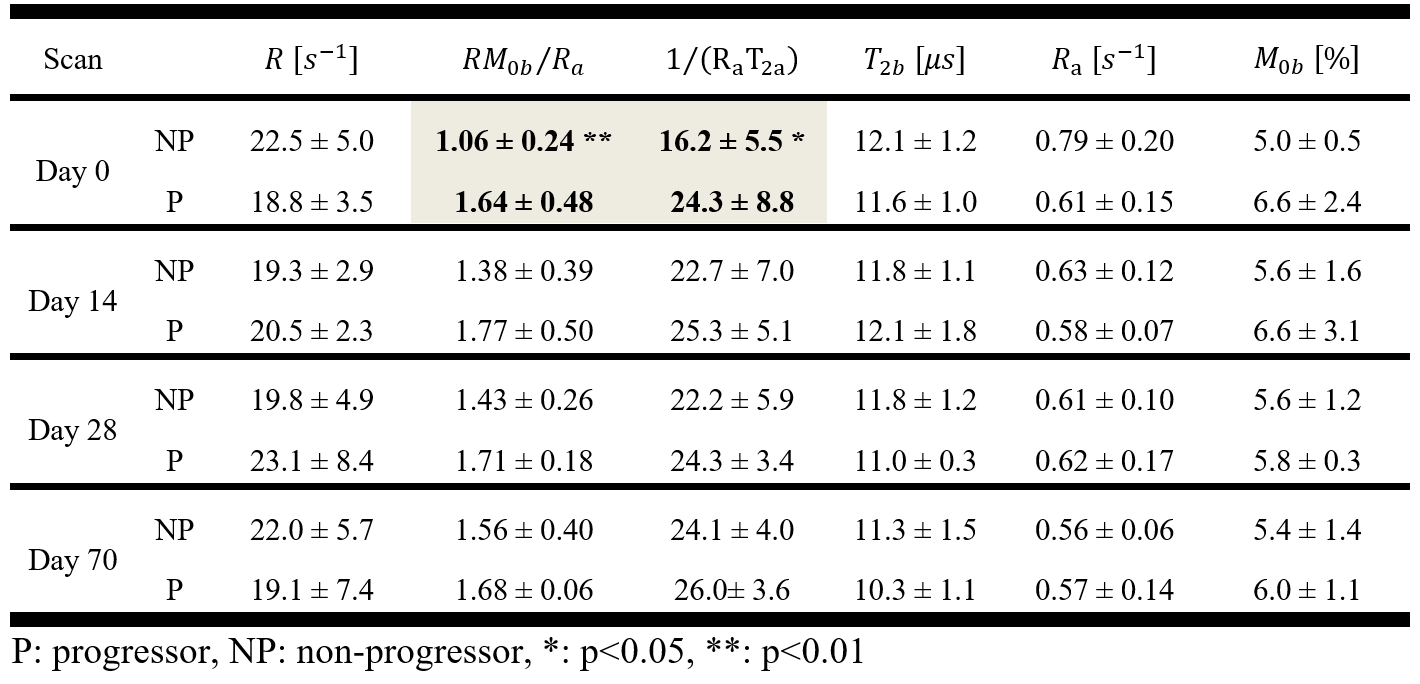
Table1 reports the qMT parameters for contralateral normal-appearing white matter (cNAWM) of the patients. Table2 reports qMT model parameters for tumor ROI showing at baseline (Day0) amount of MT, RM0b/Ra (p=0.006), and direct effect of the free water pool, 1/(RaT2a) (p=0.038), were different between progressors and non-progressors.
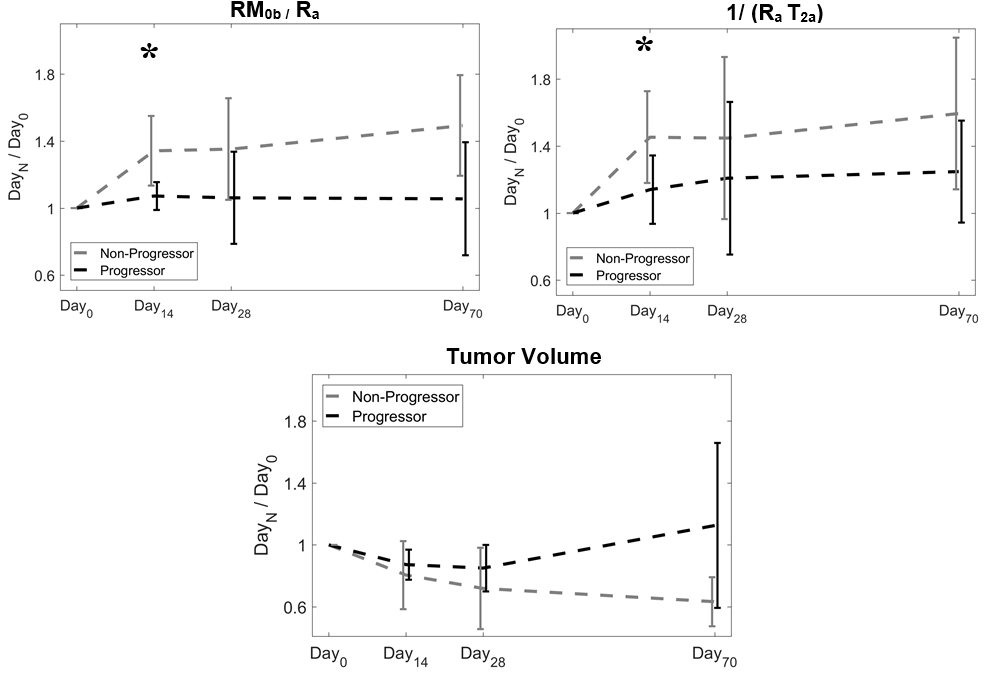
Figure 3 plots the ratio of each metric at each time point over its value at Day0 for RM0b/Ra, and 1/(RaT2a). The ratio represents the change in these parameters.
Discussions
Tables 1,2 show that the amount of MT in GBM tumors was smaller than cNAWM ( RM0b/Ra,GBM= 1.28±0.44, RM0b/Ra,cNAWM = 2.89±0.26, p<0.001). There was a statistically significant difference in RM0b/Ra between progressors and non-progressors before the start of the treatment (Day0). Non-progressors had a lower amount of MT at baseline and treatment resulted in a large increase in this parameter. However, for progressors, the amount of MT was higher and the treatment was not able to change it significantly (figure3).
Moreover, the direct effect of the free water pool, 1/(RaT2a), was lower in non-progressors. Considering Ra is not different between the two cohorts, thus, T2a was higher in non-progressors, suggesting they had higher water content and lower cellular density. These results demonstrate the ability of qMT in determining GBM tumors that are resistant to standard chemo-radiation even before the start of the treatment.
The ratio of each qMT parameter at each time point over its baseline (Day0) value represented the treatment-induced changes in the tumor. Figures3 shows the change (between Day14 and Day0) in the amount of MT (relative RM0b/Ra,Non-progressor=1.34±0.21, relative RM0b/Ra,Progressor=1.07±0.08 p=0.031), and the direct effect of the free water pool at Day14 (relative 1/(RaT2a),Non-progressor=1.45±0.27, relative 1/(RaT2a),Progressor=1.14±0.20, p=0.049) were statistically significantly different between progressors and non-progressors. These two parameters reflect the qMT properties of both proton pools in the qMT model ( RM0b/Ra for the bound macromolecular pool and 1/(RaT2a) for the free water pool), showing that chemo-radiation treatment of GBM is affecting both pools.
Conclusions
qMT characteristics of GBM are more sensitive to treatment effects compared to clinically used metrics. qMT could assess tumor aggressiveness and identify progressors before treatment. Changes in qMT parameters within the first 14 days of treatment were capable of separating progressors from non-progressors, making qMT a promising biomarker to guide adaptive radiotherapy for GBM.Acknowledgements
This study was funded by Terry Fox Research Institute (TFRI project 1034), Canadian Cancer Society Research Institute (CCSRI 701640) and Brain Canada grant (CCSRI 705083).References
1. Ryken, T. C. et al. The role of imaging in the management of progressive glioblastoma: A systematic review and evidence-based clinical practice guideline. J. Neurooncol. 118, 435–460 (2014).
2. Koshy, M. et al. Improved survival time trends for glioblastoma using the SEER 17 population-based registries. J. Neurooncol. 107, 207–212 (2012).
3. Olson, J. J. & Ryken, T. Guidelines for the treatment of newly diagnosed glioblastoma: introduction. Journal of neuro-oncology 89, 255–258 (2008).
4. Henkelman, R. M. et al. Quantitative interpretation of magnetization transfer. Magn. Reson. Med. 29, 759–766 (1993).
Figures