1239
Evaluating patients with Glioma using Multi-modal Hyperpolarized C-13 and H-1 Metabolic Imaging1University of California San Francisco, San Francisco, CA, United States, 2Chonam National University Medical School and Hospital, Chonam, Republic of Korea
Synopsis
Gliomas are heterogeneous and infiltrative brain tumors. Noninvasive evaluation of the extent and activity of tumor is important for making decisions about how to manage patients with glioma. In this study, we are examining the relationship between dynamic hyperpolarized C-13 data and H-1 MRSI parameters. Eleven patients with glioma were studied with both hyperpolarized [1-13C]pyruvate imaging and 3D H-1 lactate-edited MRSI. The H-1 data were affinely registered to the C-13 data, which allows voxel-by-voxel comparison. While these initial results indicate that there may be a trend towards an inverse relationship between C-13 lactate/pyruvate and steady state normalized lactate within the choline-to-NAA (CNI) lesion, further analysis is needed in a larger population of patients.
INTRODUCTION
Gliomas are heterogeneous and infiltrative brain tumors. Noninvasive evaluation of the extent and activity of tumor is important for making decisions about how to manage patients with glioma. Proton (H-1) MRSI has been applied to assess the spatial extent and metabolic properties of abnormalities for patients with glioma. The choline-to-NAA index (CNI) has been shown to be more sensitive in differentiating tumor from non-tumor than levels of individual metabolites (1). The levels of lactate and lipid within the metabolic lesions defined using CNI are able to monitor response to treatment and predict outcome (2, 3). Hyperpolarized C-13 metabolic imaging is a new molecular imaging modality that provides real-time metabolism and has been evaluated in patients with glioma previously for its feasibility and safety (4). In this study, we examined the relationship between dynamic hyperpolarized C-13 and H-1 MRSI parameters and explored the value of combining these two metabolic methodologies.METHODS
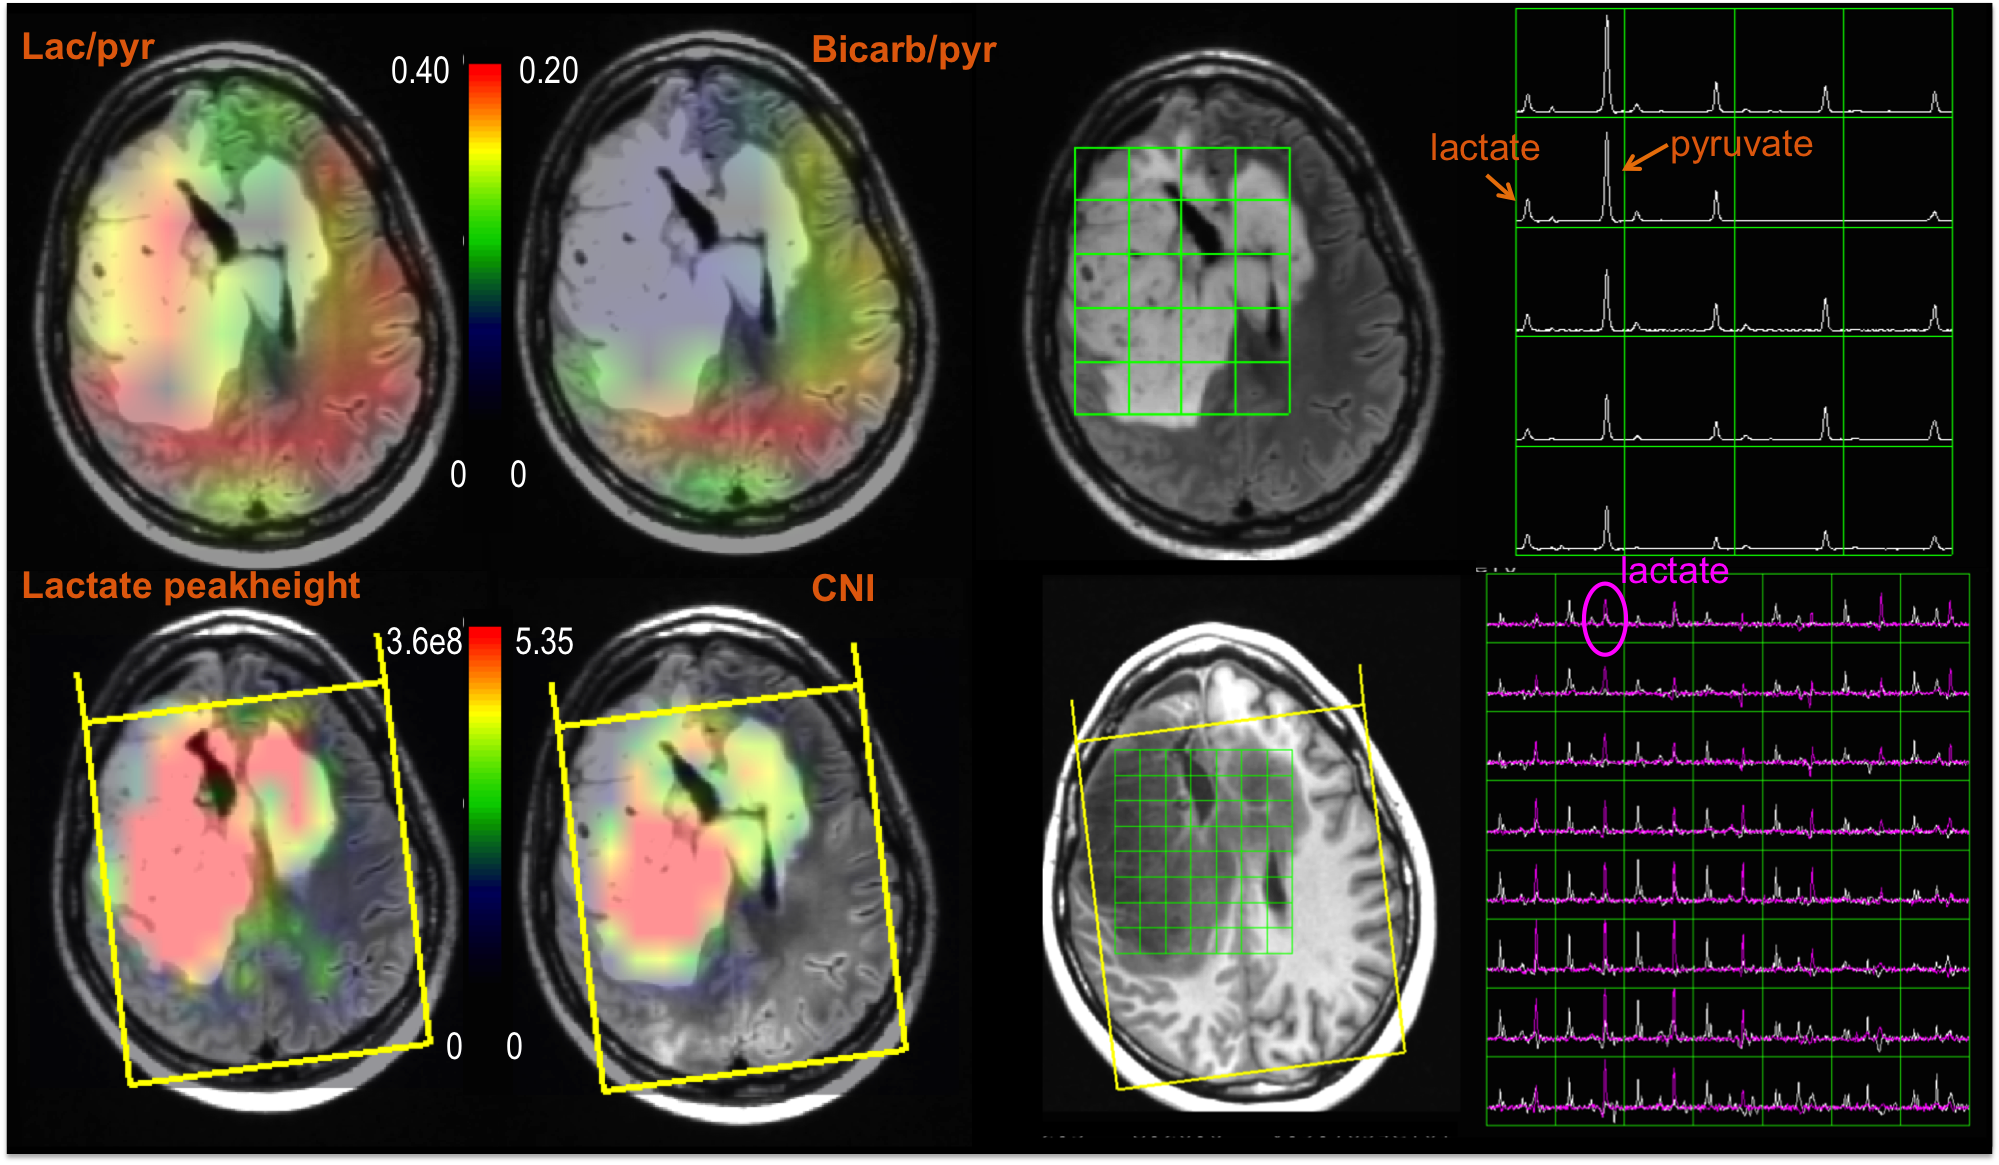
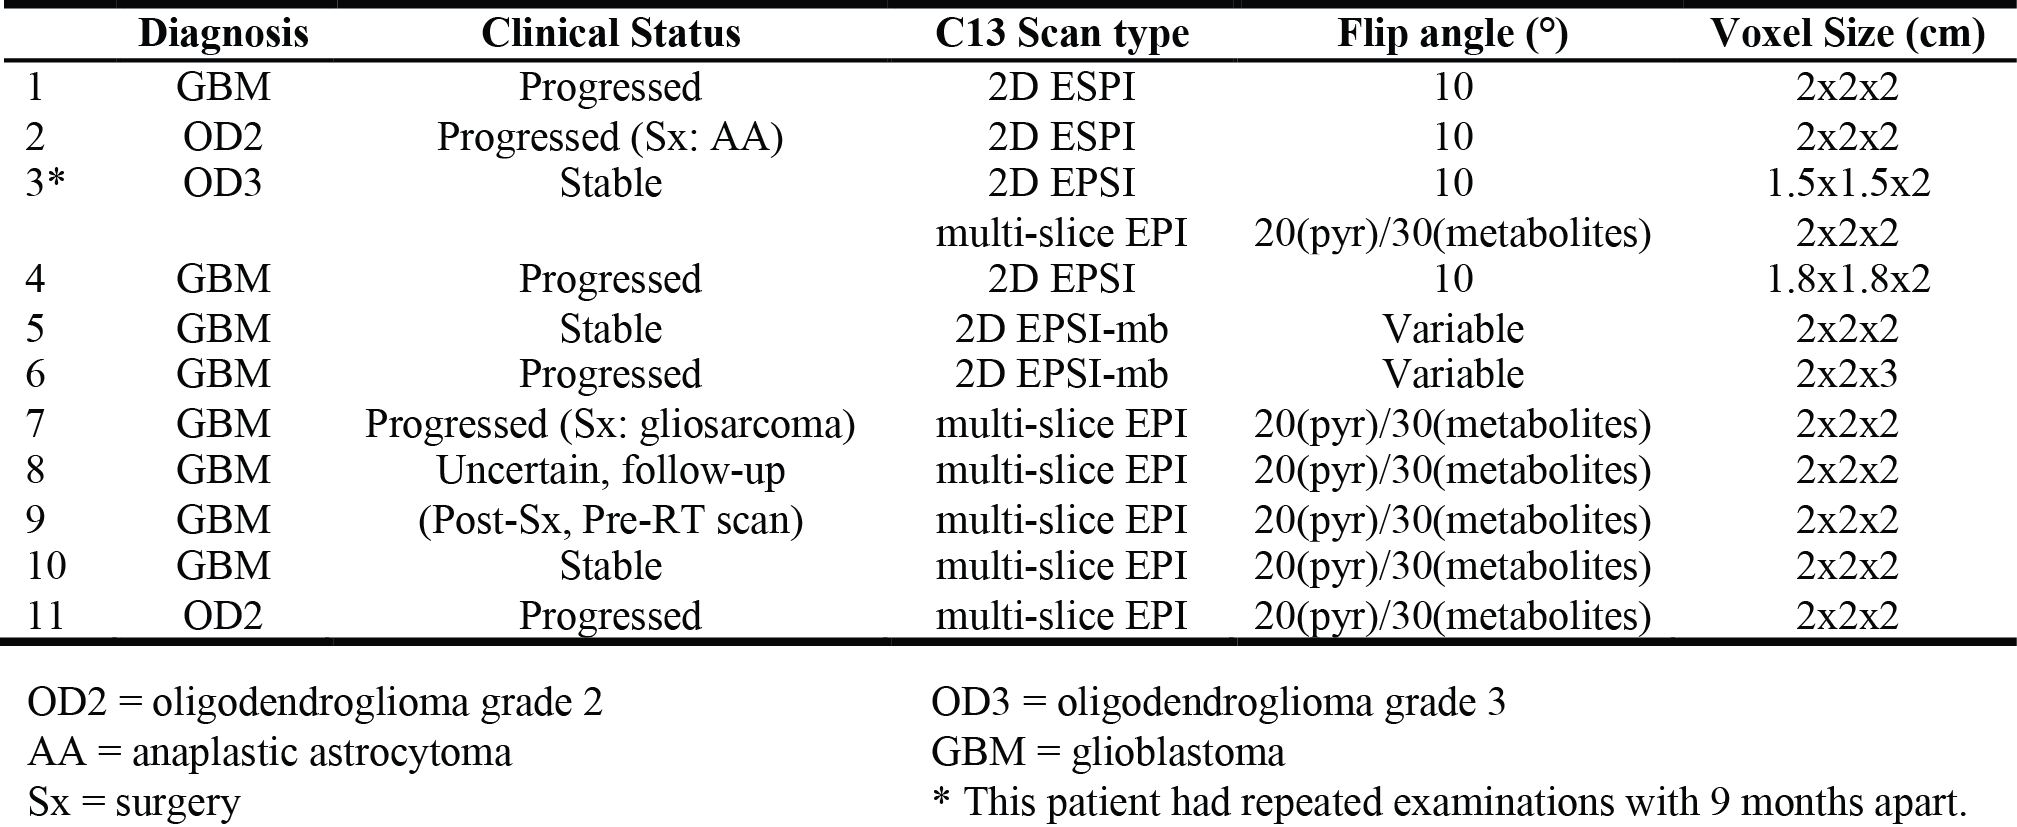
Eleven patients with glioma were recruited into the study and the characteristics of the patient population are summarized in Table 1. All MR scans were performed on a GE 3T scanner. Reference anatomic images and T2-weighted FSE images were acquired using the H-1 body coil in order to define the volume of interest and image registration. The C-13 data were obtained after injecting sterile [1-13C]pyruvate using either a clamshell volumetric C-13 transmit coil with bilateral 8-channel receive coil or 32-channel receive array with integrated preamps and a high-power transmit coil (5). Dynamic C-13 data were acquired with 2D EPSI (constant or variable flip angles, single slices) (6,7) or multi-slice EPI (8) (8 contiguous 2 cm slices) with 3s time resolution and 20-24 time-points (Table 1). Ratios of lactate/pyruvate (lac/pyr) and bicarbonate/pyruvate (bicarb/pyr) were considered in the analysis. The proton images and spectra were obtained after replacing the 13C coils with a 32-channel head coil. These included pre- and post-contrast T1-weighted SPGR, T2-weighted FLAIR, and 3D lactate-edited H-1 MRSI (9). The FLAIR images were affinely registered to the FSE images from the C-13 examination for each subject. The corresponding transformation matrix was then applied to the center of the excitation volume of H-1 spectra and metabolite maps (Figure 1). Regions of interest include the area with T2 hyperintensity, normal appearing white matter (NAWM) and CNI2 (regions with CNI> 2). Normalized lactate (nLac, lactate/median NAANAWM), Cho/NAA and CNI were estimated on a voxel-by-voxel basis. Voxels within the brain and having (H-1 and C-13) lactate SNR greater than 10.0 were considered in the analysis.RESULTS/DISCUSSION
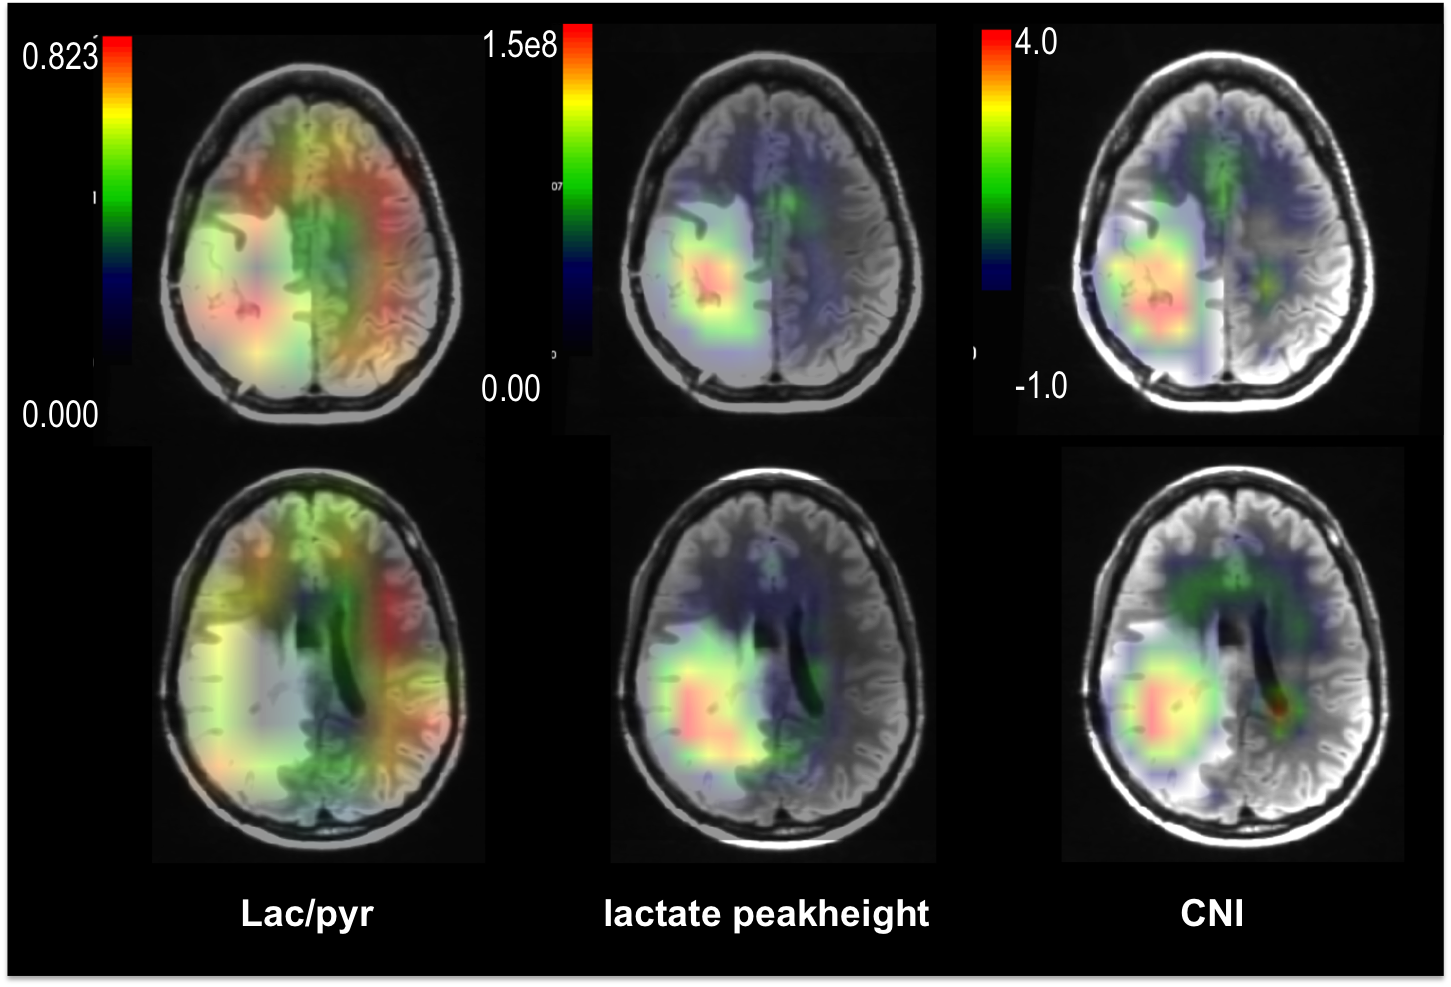
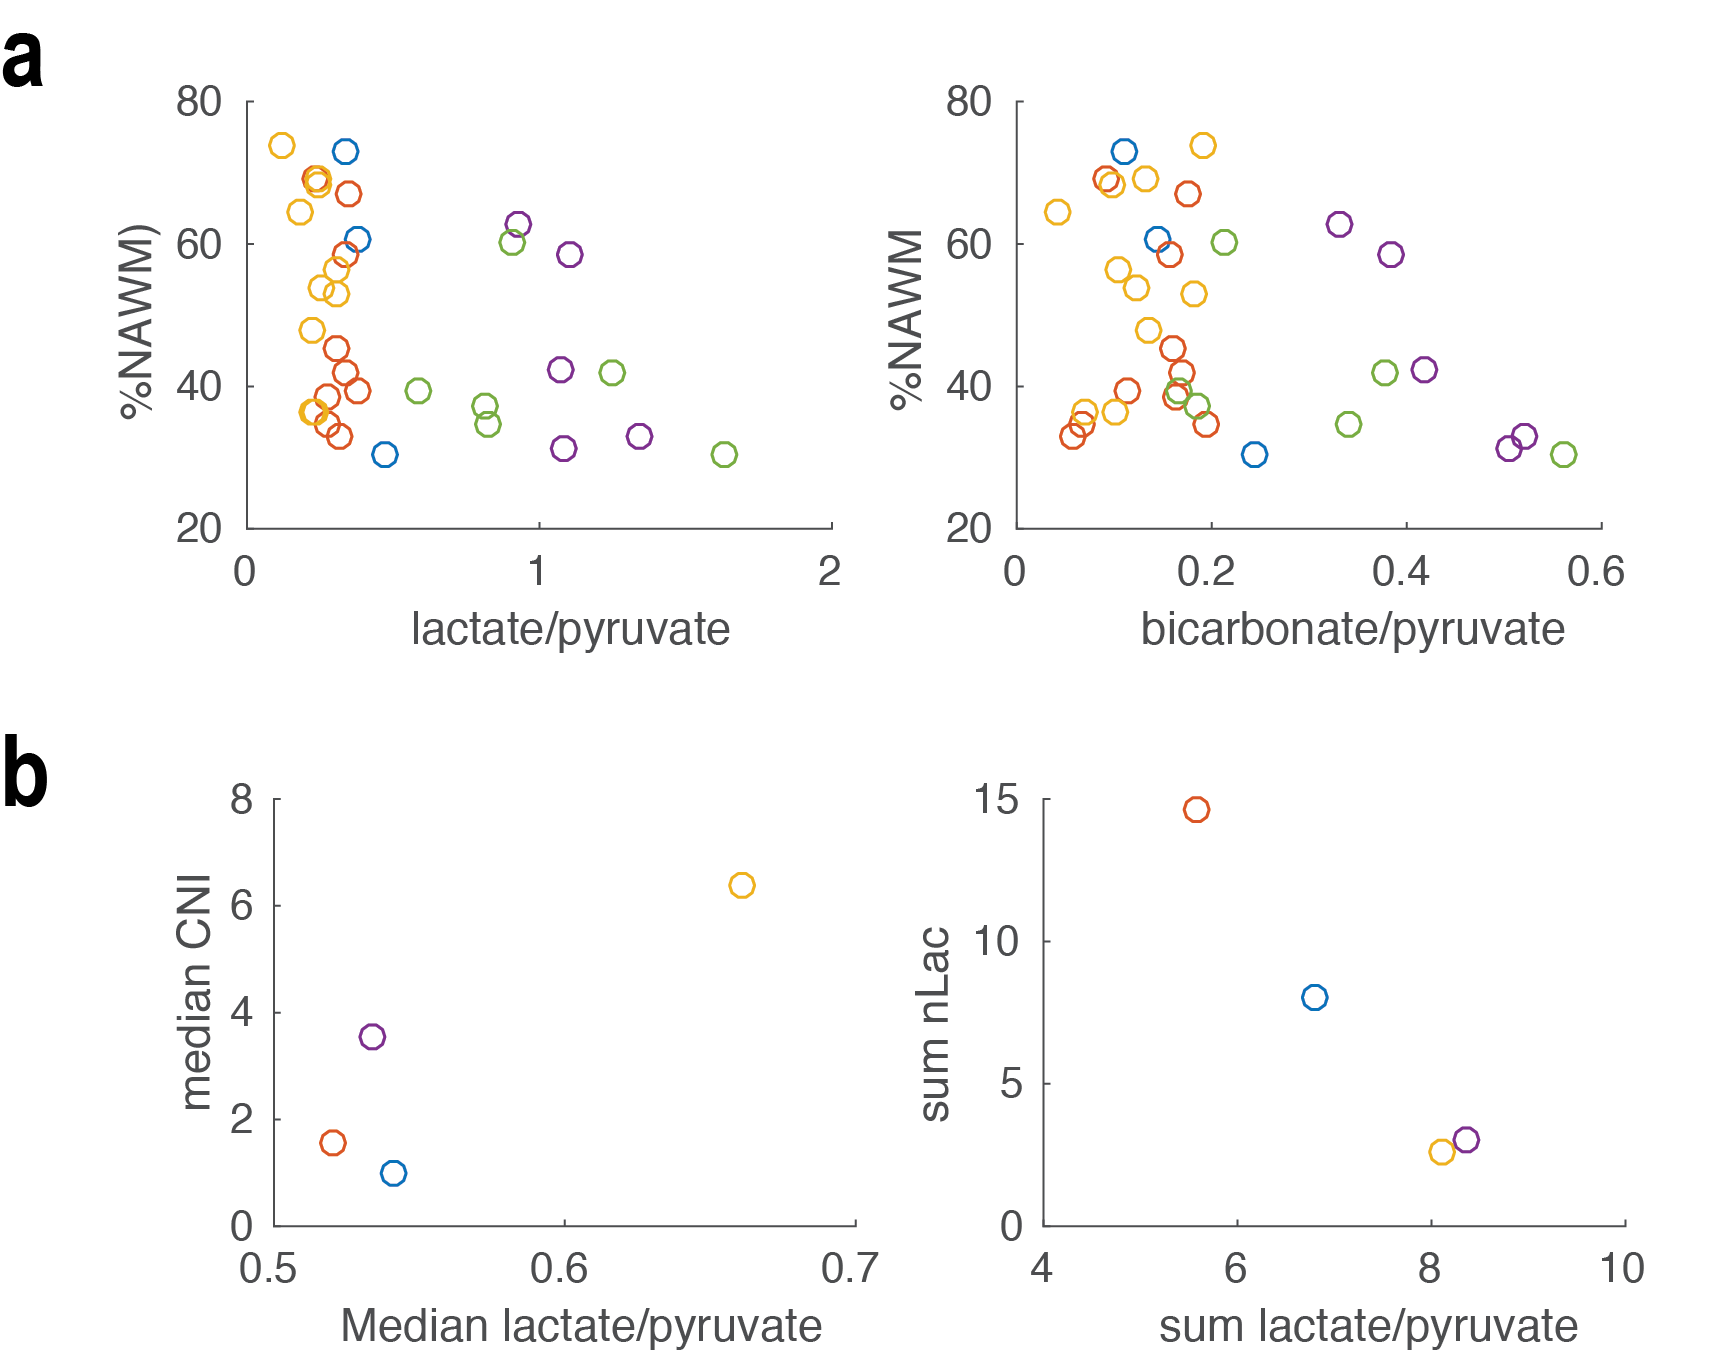
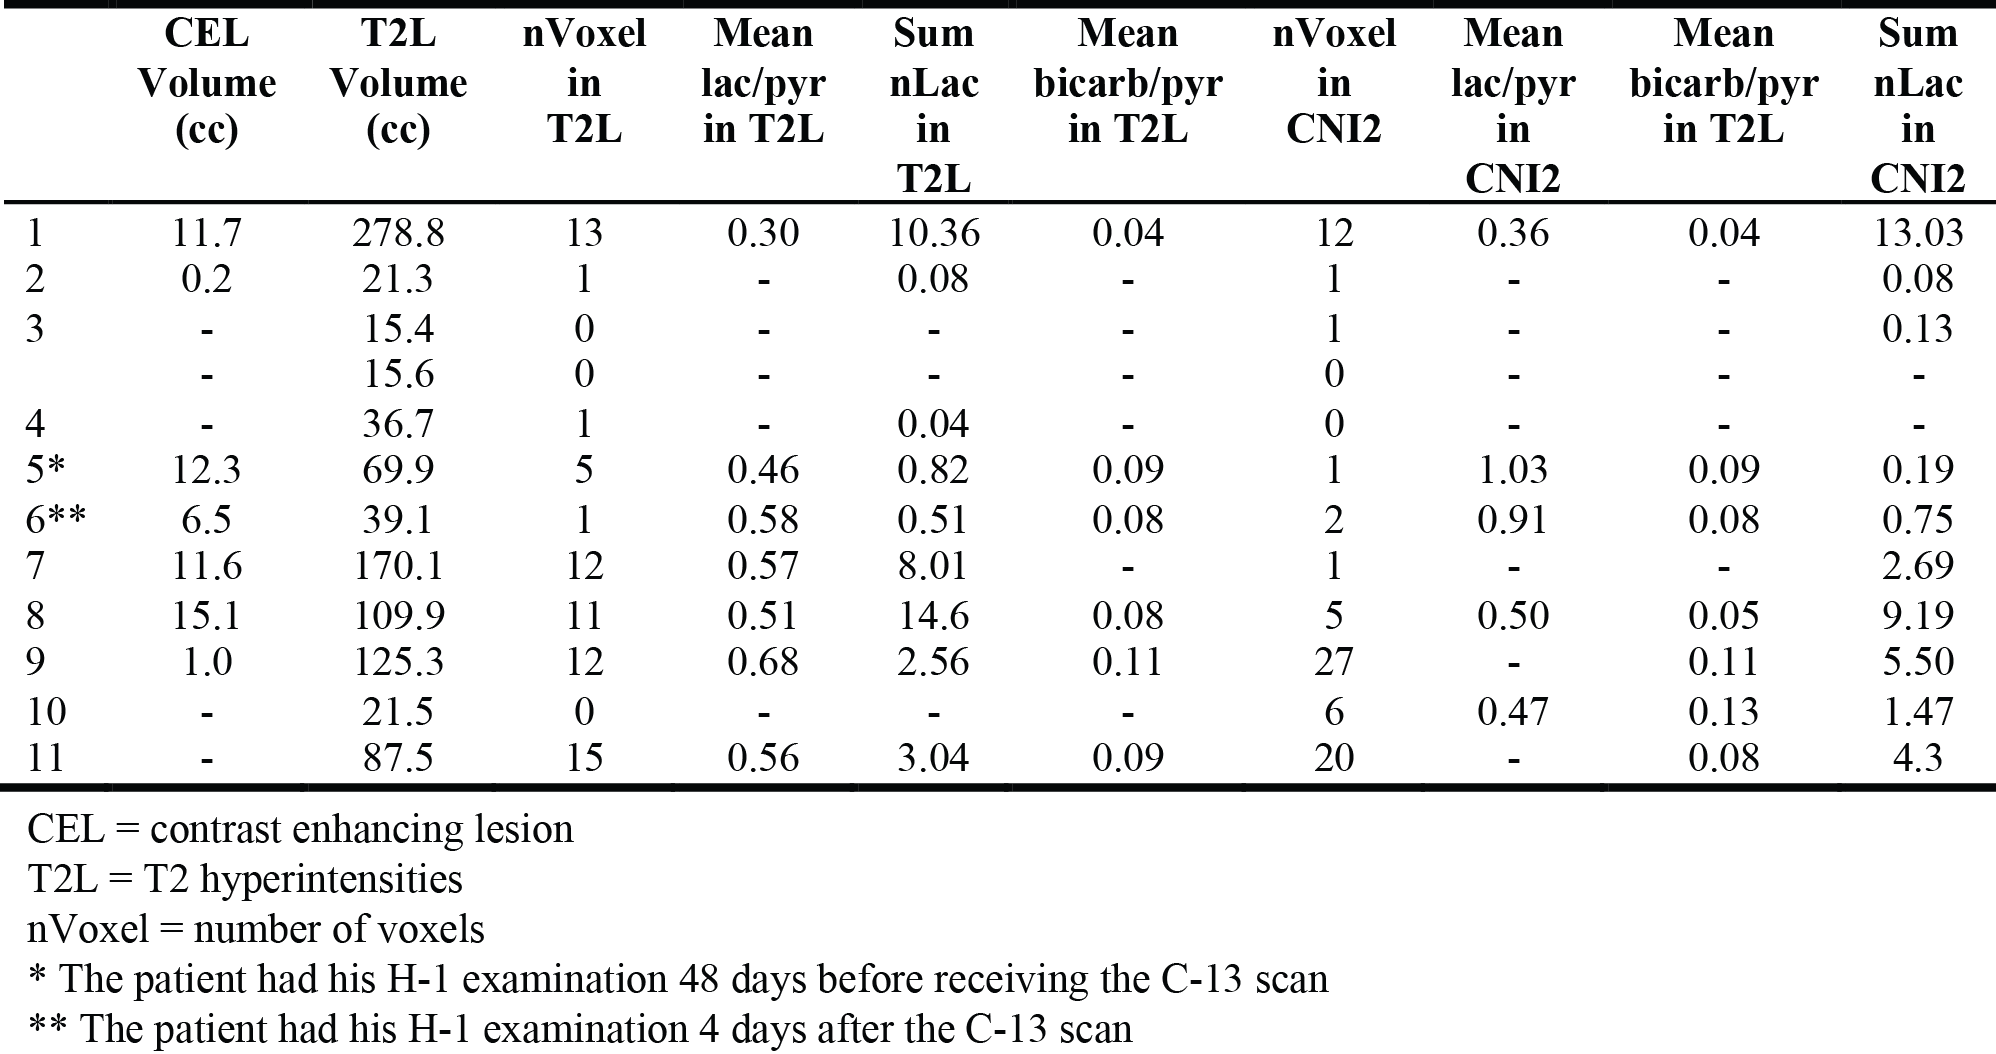
Figures 1 and 2 show examples of C-13 and H-1 data from two patients (#1, #7). The H-1 data were successfully registered and resampled to the C-13 data. The CNI values and levels of steady state lactate from H-1 lactate-edited MRSI were elevated in the lesion, while there was reduced 13C bicarbonate and similar or lower 13C lactate in the summed spectra compared with NAWM. The abnormal anatomic and metabolic parameters are given in Table 2 for each patient. The volumes of the anatomic and metabolic lesion varied between patients, and using multi-slice EPI sequence allowed improved coverage of the lesion of interest. For patients #1-#6 (who had EPSI C-13 scans and smaller tumor volumes), the percentages of NAWM within each voxel in the NAWM were plotted against the levels of lac/pyr and bicarb/pyr in Figure 3a, while the two types of metabolic parameters were plotted in the T2 hyperintensities for patients #7-#12 (who had multi-slice EPI scans) in Figure 3b. Although the initial results in Figure 3 indicate that there may be a trend towards an inverse relationship between C-13 lac/pyr and steady state nLac within the CNI lesion, further analysis is needed in a larger population of patients.Acknowledgements
This research was supported by NIH Grants R01 CA127612, P01 CA118816 and P41 EB0341598.References
(1) McKnight TR, Noworolski SM, Vigneron DB, Nelson SJ. An automated technique for the quantitative assessment of 3D-MRSI data from patients with glioma. Journal of magnetic resonance imaging: JMRI. 2001;13(2):167-77.
(2) Li Y, Lupo JM, Parvataneni R, Lamborn KR, Cha S, Chang SM, Nelson SJ. Survival analysis in patients with newly diagnosed glioblastoma using pre- and postradiotherapy MR spectroscopic imaging. Neurooncology. 2013;15(5):607-17.
(3) Nelson SJ, Li Y, Lupo JM, Olson M, Crane JC, Molinaro A, Roy R, Clarke J, Butowski N, Prados M, Cha S, Chang SM. Serial analysis of 3D H-1 MRSI for patients with newly diagnosed GBM treated with combination therapy that includes bevacizumab. Journal of neuro-oncology. 2016. doi: 10.1007/s11060-016-2229-3. PubMed PMID: 27535746.
(4) Park I, Larson PE, Gordon J, Carvajal L, Chen H, VanCriekinge M, Bok R, Crane JC, Elkhaled A, Phillips J, Slater JB, Ferrone M, Kurhanewicz J, Vigneron DB, Chang S, Nelson SJ, editors. Dynamic Hyperpolarized 13C metabolic imaging of patients with brain tumors. Proceedings of the 25th Annual Meeting of ISMRM; 2017; Honolulu, Hawaii.
(5) Mareyam A, Carvajal L, Xu D, Gordon J, Park I, Vigneron DB, Nelson SJ, Stockmann JP, Keil B, Wald LL, editors. 31-channel brain array for hyperpolarized 13C imaging at 3T. Proceedings of the 25th Annual Meeting of ISMRM; 2017; Honolulu, Hawaii.
(6) Larson PE, Hu S, Lustig M, Kerr AB, Nelson SJ, Kurhanewicz J, Pauly JM, Vigneron DB. Fast dynamic 3D MR spectroscopic imaging with compressed sensing and multiband excitation pulses for hyperpolarized 13C studies. Magnetic resonance in medicine. 2011;65(3):610-9.
(7) Park I, Larson PE, Tropp JL, Carvajal L, Reed G, Bok R, Robb F, Bringas J, Kells A, Pivirotto P, Bankiewicz K, Vigneron DB, Nelson SJ. Dynamic hyperpolarized carbon-13 MR metabolic imaging of nonhuman primate brain. Magnetic resonance in medicine. 2014;71(1):19-25.
(8) Gordon J, Feng Y, Shin P, Vigneron DB, Larson PE, editors. 3D Hyperpolarized C-13 EPI with Calibrationless Parallel Imaging. Proceedings of the 25th Annual Meeting of ISMRM; 2017; Honolulu, Hawaii.
(9) Park I, Chen AP, Zierhut ML, Ozturk-Isik E, Vigneron DB, Nelson SJ. Implementation of 3 T lactate-edited 3D 1H MR spectroscopic imaging with flyback echo-planar readout for gliomas patients. Annals of biomedical engineering. 2011;39(1):193-204.
Figures