1238
MRI Predictors of Response to Pembrolizumab, Bevacizumab and Hypofractionated Stereotactic Irradiation in Patients with Recurrent High Grade Gliomas1Cancer Imaging & Metabolism, Moffitt Cancer Center, Tampa, FL, United States, 2Cancer Imaging & Metabolism, Image Response Assessment Team Core, Moffitt Cancer Center, Tampa, FL, United States, 3Radiology, Moffitt Cancer Center, Tampa, FL, United States, 4Radiation Oncology, Moffitt Cancer Center, Tampa, FL, United States, 5Integrated Mathematical Oncology, Moffitt Cancer Center, Tampa, FL, United States, 6Neuro-Oncology, Moffitt Cancer Center, Tampa, FL, United States
Synopsis
Standard MRI scans of patients with recurrent
Introduction
Antibodies directed against the programmed cell death 1 (PD-1) immune checkpoint molecule have shown promise in a variety of cancers and are under investigation for the treatment of high-grade gliomas.1 Immunotherapy in neuro-malignancies produces initial radiologic findings suggestive of progression, potentially leading to premature discontinuation of beneficial therapies. To provide guidance, the immunotherapy Response Assessment for Neuro-Oncology (iRANO) criteria for interpretation of findings of progression in this setting was recently published but has not yet been prospectively validated.2 The mechanisms behind escape of cancers from anti-PD1 therapy are a subject of intense study, and rescue interventions to activate T cells and counter immunosuppressive factors are in development.3 Early non-invasive predictors of response or onset of resistance are urgently needed to permit such personalized interventions to be effectively deployed, particularly given the tragically short life expectancy of recurrent GBM patients. There are preliminary reports by groups of imaging findings with the potential to differentiate responders from non-responders to immune checkpoint blockade in GBM.4,5 The objective of our study is to develop a predictor of disease progression in these patients.Methods
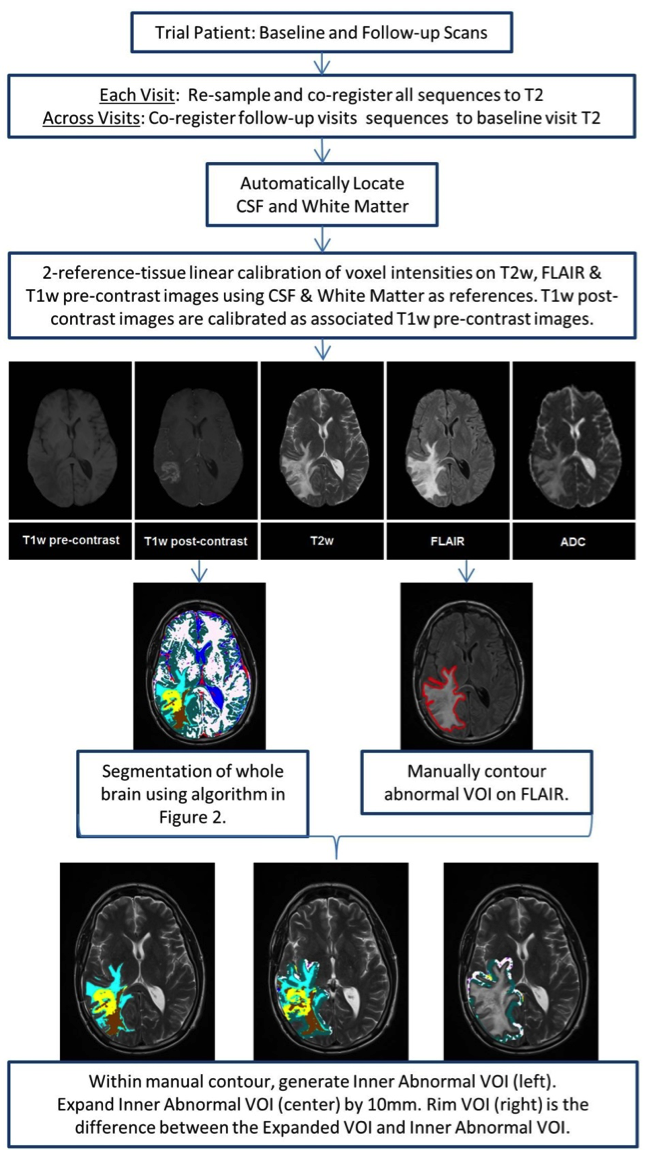
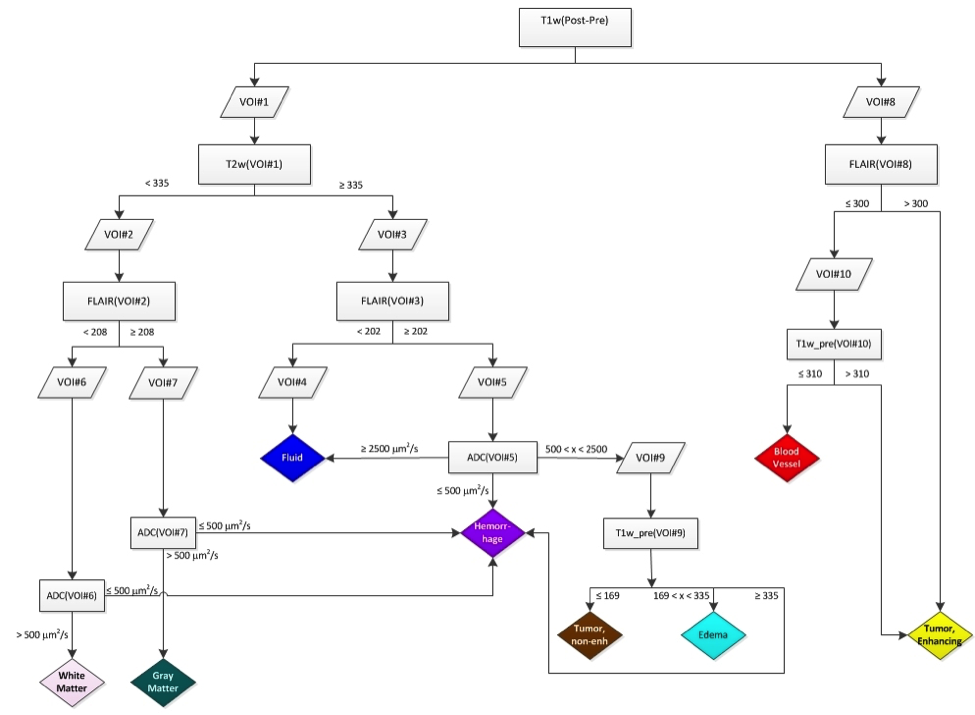
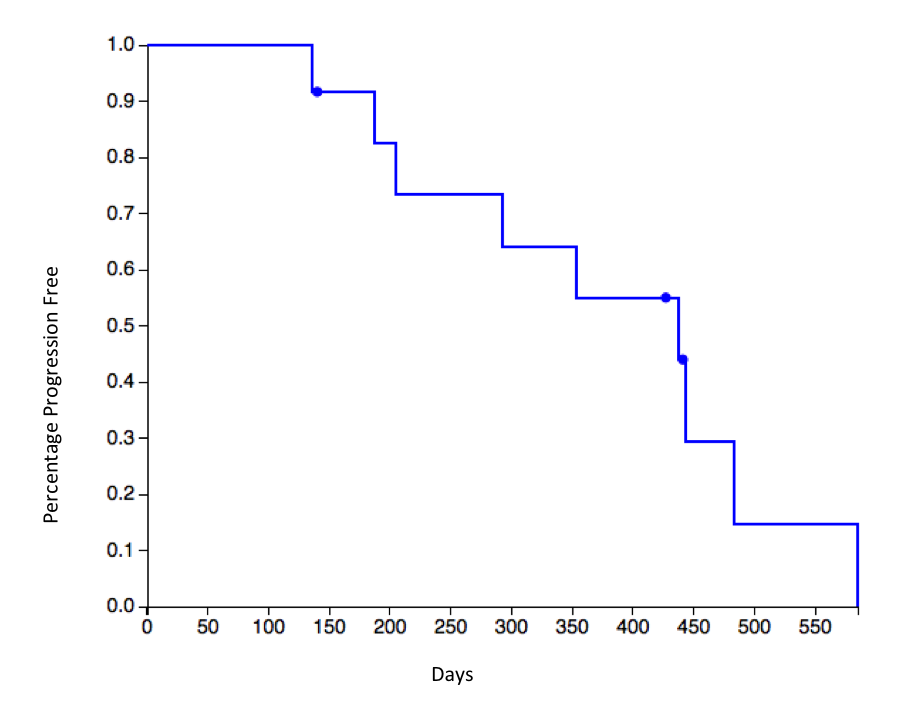
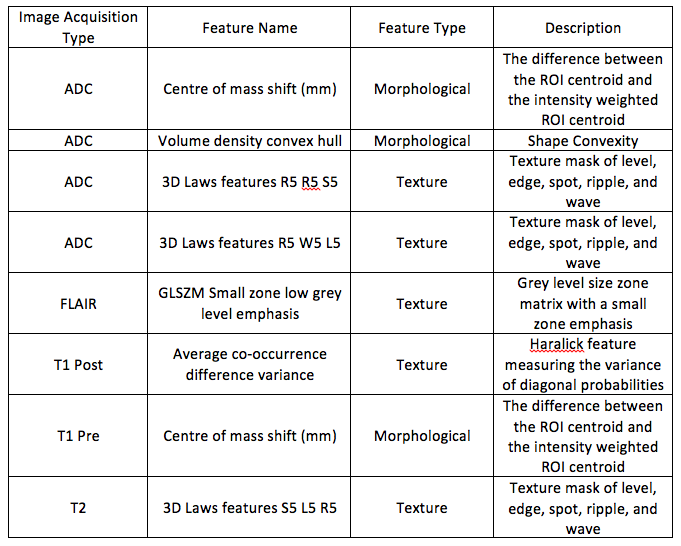
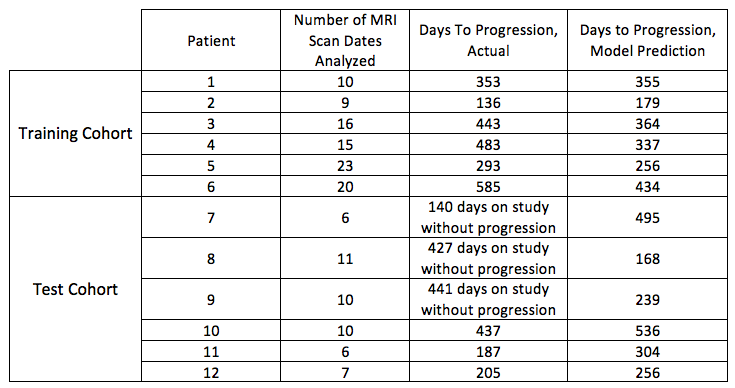
In a prospective phase 1 clinical trial, subjects with recurrent high grade glioma are being treated with Hypofractionated Stereotactic Irradiation (HFSRT, 30 Gy in 5 fractions), bevacizumab (10 mg/kg q 2 weeks) and pembrolizumab (100 or 200 mg, every 3 weeks). Standard-of-care T2-weighted, T2-weighted Fluid-Attenuated Inversion Recovery (FLAIR), T1-weighted (pre- and post-contrast), and ADC mapping MRI scans of the brain are acquired at baseline and following each cycle of therapy (every 6 weeks). Analysis of MRI scans from 12 subjects is reported here, with data from six subjects selected randomly for algorithm training and data from another six subjects used for algorithm testing (Figure 3). Model predictions were compared against time-to-progression per patient. In this cohort, the average time to progression was 383 days, with the minimum being 136 days and the maximum being 585 days, with no progression observed as of this report in three of the six patients in the testing cohort. Images were registered across the five scan types and longitudinally across multiple scan dates per subject, and pre-processed as in Figures 1 and 2. Multispectral clustering on the five types of images was used to define eight tissue types: fluid, edema, hemorrhage, grey matter, white matter, blood vessels, tumor non-enhancing, and tumor enhancing. An “abnormal volume of interest” (abVOI) was defined as the combined tumor enhancing and tumor non-enhancing regions and automatically segmented. A total of 308 descriptive image features6 were computed per abVOI. These features were reduced to the most predictive subset using feature selection, a method that selects features correlated with what is being predicted but uncorrelated with each other.7 A total of 8 features were found to be predictive using correlation-based feature selection (Table 1). Of these, four features were used in a linear regression model built using the WEKA data mining software8 on the training data:
Days To Progression = -141.451 * ADC Volume density convex hull + 112.5156 * ADC 3D Laws features R5 R5 S5 - 151.783 * ADC 3D Laws features R5 W5 L5 + 24.8752 * T2 3D Laws features S5 L5 R5 + 363.546
Results
Our predictive model is currently underpowered, with the number of features outweighing the number of samples. To combat overfitting we have employed feature selection and a linear model. The model predicts days-to-progression for subjects in the test set with a mean absolute error of 81 days and a root mean squared error of 89 days (Table 2). Mean absolute error is the average absolute distance to the regression line. Root mean squared error is the square root of the average of squared errors. While both metrics measure the error of the prediction, the root mean squared error penalizes large errors more than mean absolute error.Discussion & Conclusions
The preliminary results are promising and show a correlation between image features and time-to-progression. Our current model, built using 6 subjects, predicts progression to within 3 months of the actual time-to-progression in the 3 subjects in the test cohort with disease progression as of this report. MRI data are being collected on an additional 17 patients with available scans from a combined 102 dates that are not yet included in our analysis. The accrual goal for the ongoing clinical study is 32 subjects, and we anticipate that as additional image data are incorporated, our model will be able to predict the onset of resistance in a general population of patients receiving immunotherapy for high grade and recurrent gliomas.Acknowledgements
No acknowledgement found.References
1) Reardon DA, Wen PY, Wucherpfennig KW, Sampson JH. Immunomodulation for glioblastoma. Curr Opin Neurol 30:361-369, 2017.
2) Okada H, Weller M, Huang R, Finocchiaro G, Gilbert MR, Wick W, Ellingson BM, Hashinoto N, Pollack IF, Brandes AA, Franceschi E, Herold-Mende C, Nayak N, Panigrahy A, Pope WB, Prins R, Sampson JH, Wen PY, Reardon DA. Immunotherapy response assessment in neuro-oncology: a report of the RANO working group. Lancet Oncol 16:e534-42, 2015.
3) Kim JM, Chen DS. Immune escape to PD-L1/PD-1 blockade: seven steps to success (or failure). Annals Oncol 27:1492-1504, 2016.
4) Stringfield O, Arrington J, Yu M, Johnstone PA, Forsyth PA, Sahebjam S, Raghunand N. Multiparameter MRI Response Assessment in a Phase I Trial of Hypofractionated Stereotactic Irradiation with Pembrolizumab and Bevacizumab in Patients with Recurrent High Grade Gliomas, 3535, Proc. ISMRM 2016.
5) Qin L, Li X, Stroiney A, Qu J, Helgager J, Reardon DA, Young GS. Advanced MRI assessment to predict benefit of anti-programmed cell death 1 protein immunotherapy response in patients with recurrent glioblastoma. Neuroradiology 59:135-145, 2017.
6) Zwanenburg A, Leger S, Vallières M, Löck S. Image biomarker standardisation initiative - feature definitions. CoRR. 2016; abs/1612.07003.
7) Hall MA. Correlation-based Feature Selection for Machine Learning. 2000.
8) Hall M, Frank E, Holmes G, Pfahringer B, Reutemann P, Witten IH. The WEKA data mining software: an update. SIGKDD Explor.Newsl. November 2009;11(1):10-18.
9) Rosenmai, P. Kaplan Meier Survival Curve Grapher. January 13, 2015. http://eurekastatistics.com/kaplan-meier-survival-curve-grapher/.
Figures