1236
Effect of Vascular Input Function Selection on Quantitative Dynamic Contrast-Enhanced MRI for Differentiating Pseudo-progression from True Progression in GlioblastomasKevin Yuqi Wang1, Melissa Chen2, and Ho-Ling Liu3
1Radiology, Baylor College of Medicine, Houston, TX, United States, 2Diagnostic Radiology, MD Anderson, Houston, TX, United States, 3Imaging Physics, MD Anderson, Houston, TX, United States
Synopsis
Vascular input function (VIF) is a major source of error in the pharmacokinetic modeling of dynamic contrast-enhanced (DCE) magnetic resonance imaging (MRI) data. We investigated the influence of VIF variability on forward volumetric transfer constant, Ktrans, one of the kinetic parameters of DCE MRI. The diagnostic power of DCE MRI to discriminate between pseudo-progression and true progression of glioblastoma following chemoradiation therapy was determined by deriving Ktrans from five different VIF sources (population-based, middle cerebral artery, superior sagittal sinus—the latter two calculated by applying either an assumed or a measured T1) and using receiver operating curve analysis.
Introduction
Dynamic contrast-enhanced (DCE) magnetic resonance imaging (MRI) is a promising quantitative imaging technique for noninvasively discriminating between brain tumor progression and treatment-related changes. In particular, a higher forward volumetric transfer constant (Ktrans) has been associated with the tumor progression1. Absolute quantification of Ktrans is directly influenced by the vascular input function (VIF), and the selection of VIF represents a major source of error and variation in pharmacokinetic modeling of the DCE MRI data2,3. In this study, we evaluated the impact of VIF selection approaches, including population-based versus individual VIFs (the latter of which is obtained from different blood vessels and using measured vs. assumed blood T1, T1b, for signal conversion), on Ktrans for differentiating pseudo-progression (PsP) from true progression (TP) following chemoradiation therapy in patients with glioblastomas.Methods
MR images obtained with MRI DCE were retrospectively analyzed in 14 patients with glioblastoma (9 TP and 5 PsP, the latter of which were determined based on a combination of pathology and imaging follow-up). All images were acquired on a clinical 3T MR750 scanner (GE Healthcare, Waukesha, WI). A 3D fast spoiled gradient echo (SPGR) sequence (TR/TE = 3.6 ms/ 1.3 ms) with different flip angles (20, 50, 100 and 150) was used to obtain the pre-contrast T1 map. Twenty axial slices were acquired with a slice 5-mm thickness, FOV = 220 mm x 220 mm, and matrix size = 256 x 160. With the exception of a 300 flip angle, the same sequence was applied for the dynamic portion (temporal resolution ~5 seconds, 60 dynamics) in which a single dose of Gadovist contrast agent was injected at a rate of 5 mL/s. After converting signal time curves into concentration time curves using the SPGR signal equation and measured T1 map, the Ktrans parameter map was obtained using the extended Tofts model4. In this study, five different Ktrans maps were obtained each with a different VIF source: population-based VIF (Parker)5, middle cerebral artery (MCA), and superior sagittal sinus (SSS)—the latter two of which are calculated by either an assumed constant T1 (1600 ms) or the T1 value in the T1 map. The impact of VIF source on the diagnostic performance of derived Ktrans values in differentiating PsP from TP was evaluated using receiver operating curve (ROC) analysis.Results and Discussion
When deriving Ktrans from the population-based VIF, the T1 map corrected MCA VIF, and the assumed T1 corrected MCA VIF, the maximum Ktrans of TP was significantly higher than that of PsP (p=0.039) (Figure 1). When deriving Ktrans from the T1 map corrected MCA as the VIF source, the median (p=0.038) and mean (p=0.020) Ktrans of TP were significantly higher than their respective median and mean Ktrans of PsP (Figures 2 and 3). The diagnostic performance was highest for the mean Ktrans when derived from T1 map corrected MCA as the VIF source (area under the curve of 0.89) (Figure 4). Moreover, a mean Ktrans derived from the T1 map corrected MCA as the VIF source and with a threshold cutoff of 0.038 min-1 provided a sensitivity of 0.89, specificity of 0.80, and accuracy of 0.86.Conclusion
The source of the VIF influences the diagnostic power of the derived Ktrans in differentiating between PsP and TP of glioblastomas following chemoradiation therapy. Among the five VIF sources evaluated in the current study, using the VIF from the MCA calculated by the T1 value in the T1 map to derive the Ktrans parameter map provides the highest diagnostic power in discriminating PsP from TP.Acknowledgements
No acknowledgement found.References
- Thomas AA, Arevalo-Perez J, Kaley T, et al. Dynamic contrast enhanced T1 MRI perfusion differentiates pseudoprogression from recurrent glioblastoma. Journal of neuro-oncology. 2015;125(1):183-190.
- Lavini C, Verhoeff JJ. Reproducibility of the gadolinium concentration measurements and of the fitting parameters of the vascular input function in the superior sagittal sinus in a patient population. Magnetic resonance imaging. 2010;28(10):1420-1430.
- Keil VC, Madler B, Gieseke J, et al. Effects of arterial input function selection on kinetic parameters in brain dynamic contrast-enhanced MRI. Magnetic resonance imaging. 2017;40:83-90.
- Tofts PS. Modeling tracer kinetics in dynamic Gd-DTPA MR imaging. Journal of magnetic resonance imaging: JMRI. 1997;7(1):91-101.
- Parker GJ, Roberts C, Macdonald A, et al. Experimentally-derived functional form for a population-averaged high-temporal-resolution arterial input function for dynamic contrast-enhanced MRI. Magnetic resonance in medicine. 2006;56(5):993-1000.
Figures
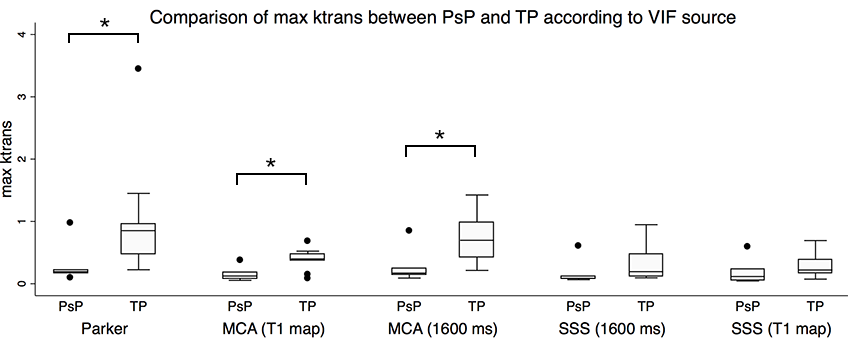
Figure 1. The maximum Ktrans of TP was significantly higher compared to those of PsP (*p<0.05, Mann-Whitney test) when the Ktrans was derived from the population-based (Parker) VIF, the T1 map corrected MCA, and the assumed T1 corrected (1600 ms) MCA as the VIF source.
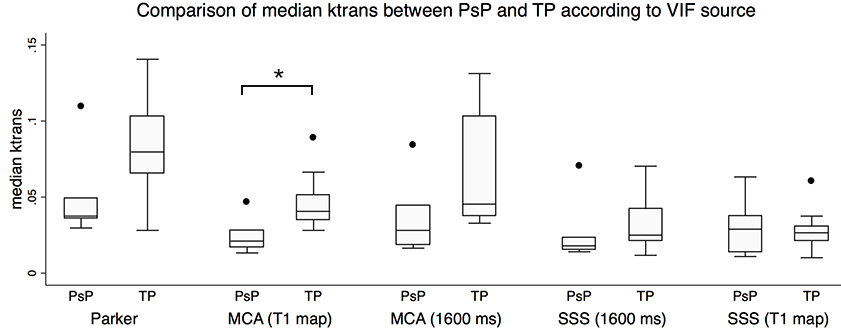
Figure 2. The median Ktrans of TP was significantly higher compared to that of PsP (*p<0.05, Mann-Whitney test) when the Ktrans was derived from the T1 map corrected MCA as the VIF source.

Figure 3. The mean Ktrans of TP was significantly higher compared to that of PsP (*p<0.05, Mann-Whitney test) when the Ktrans was derived from the T1 map corrected MCA as the VIF source.
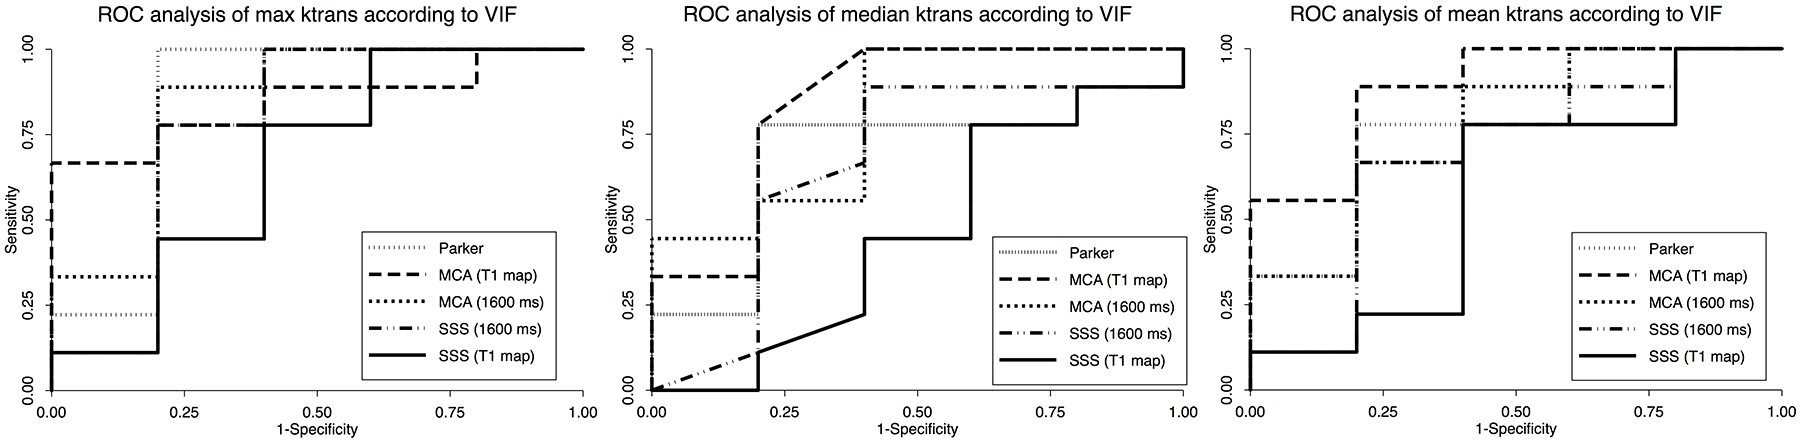
Figure 4. The diagnostic performance of the mean Ktrans when derived from the T1 map corrected MCA as the VIF source was the highest, with an area under the curve (AUC) of 0.89 (right panel, long-dashed line). This was closely followed by the maximum Ktrans derived from the population-based VIF, the assumed T1 corrected MCA, and the T1 map corrected MCA as VIF sources, which each demonstrated an AUC of 0.84 (left panel). The median Ktrans derived from T1 map corrected MCA also demonstrated an AUC of 0.84 (middle panel, long-dashed line).