1235
Supratentorial reorganization after treatment for childhood infratentorial tumors from a graph theoretical perspective1Pediatric Hemato-Oncology, UZ Leuven, Leuven, Belgium, 2Radiology, UZ Leuven, Leuven, Belgium, 3Perinatal Imaging & Health, King's College London, London, United Kingdom
Synopsis
In this study, structural brain topology was investigated in young adults who were treated for infratentorial tumors during childhood, using graph theory metrics based on whole-brain tractography. Comparisons with healthy controls yielded significant differences in global efficiency measures, independently from network density threshold. This cost-corrected measure was significantly related with IQ scores. By contrast, local efficiency and average nodal strength appeared different for core networks only. This finding suggests that connectivity of highly connected supratentorial hubs are predominantly affected following treatment for infratentorial tumours.
Introduction
Brain tumor survivors frequently suffer from neurocognitive deficits after treatment. In childhood cancer patients, brain maturation is affected by the lesion itself, as well as by each constituent of the treatment. Although widespread brain injury has been shown in previous studies of childhood infratentorial tumours, the supratentorial brain topology following treatment remains unclear. The aim of this study was to investigate structural connectivity in survivors of childhood infratentorial tumours and assess the relationship with cognitive performance using graph theoretical approaches.Methods
In this study, multishell DWI and T1-weighted MR-scans were acquired in 21 childhood infratentorial tumor survivors (mean age at diagnosis 8.3 years; age range 16-34 years; >2 years post-treatment), treated between 1991 and 2015 for a pilocytic astrocytoma (n=8), ependymoma (n=1) or medulloblastoma (n=12); and age- and gender-matched controls at the University Hospital of Leuven. MRI was obtained on a 3T Philips Achieva MRI scanner with a 32-channel phased-array head coil. The DWI imaging scheme consisted of b-values 700, 1000 and 2800 s/mm2, applied along 25, 40 and 75 uniformly distributed gradient directions respectively, in addition to 10 non-diffusion-weighted images (b=0) (TR/TE=7800ms/90ms, 50 slices, 2.5mm x 2.5mm x 2.5mm). T1-weighted MR-scans were used as a reference for anatomy-informed tractography (TR/TE=4.6ms/9.6ms, 160 slices, 0.98 × 0.98 × 1.2).2 patients were excluded from the analyses due to mechanical shunt artefacts.
MR images were processed as follows:
(1) Anatomical T1 images were segmented in native space based on 6 tissue priors (i.e. grey matter, white matter, CSF, bone, soft tissue and background) using the CAT toolbox1, subcortical grey matter was segmented using FSL2.
(2) The DWI images were preprocessed with MP-PCA denoising3, gibbs ringing removal4, motion and distortion correction, bias field correction5, and intensity normalization (MRtrix3 and FSL Topup & Eddy6). Fibre orientation distributions were estimated in each voxel using multi-tissue constrained spherical deconvolution7. 10 million tracks were generated using anatomically-constrained probabilistic tractography8. The resulting tractogram was processed using Spherical-deconvolution Informed Filtering of Tractograms (SIFT2)9. To construct structural connectomes, the AAL-atlas10 was nonlinearly registered to individual brain-extracted T1-images, using FSL (mutual information cost function). Once in native space, these were rigidly registered to DWI space (boundary based cost function). Connectivity values were then calculated for tracks between the supratentorial AAL regions, using the SIFT2 weights11. Graph theory parameters (including global efficiency, local efficiency and average nodal strength) were compared between patients and controls, for a range of network densities, as implemented previously12. Finally, integrated values were calculated for the network density range (1-28%) which explained more than 95% of the overall network connectivity for all subjects (Figure 1). Pearson correlations were calculated between the cost-integrated global efficiency, local efficiency, average node strength and IQ scores, as measured using the WAIS assessment (full scale IQ, verbal IQ, performance IQ, working memory and processing speed; two-sided test).
Results
Global efficiency was significantly lower in patients for the entire network density range (Figure 2). Additionally, local efficiency as well as average nodal strength was significantly reduced, but only for network densities lower than 28%. All cost-integrated measures were significantly different if integrated over 1-28% density (for average thresholded connectomes, see Figure 3). Local efficiency was not significantly different if averaged across the entire network density range. Cost-integrated global efficiency correlated significantly with full scale IQ: r=.329, p=.044, and working memory: r=.325, p=.047. Cost-integrated local efficiency and average nodal strength were not significantly correlated with IQ measures.Discussion
We studied brain network measures in subjects who were treated for fossa posterior tumors during childhood. Treatments included surgery, in most cases additional cranial radiotherapy (n=14), and some cases additional chemotherapy (n=9)). These treatments may result in widespread brain injury and impair maturation. We observed that global efficiency of structural networks was diminished in survivors of childhood infratentorial tumours, independently of the overall network strength, and global efficiency correlated with total IQ and working memory measures. By contrast, local changes depended on the extraction of networks at different density levels. Weighted local efficiency and average nodal strength were significantly lower in patients when only considering core connections (<28% of network density), suggesting a local reorganization of the strongest connections. These findings are in line with previous studies, which suggest that global disorders and/or induced toxicity predominantly affect highly connected hubs13.Conclusion
In summary, this study highlights global network changes in the supratentorial brain following treatment for childhood infratentorial tumours, which may be highly relevant for the impaired neurocognitive performance that is frequently observed in these children.Acknowledgements
We thank the Kinderkankerfonds Leuven for providing funding, with which we were able to acquire the data, launch this study in the University Hospital of Leuven and perform these analyses. This work was supported by the Wellcome EPSRC Centre for Medical Engineering at Kings College London (WT 203148/Z/16/Z), MRC strategic grant MR/K006355/1 and by the National Institute for Health Research (NIHR) Biomedical Research Centre based at Guy’s and St Thomas’ NHS Foundation Trust and King’s College London. The views expressed are those of the authors and not necessarily those of the NHS, the NIHR or the Department of Health.
References
1. Gaser C, Dahnke R. CAT - A Computational Anatomy Toolbox for the Analysis of Structural MRI Data. In 2016.
2. Zhang Y, Brady M, Smith S. Segmentation of brain MR images through a hidden Markov random field model and the expectation-maximization algorithm. IEEE Trans Med Imaging. 2001;20(1):45–57.
3. Veraart J, Novikov DS, Christiaens D, Ades-aron B, Sijbers J, Fieremans E. Denoising of diffusion MRI using random matrix theory. Neuroimage. 2016;142:394–406.
4. Kellner E, Dhital B, Kiselev VG, Reisert M. Gibbs-ringing artifact removal based on local subvoxel-shifts. Magn Reson Med. 2016;76(5):1574–81.
5. Tustison NJ, Avants BB, Cook PA, Zheng Y, Egan A, Yushkevich PA, et al. N4ITK: Improved N3 bias correction. IEEE Trans Med Imaging. 2010;29(6):1310–20.
6. Andersson JLR, Sotiropoulos SN. Non-parametric representation and prediction of single- and multi-shell diffusion-weighted MRI data using Gaussian processes. Neuroimage. 2015;122:166–76.
7. Jeurissen B, Tournier JD, Dhollander T, Connelly A, Sijbers J. Multi-tissue constrained spherical deconvolution for improved analysis of multi-shell diffusion MRI data. Neuroimage. 2014;103:411–26.
8. Smith RE, Tournier JD, Calamante F, Connelly A. Anatomically-constrained tractography: Improved diffusion MRI streamlines tractography through effective use of anatomical information. Neuroimage. 2012;62(3):1924–38.
9. Smith RE, Tournier JD, Calamante F, Connelly A. SIFT2: Enabling dense quantitative assessment of brain white matter connectivity using streamlines tractography. Neuroimage. 2015;119:338–51.
10. Tzourio-Mazoyer N, Landeau B, Papathanassiou D, Crivello F, Etard O, Delcroix N, et al. Automated Anatomical Labeling of Activations in SPM Using a Macroscopic Anatomical Parcellation of the MNI MRI Single-Subject Brain. Neuroimage. 2002;15(1):273–89.
11. Smith RE, Tournier JD, Calamante F, Connelly A. The effects of SIFT on the reproducibility and biological accuracy of the structural connectome. Neuroimage. 2015;104:253–65.
12. Batalle D, Hughes EJ, Zhang H, Tournier J-D, Tusor N, Aljabar P, et al. Early development of structural networks and the impact of prematurity on brain connectivity. Neuroimage. 2017;149:379–92.
13. Stam CJ. Modern network science of neurological disorders. Nat Rev Neurosci. 2014;15(10):683–95.
Figures
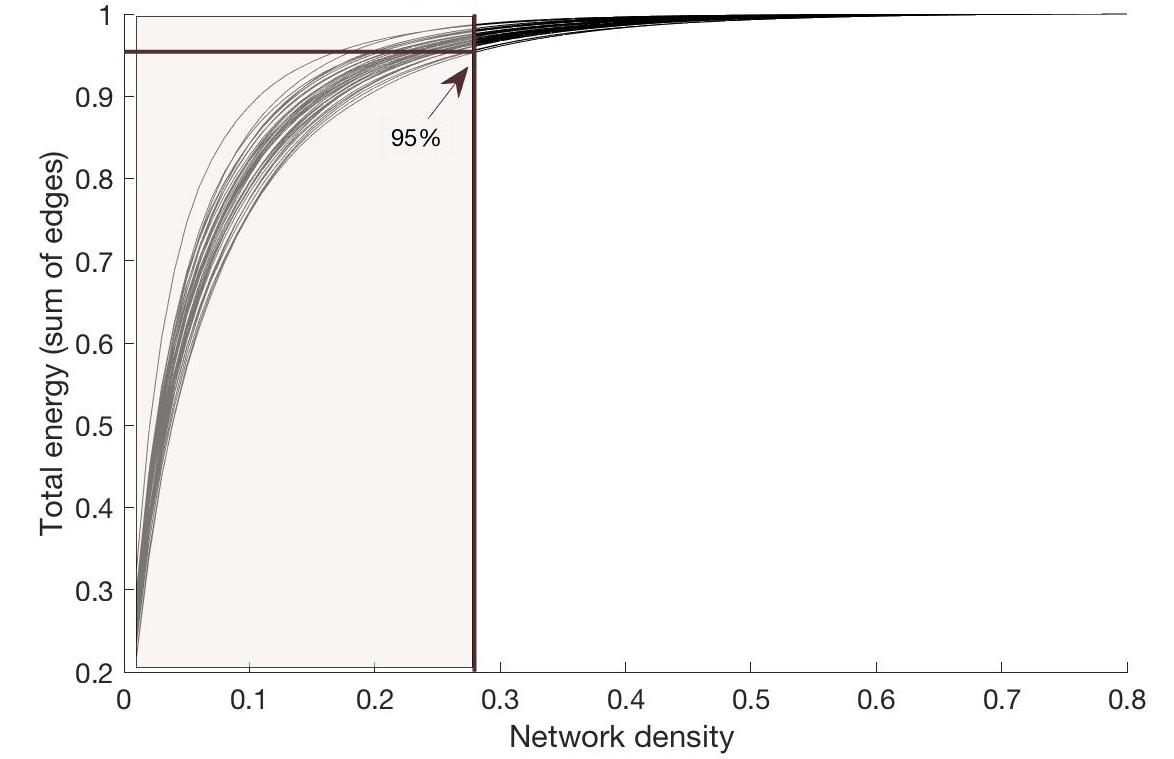
Figure 1:
Percentage of total energy for each network
density
For all subjects, the percentage of energy (i.e. sum of edge
weights) is depicted for each network density. The arrow indicates the position
where 95% of the total energy is reached for the subject with the lowest
energy-cost-function. Hence, for cost-integrated values, graph theory metrics
were averaged across the area colored in light brown.
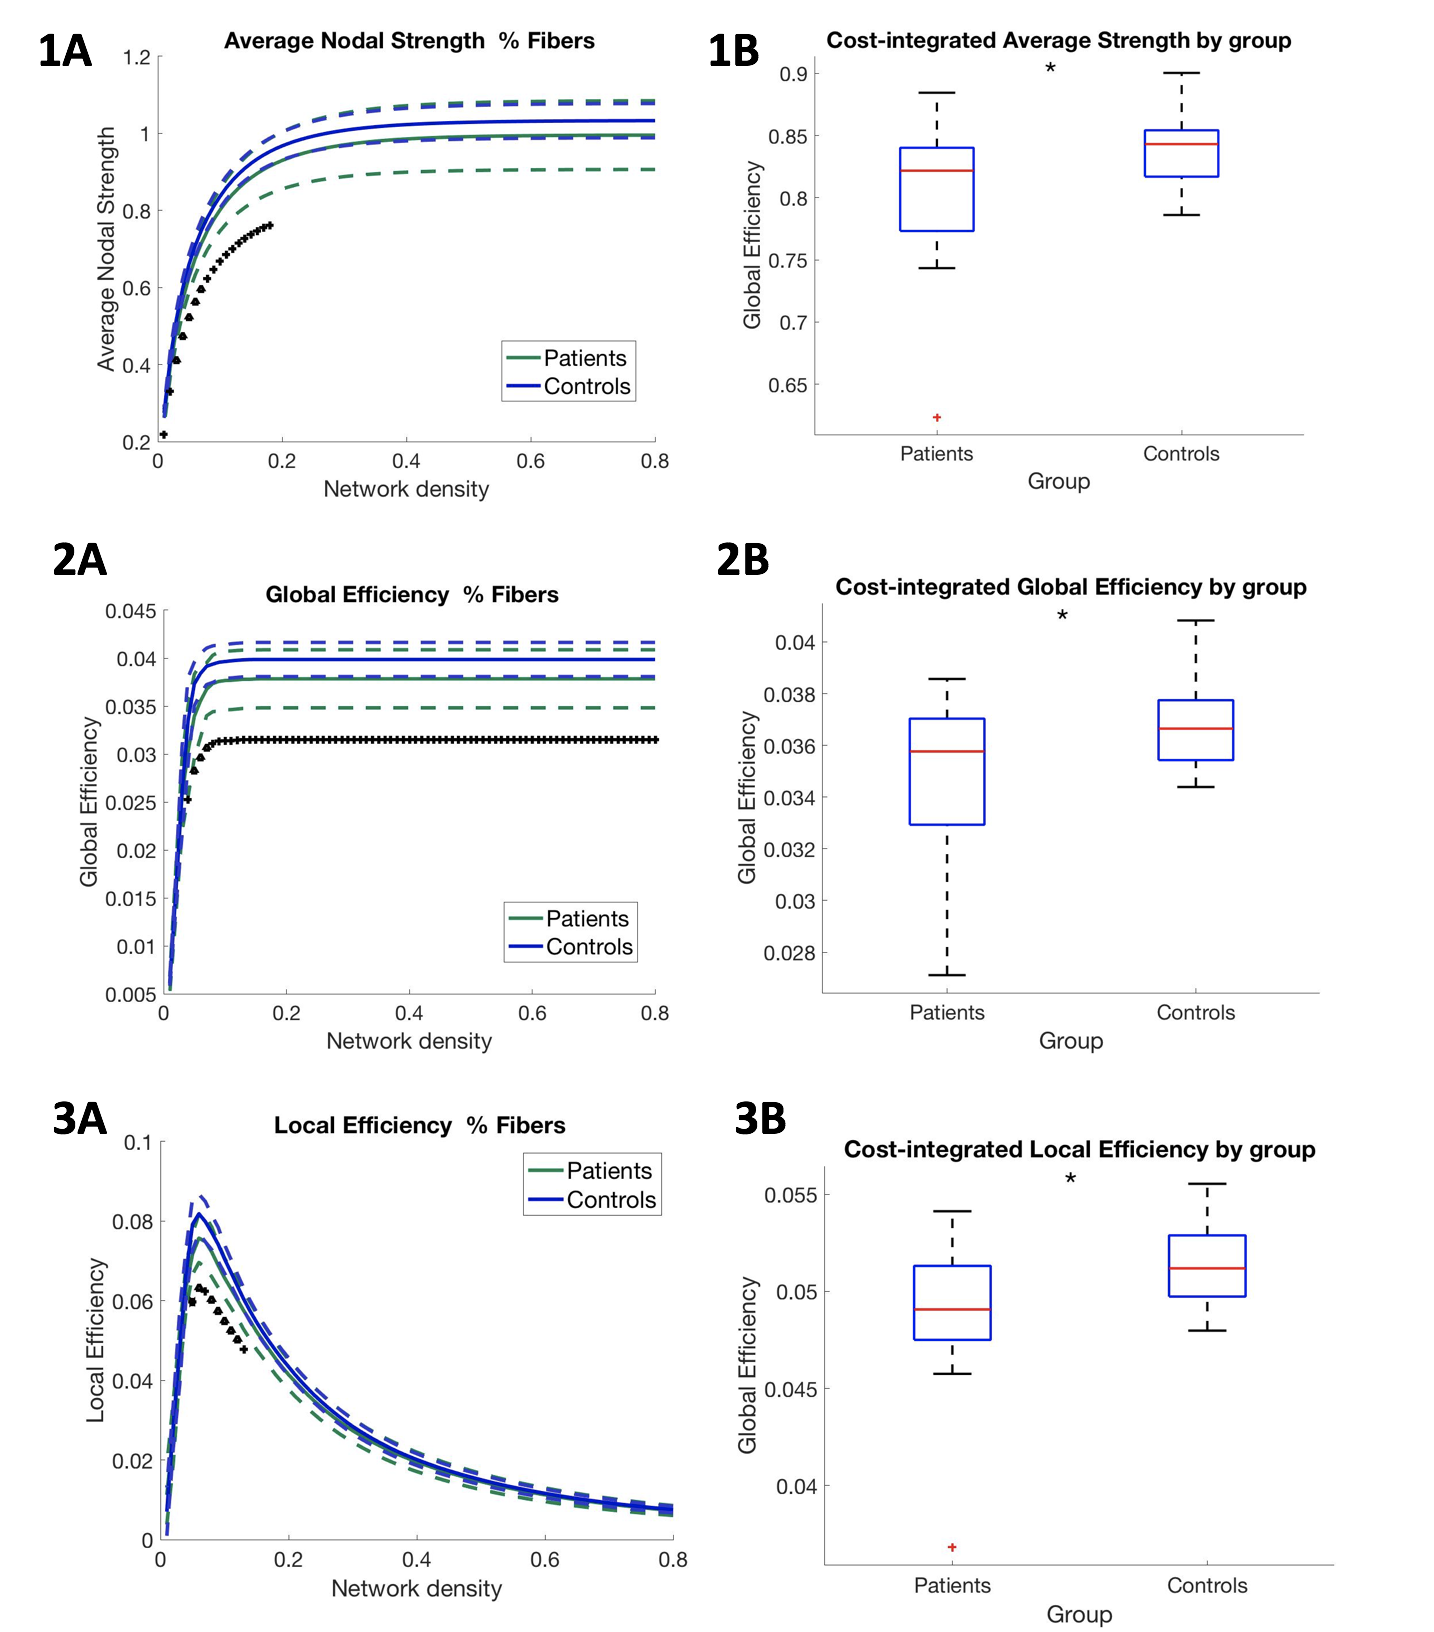
On the left, for each network cost (i.e. the selection of 10-80% strongest connections of the network), average nodal strength values, average global efficiency and local efficiency for each group are represented, in upper, middle and lower panel, resp. On the right, boxplots show the group averages (and deviations) of these values, across the range of low network densities (<.28 network density, i.e. networks including core connections). For cost-integrated measures of average nodal strength, global efficiency, local efficiency, p-values of one-way ANOVA were p=.0289, p=.0178, p=.0114, resp.
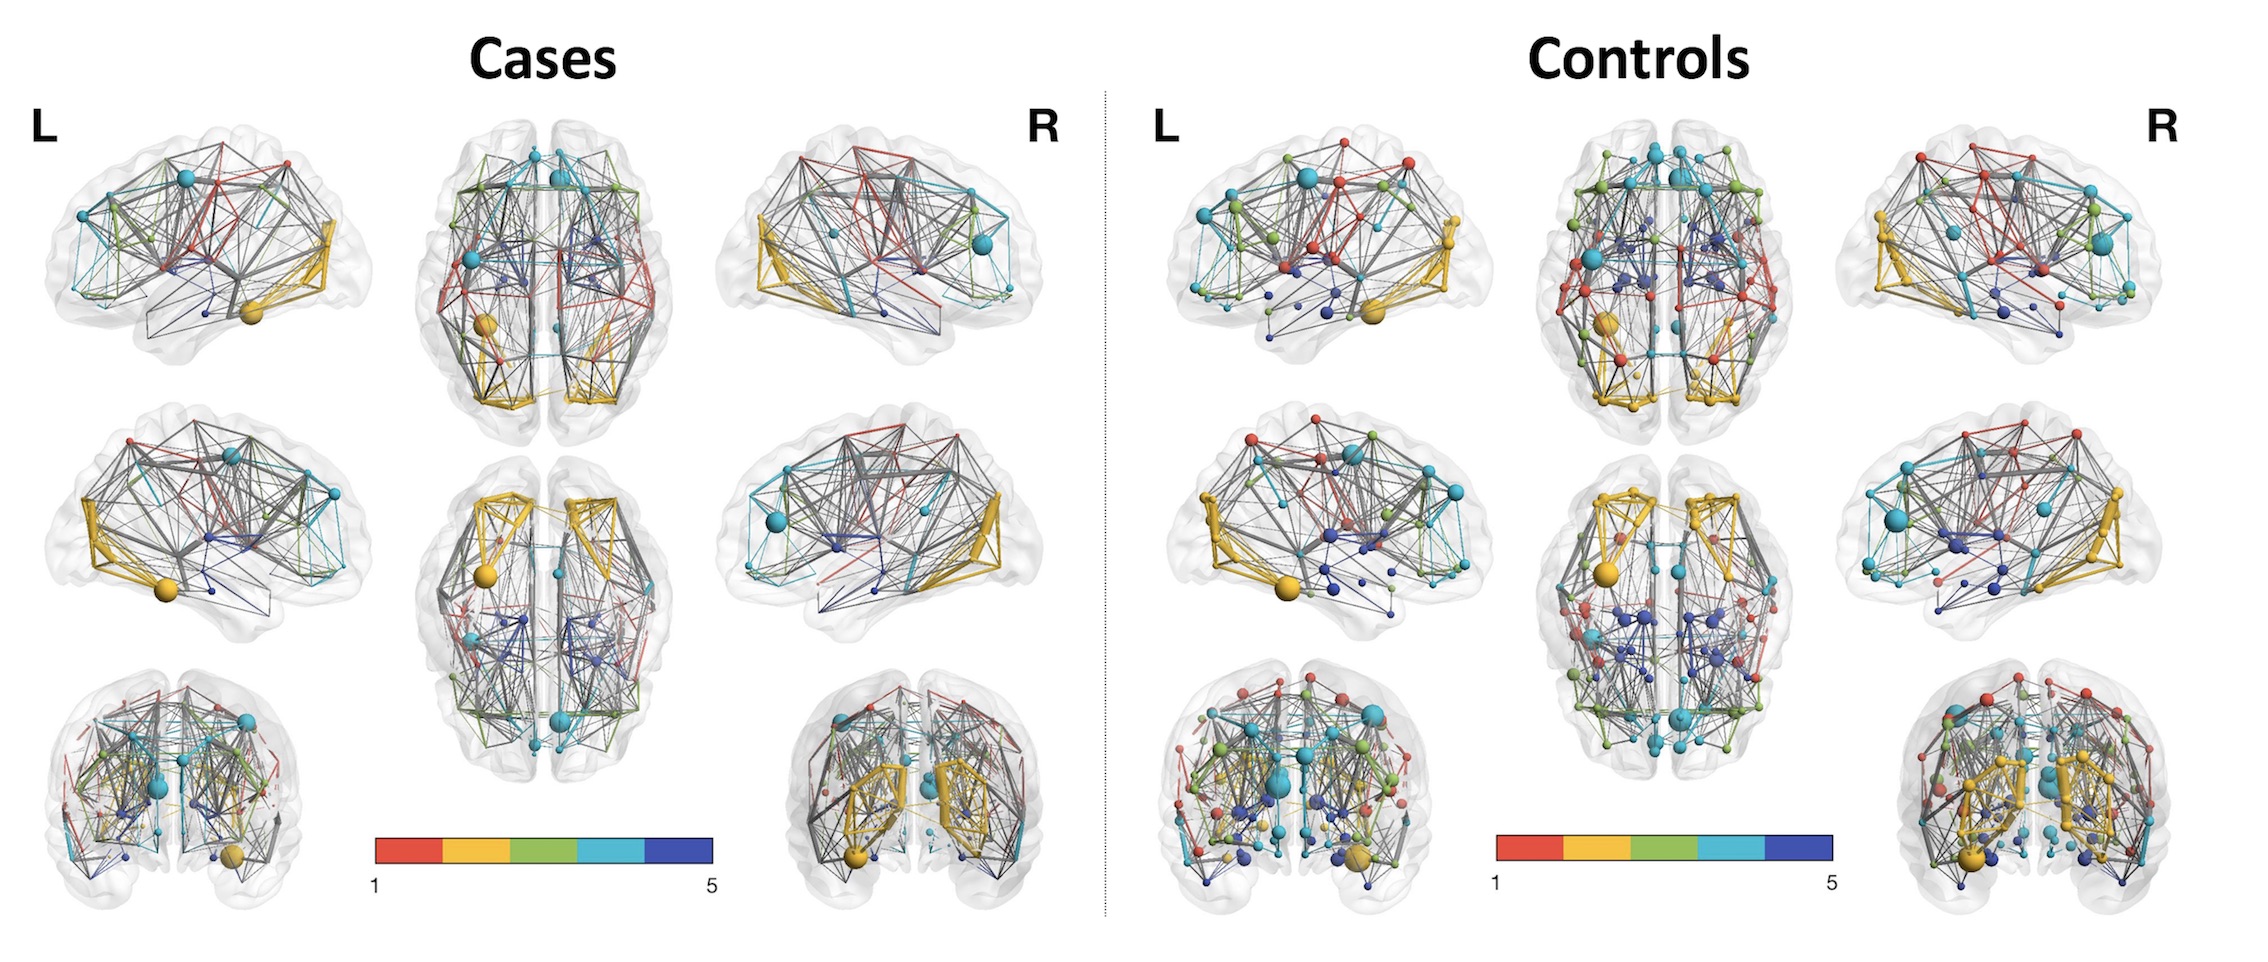
Group average networks based on track weights between supratentorial AAL-regions (thresholded for 10 % of the strongest connections) in cases vs. controls, in left vs. right panel, resp. Colored modules in this figure were estimated in BrainNetViewer (n=5). Nodal size is proportional to its number of connections. Edge thickness is proportional to the edge value. As could be inferred from this graph, nodes show a higher number of (and stronger) connections in the average network of cases (on the left), compared to controls (on the right) (at network strength of 10%).