1234
Multi-Parametric and Multi-Regional Histogram Analysis of MRI: Revealing Imaging Phenotypes of Glioblastoma Correlated with Patient Survival1Department of Clinical Neurosciences, University of Cambridge, Cambridge, United Kingdom, 2Department of Neurosurgery, Shanghai General Hospital, Shagnhai, China, 3Department of Radiology, University of Cambridge, Cambridge, United Kingdom, 4NeuRoNeLab, DISA-MIS, University of Salerno, Salerno, Italy, 5Cancer Research UK Cambridge Institute, University of Cambridge, Cambridge, United Kingdom
Synopsis
Glioblastoma is characterized by its remarkable heterogeneity and dismal prognosis. Histogram features of MRI modality show potential in measuring the intratumoral heterogeneity. We integrate multi-parametric and multi-regional MRI histogram features to divide patients into groups and assess the relevance to treatment outcome. The results demonstrated that integrating multi-parametric and multi-regional MRI histogram features may help to stratify patients. The feature selected in this process also displayed prognostic values in the multivariate survival analysis. The histogram features selected from the proposed approach may be used as potential imaging markers in personalized treatment strategy and response determination.
Introduction
Glioblastoma is characterized by its remarkable heterogeneity and dismal prognosis. Finding validated imaging markers for personalized treatment is crucial. Magnetic resonance imaging (MRI) shows potentials in capturing imaging features non-invasively prior to treatment. Histogram features can reflect the intratumoral heterogeneity by measuring the distribution of voxel intensities of MRI modality. Here, we integrate multi-parametric and multi-regional MRI histogram features to divide patients into groups and assess the relevance to treatment outcome.Methods
Patients
This study was approved by the local institutional review board. A total of 79 patients with supratentorial primary glioblastoma were prospectively recruited. Exclusion criteria include history of previous brain tumor, cranial surgery, radiotherapy/chemotherapy, and contraindication for MRI scanning. All patients received surgery and diagnosis was confirmed by pathology. Standard regimen of temozolomide chemoradiotherapy was performed after surgery. Treatment response was evaluated according to the Response Assessment in Neuro-oncology criteria.
Imaging pre-processing and histogram analysis
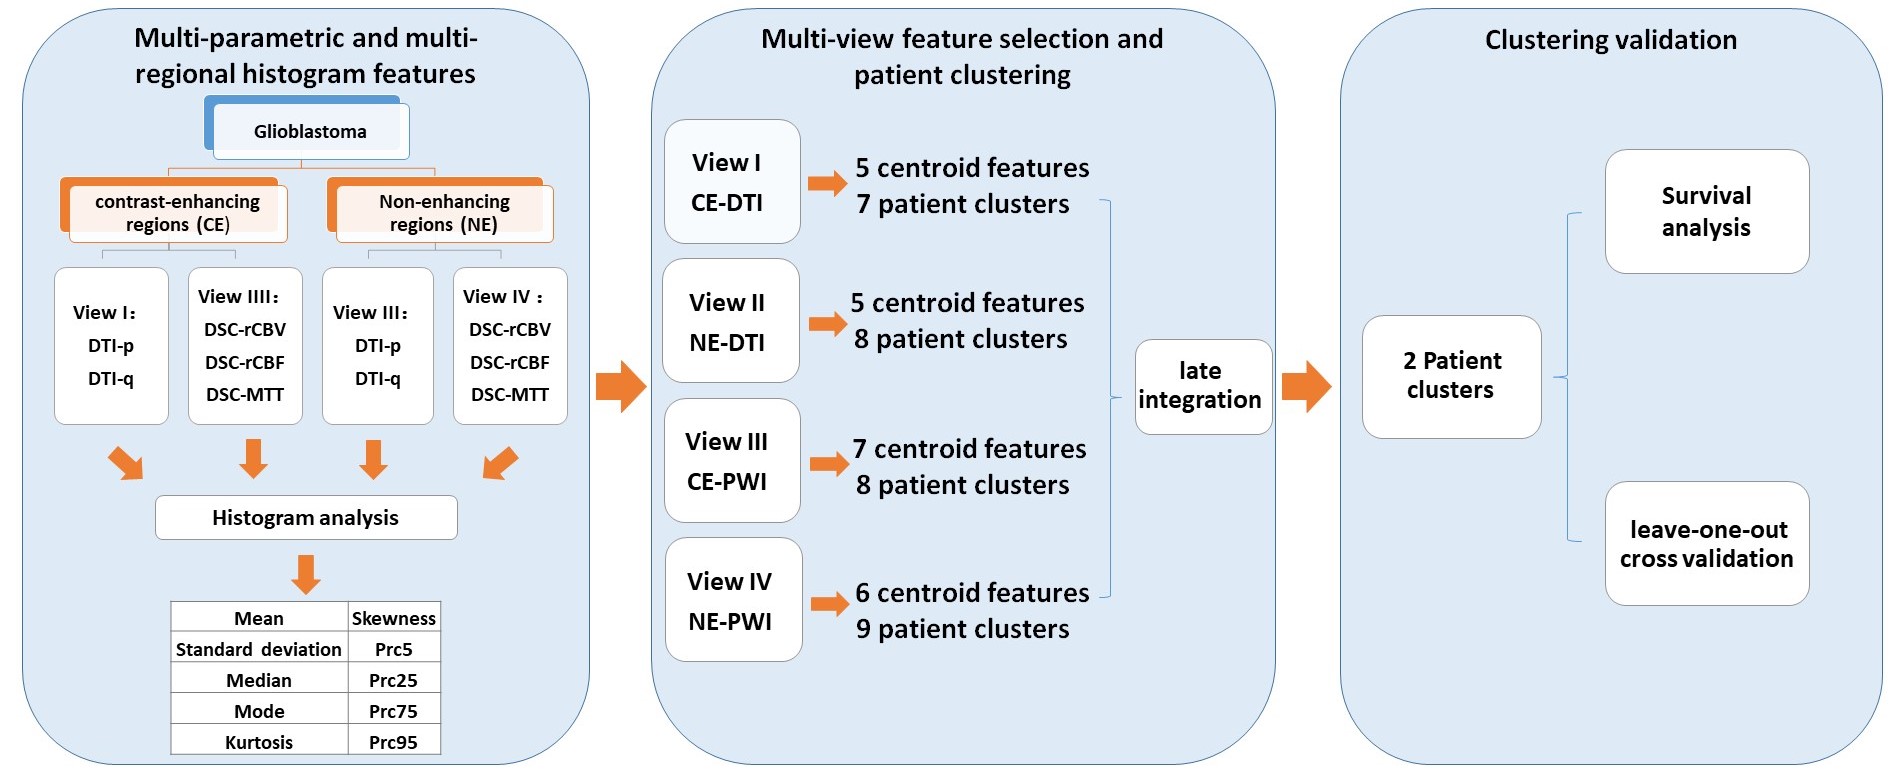
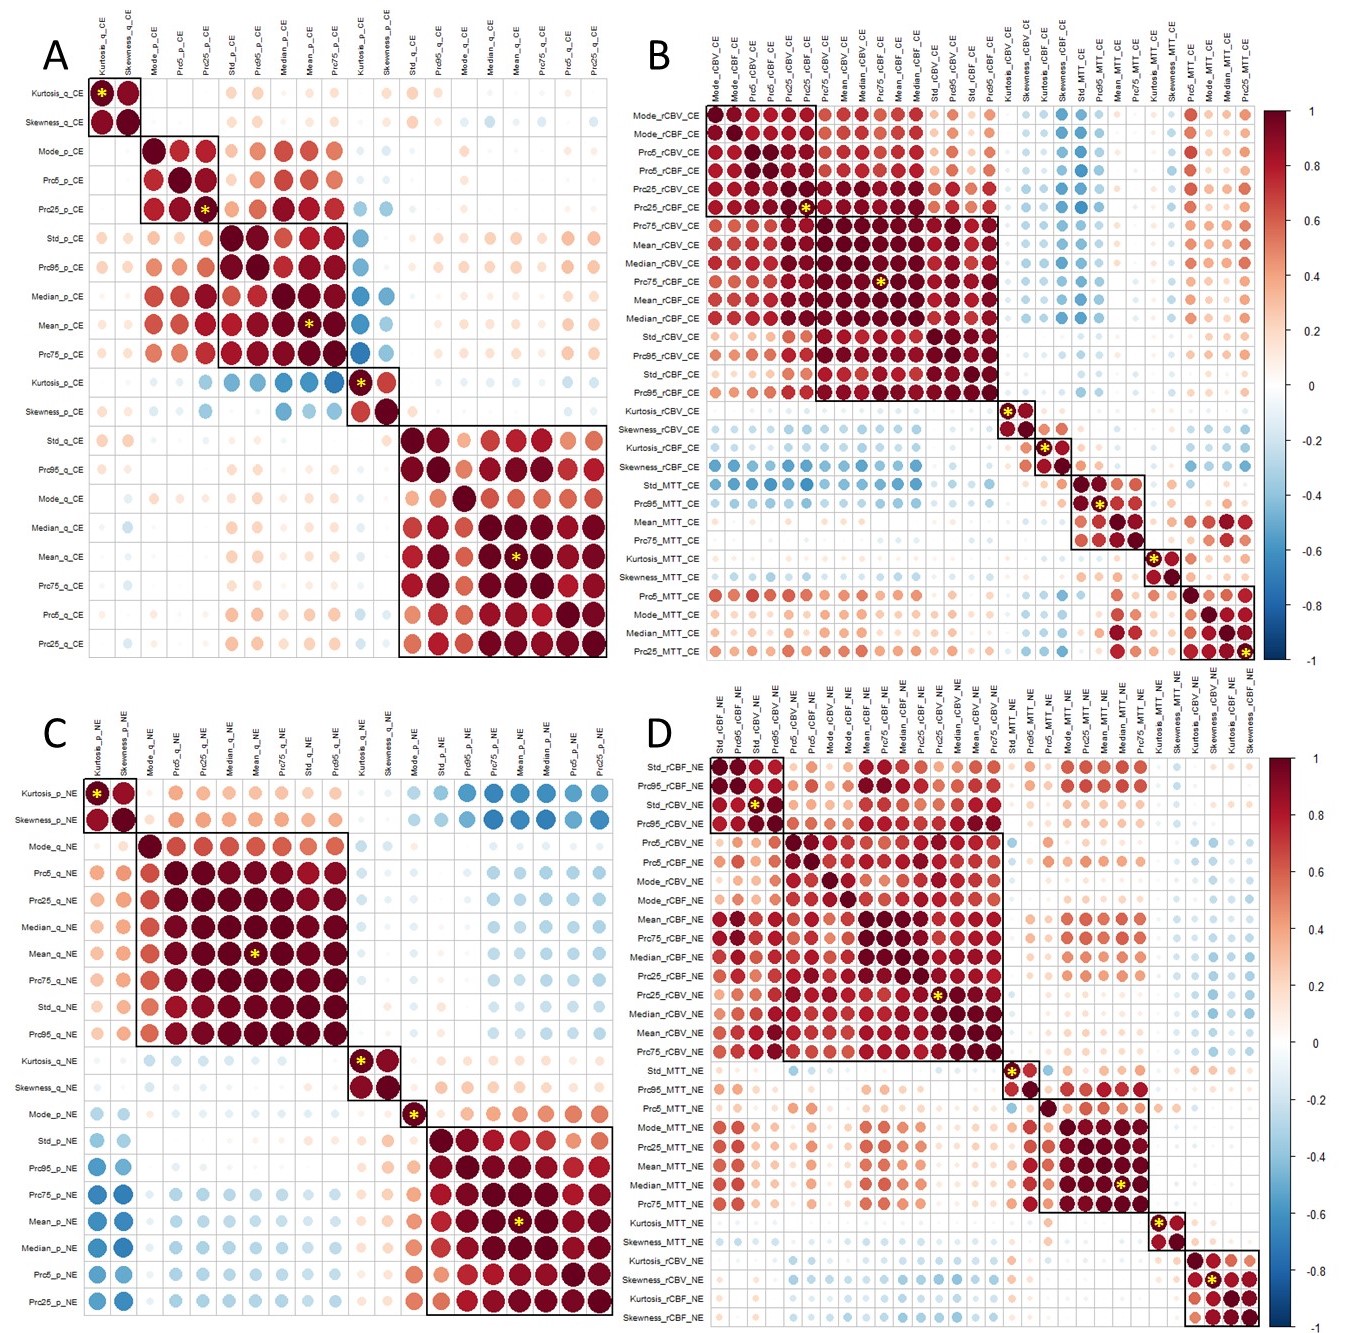
Anatomical T2-weighted, T1-weighted post-contrast and FLAIR images, as well as dynamic susceptibility contrast (DSC) and diffusion tensor imaging (DTI) were acquired preoperatively using a 3T MRI scanner. All images were co-registered to T2W images. DTI-p (isotropic) and DTI-q (anisotropic) maps were generated from diffusion images. The relative cerebral blood volume (rCBV), mean transit time (MTT) and relative cerebral blood flow (rCBF) maps were generated from the perfusion images. Contrast-enhancing (CE) and non-enhancing (NE) regions of interest were manually delineated on the post-contrast T1 and FLAIR images. Voxel intensity histograms were constructed from the CE and NE regions independently. Ten features were calculated from each histogram, including mean, standard deviation, median, mode, skewness, kurtosis, and 5th, 25th, 75th, 95th percentiles of the histogram. Therefore, altogether 50 histogram features were generated from the perfusion and diffusion maps of each subject.
Multi-view Feature Selection and Multi-view Clustering
Patient clustering was performed by multi-view data integration (MVDA), implemented in R (https://github.com/angy89/MVDA). For each case, four categories of feature sets (CE-diffusion, NE-diffusion, CE-perfusion, NE-perfusion) were treated as individual views when characterizing the tumor. The MVDA methodology, illustrated in Figure 1, was divided into multiple steps: (1) Features were filtered by variance and then clustered using hierarchical ward clustering for each view. The number of feature clusters was determined by the VAL index. (2) For each view, the patients were clustered by hierarchical ward clustering using the selected features, where the VAL index determined the number of patient clusters. (3) The clustering results for each view are then integrated into consensus patient clusters. Patient cluster stability was evaluated using leave-one-out cross-validation (LOOCV) for steps (1) - (3), generating a 79 ×79 co-occurrence consensus clustering (COCC) matrix. Kaplan-Meier and Cox proportional hazards regression analyses were performed to evaluate the relevance of the final patient clusters to survival. For Cox regression, all confounders, including IDH-1 mutation status, MGMT methylation status, sex, age, extent of resection and contrast-enhancing tumor volume, were considered. To further assess the individual selected features, we also used Cox proportional hazards regression on the centroid feature of each feature cluster from step (1).
Results
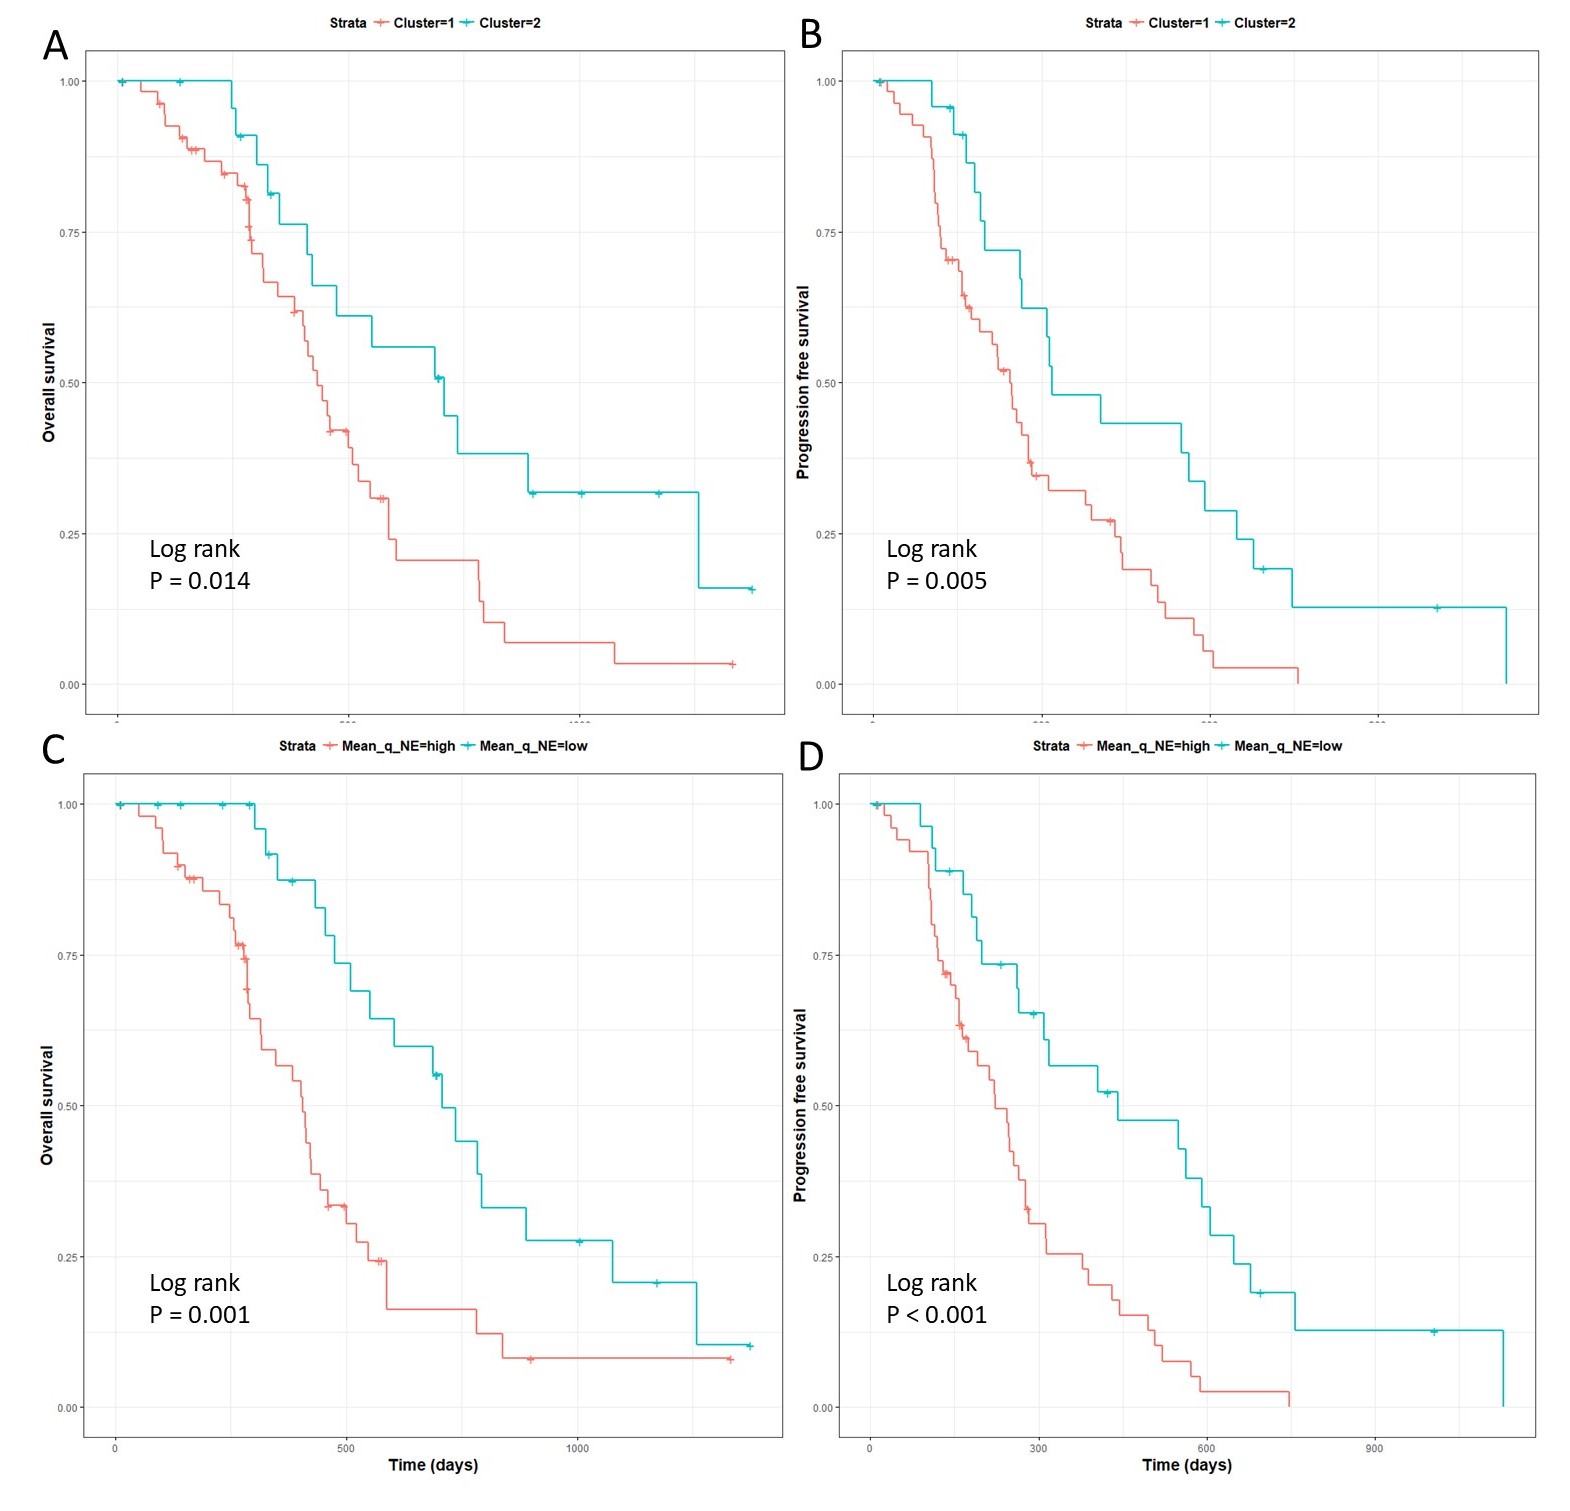
The median overall survival of the patients was 461 days (range 52- 1376 days) and the median progression-free survival was 264 days (range 37 - 550 days. The MVDA approach yielded two final patient clusters, consisting of 55 and 24 patients, respectively. Both multivariate Cox proportional hazards regression (p = 0.016) and Kaplan-Meier analysis (p = 0.014) indicated significant differences in overall survival between the two patient clusters. For progression-free survival, Kaplan-Meier analysis showed significance (Log-rank, p = 0.004, Figure 3). LOO-CV showed that the two patient clusters were stable, indicated by a mean value of the COCC matrix of 0.73 for patient cluster 1 and 0.70 for patient cluster 2. Among all centroid features selected by MVDA, marked in Figure 2, six diffusion histogram features significantly contributed to OS and/or PFS. Specifically, mean value of DTI-q in the non-enhancing region contributed to a worse OS (HR = 1.87, CI: 1.23- 2.83, p = 0.003) and worse PFS (HR = 1.90, CI: 1.27- 2.85, p = 0.002), as shown in Figure 3.Discussion
Acknowledgements
No acknowledgement found.References
1. Serra A, Fratello M, Fortino V, Raiconi G, Tagliaferri R, Greco D. MVDA: a multi-view genomic data integration methodology. Bmc Bioinformatics. 2015;16.
2.Boonzaier NR, Larkin TJ, Matys T, van der Hoorn A, Yan JL, Price SJ. Multiparametric MR Imaging of Diffusion and Perfusion in Contrast-enhancing and Nonenhancing Components in Patients with Glioblastoma. Radiology. 2017:160150.
Figures