1232
Combined 18-FET-PET and diffusion kurtosis imaging study in treated glioblastoma patients: differentiation between metabolically active tumours and treatment-induced tissue abnormalities1Institute of Neuroscience and Medicine 4, Research Centre Juelich, Juelich, Germany, 2Department of Neurology, Faculty of Medicine, RWTH Aachen University, Aachen, Germany, 3Institute of Neuroscience and Medicine 3, Forschungszentrum Juelich, Jülich, Germany, 4Department of Neurology, University Hospital Cologne, Cologne, Germany, 5Center of Integrated Oncology (CIO), Universities of Cologne and Bonn, Cologne, Germany, 6JARA - BRAIN - Translational Medicine, RWTH Aachen University, Aachen, Germany
Synopsis
MRI and diffusion MRI techniques provide important diagnostic information regarding
Introduction
Contrast-enhanced MRI, a powerful technique for non-invasive visualization of morphologic tissue structures, represents the diagnostic method of choice in Neuro-Oncology. The development of diffusion tensor/kurtosis imaging (DTI/DKI) provided access to valuable information on tissue microstructure which is increasingly being used in the assessment of brain tumours.1 Novel DKI metrics were reported to correlate with tumour grades.2,3 However, these techniques lack metabolic information, which is often of paramount importance for treatment decisions. This information can be complemented by hybrid PET-MRI,4 using, in particular, O-(2-18F-fluoroethyl)-L-tyrosine (FET) successfully applied in the assessment of cerebral gliomas.5,6 The purpose of this work was to perform a multimodal study of glioblastomas (GBMs) combining information on metabolic activity from FET-PET, anatomical information from standard MRI, and microstructural information from DKI. In particular, we aim to evaluate the performance of this novel approach in differentiating between GBM progression versus treatment-induced changes, which is a challenging issue in Neuro-Oncology. We hypothesised that by restricting the analysis to the regions of high metabolic activity, i.e., those showing higher than normal FET uptake, will be helpful for better assessment of microstructural features that are more specific for progressing tumour.
Materials and Methods
A total of 106 adult patients with treated gliomas were investigated by FET-PET, anatomical MRI, and DTI/DKI after providing written informed consent. Experiments were performed using a hybrid 3T PET-MRI scanner (Siemens Healthyniers, Erlangen, Germany) equipped with a BrainPET insert7 for simultaneous PET-MRI acquisition. DKI was performed using diffusion-weighted twice-refocused SE-EPI pulse sequence (b-values: 0, 1.0, 2.5 ms µm-2; 30 diffusion gradient directions)). Out of the whole cohort, 32 treated GBM patients fulfilled the inclusion criteria (newly diagnosed GBM, radiotherapy with concomitant and adjuvant chemotherapy) and were dichotomised into metabolically active tumour (MAT) (n=21) and treatment-induced changes (TIC) (n=11) groups on the basis of histology and/or clinical/imaging 6 months follow-up retrospective review. FET-PET enhancing 3D-ROIs were coregistered to the diffusion tensor (DT) and diffusion kurtosis (DK) maps and mean parameter values, centiles (C5, C10, C90, C95), quartiles, peak locations and peak heights were extrapolated from corresponding histograms. FET-PET quantitative (TBRmax, TBRmean) and semi-quantitative metrics (time-activity-curves) complemented the analysis. Group differences were investigated with Mann-Whitney tests. Logistic regression was used to explore the predictive power and odds of the histogram and FET-PET metrics in the MAT group, and ROC analysis to find the threshold values with the highest diagnostic accuracy.Results and Discussion
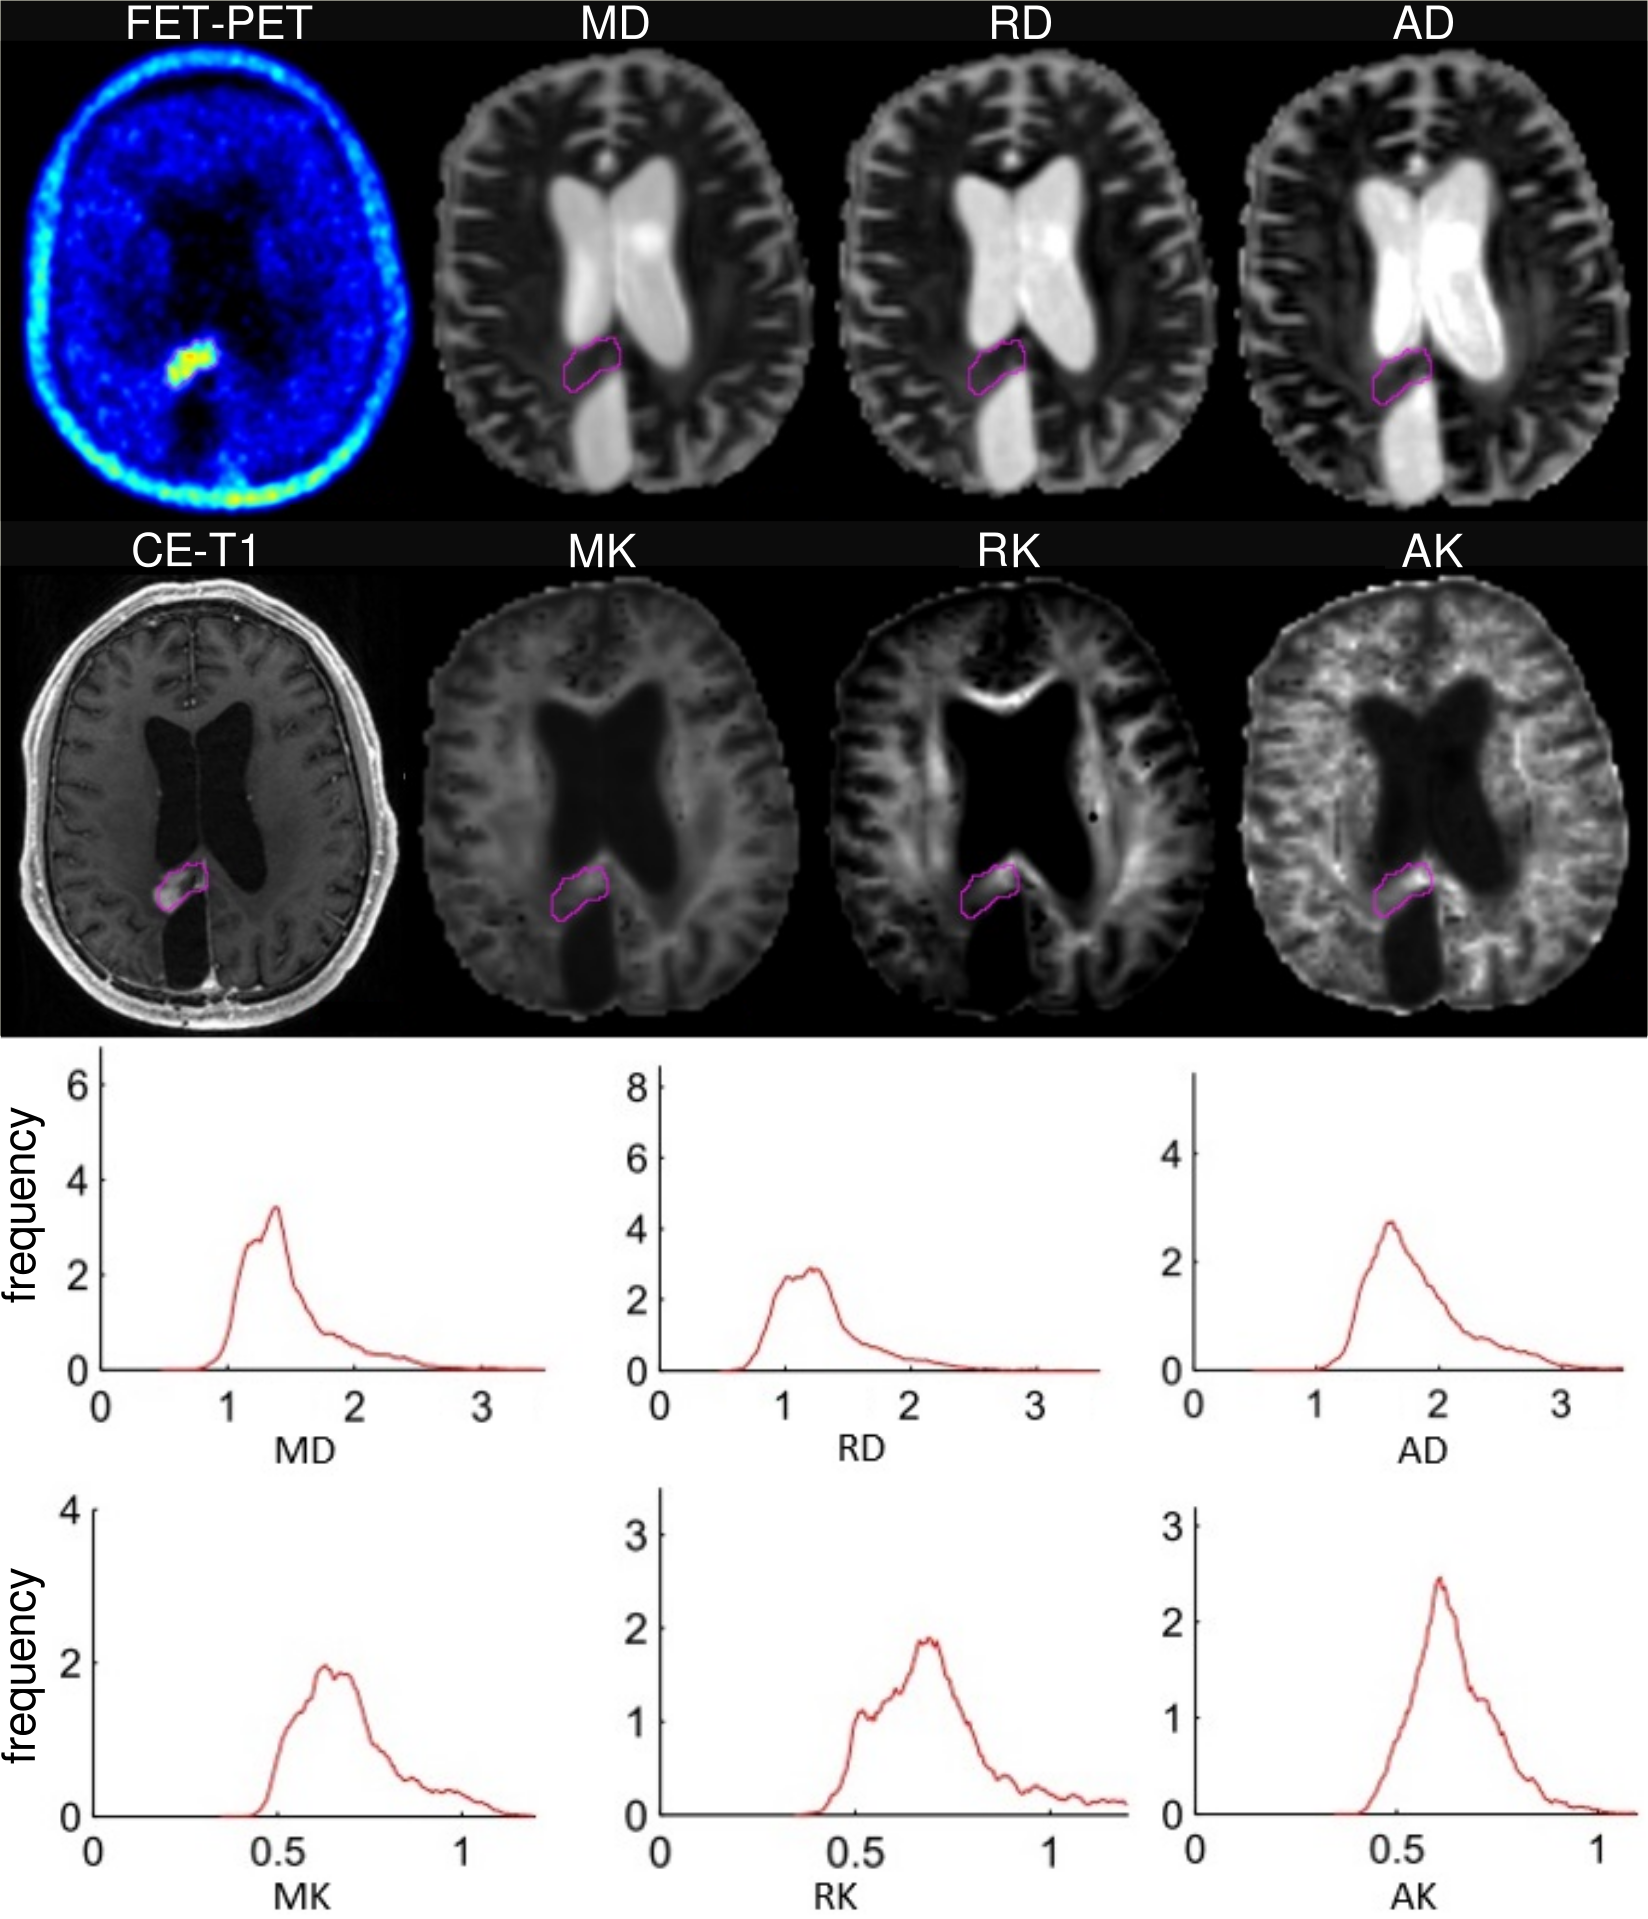
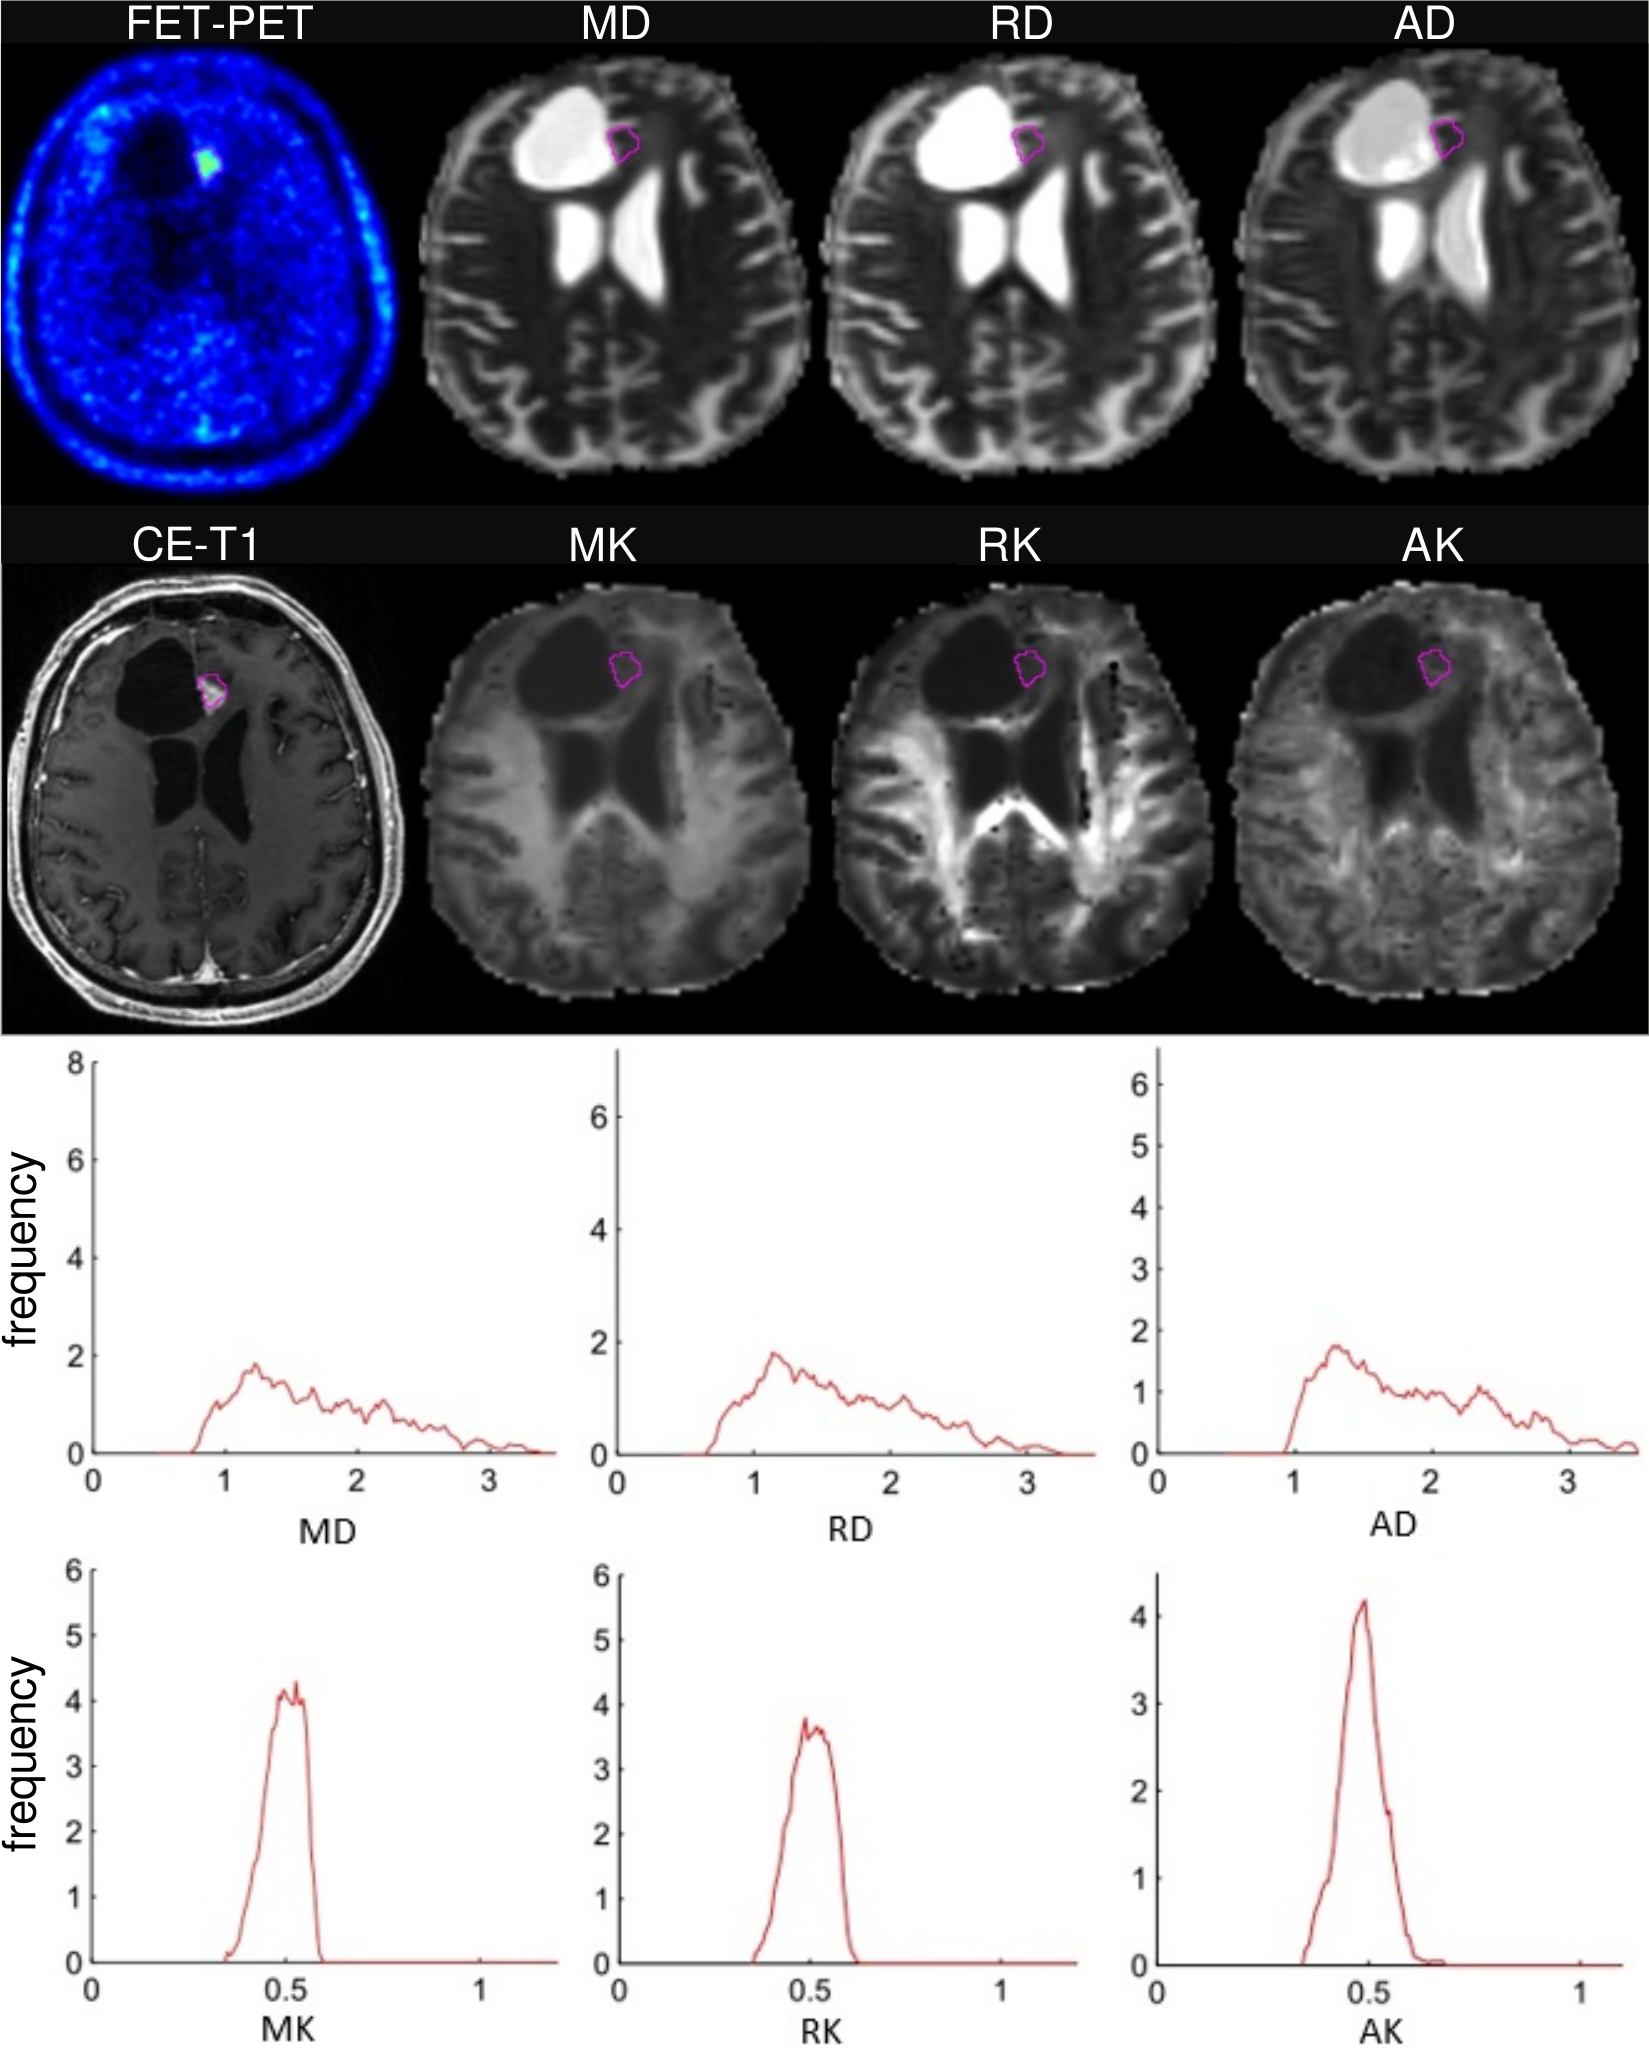
Examples of FET-uptake, DT/KT parameter maps, and the corresponding histograms for one patient from each of MAT and TIC group are shown in Figures 1 and 2. In the TIC patient, diffusivity histograms constitute larger areas with higher values, whereas KT histograms are clearly shifted towards lower values in comparison to the patient from the MAT group. This feature was also retained on the group-level comparison, i.e., DT/KT histogram parameters were significantly higher/lower in the TIC compared to MAT group. Comparisons of histogram metrics in DT indices showed lower values for mean/axial/radial (MD/AD/RD) diffusivity in the MAT group compared to the TIC group, however, the differences did not reach statistical significance (p>0.05). In contrast, significant (p<0.05) between-group differences were found in KT metrics, that is, in the means of mean/axial/radial (MK/AK/RK) kurtoses, and in centiles of MK/RK from C25 to C95 and of AK from C10 to C90. Univariate logistic regression showed highly independent classificatory power for higher-end centiles of MK parameters (81%), RK (78%), AK and for TBRmax (75%). Multivariate stepwise logistic regression model retaining MK C95 and TBRmax correctly classified 91% of subjects.
This is the first study combining metabolic information from FET-PET with microstructural information from advanced DTI/DKI in treated GBM patients. GBM are well known for their heterogeneity, a hallmark of tumours that may play a crucial role in cancer outcome.8 Intra-tumour heterogeneity at different levels, including spatial, tends to confound diagnosis and challenges the planning of effective therapies. Currently, intra-tumour heterogeneity is becoming an important area in the study of malignancy.8 Our novel approach combining metabolic information from 18F-PET-FET with specific histogram analysis of KT parameters allows one to reduce obliterating effect of lesion heterogeneity and should help to find the most accurate descriptors of neoplasm and altered-by-treatment but non-neoplasm tissues.
Conclusions
This study showed the potential utility of delineating 3D ROIs using 18F-FET-PET and applying histogram analysis of diffusion kurtosis to differentiate high metabolically active progressive GBMs from lower metabolism lesions in treated GBMs. Taken together, our data demonstrated that our multimodal approach can improve the diagnostic assessment of tumour patients and lead to better understanding of biophysical mechanisms governing diffusion in different tissue subtypes.Acknowledgements
No acknowledgement found.References
1. Wang S, Kim S, and Melhem ER, Diffusion Tensor Imaging: Introduction and Applications to Brain Tumor Characterization, in Functional Brain Tumor Imaging, J.J. Pillai (ed.), Springer, New York 2014, DOI 10.1007/978-1-4419-5858-7_2, 27
2. S. Van Cauter, J. Veraart, J. Sijbers, et al., Gliomas: Diffusion Kurtosis MR Imaging in Grading, Radiology: volume 263, number 2, May 2012 (radiology.rsna.org).
3. P. Raab, E. Hattingen, K. Franz, et al., Cerebral Gliomas: Diffusional Kurtosis Imaging Analysis of Microstructural Differences, Radiology: volume 254, number 3, March 2010 (radiology.rsna.org).
4. N.J. Shah, Multimodal neuroimaging in humans at 9.4 T: a technological breakthrough towards an advanced metabolic imaging scanner. Brain Struct Funct. 2015, 220(4):1867-84.
5. N. Galldiks, K. Langen, R. Holy, et al. Assesment of treatment response in patients with glioblastoma using O-(2-18F-fluoroethyl)-L-tyrosine PET in comparison to MRI. J Nucl Med 2007;48:519-527.
6. C. Filss, N. Galldiks, G. Stoffels, et al. Comparison of 18F-FET-PET and perfusion-weighted MR imaging: a PET/MR imaging hybrid study in patients with brain tumours. J Nucl Med 2014, 55:540-545.
7. H. Herzog, K. Langen, C. Weirich, et al. High-resolution BrainPET combined with simultaneous MRI. Nuklearmedizin 2011, 50:74-82.
8. Maria-del-Mar Inda, Rudy Bonavia, and Joan Seoane, Glioblastoma Multiforme: A Look Inside Its Heterogeneous Nature, Cancers (Basel), 2014, 6(1): 226–239.
Figures