1231
A High Resolution Gradient-Echo/Spin-Echo EPI Sequence for Vessel Architecture Imaging1Department of Radiology, German Cancer Research Center, Heidelberg, Germany, 2Department of Neuroradiology, Heidelberg University Hospital, Heidelberg, Germany, 3Institute of Neuroscience and Medicine – 4, Medical Imaging Physics, Forschungszentrum Jülich, Jülich, Germany, 4Department of Diagnostic & Interventional Radiology, German Cancer Research Center, Heidelberg, Germany, 5Department of Neurology, Faculty of Medicine, JARA, RWTH Aachen University, Aachen, Germany
Synopsis
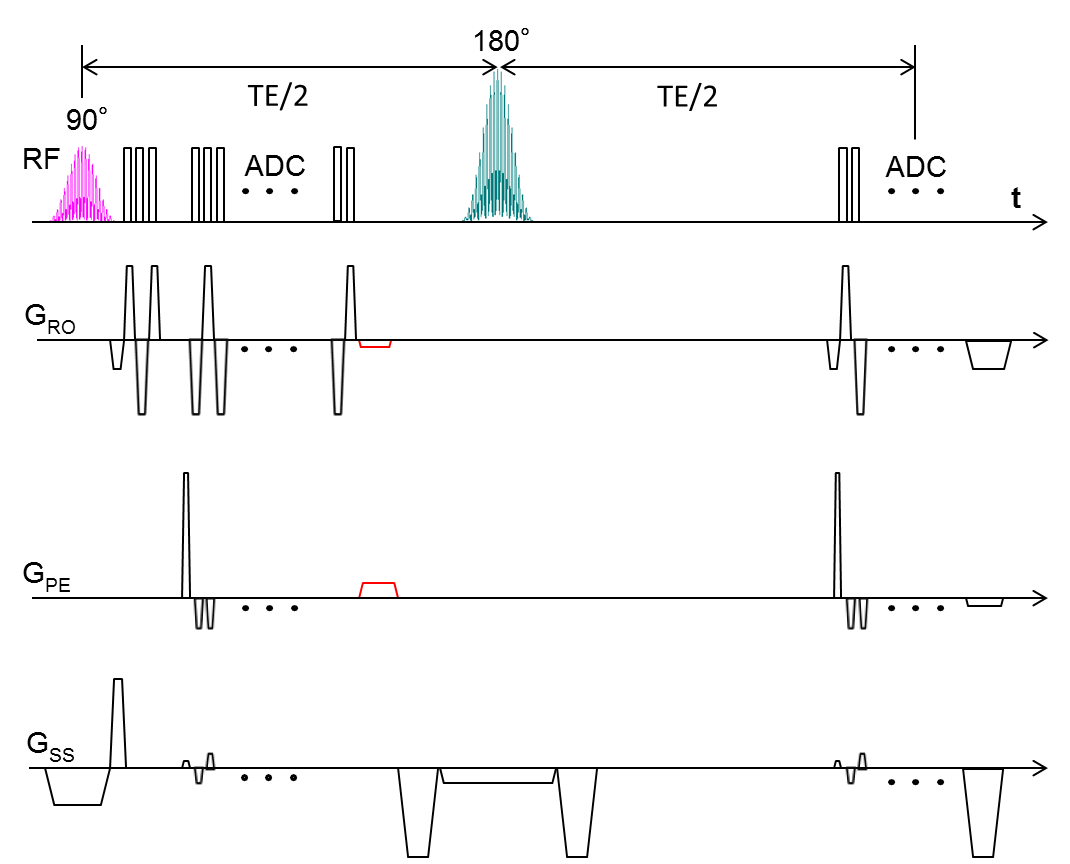
To obtain vessel architectural imaging (VAI), a dual gradient-echo/spin-echo EPI sequence is needed to simultaneously track the dynamic signal changes in both gradient echo and spin echo contrasts. However, brain coverage and in-plane matrix size in previous brain studies were limited. In this study, the multiband excitation and blipped-CAIPI techniques were applied to improve the slice coverage. To enhance the in-plane resolution, two rephasing gradients were inserted after the GE readout, to return the data acquisition to the k-space center before the SE readout and enable parallel imaging techniques.
INTRODUCTION
Vessel architecture imaging (VAI) MRI is a useful technique for noninvasive measurement of topological and structural heterogeneity of the microvasculature1,2. To obtain VAI, a dual GE/SE EPI sequence is needed to simultaneously track the dynamic signal changes in both GE and SE contrasts after the injection of contrast agent. However, the brain coverage and the in-plane matrix size in previous brain studies were limited3,4. In this study, the MB (multiband) excitation and blipped-CAIPI (blipped-controlled aliasing in parallel imaging) techniques were applied to improve the slice coverage. To enhance the in-plane resolution, two rephasing gradients were inserted after the GE readout, which returns the data acquisition to the k-space center before the SE readout, to easily enable parallel imaging techniques (Fig. 1).METHODS
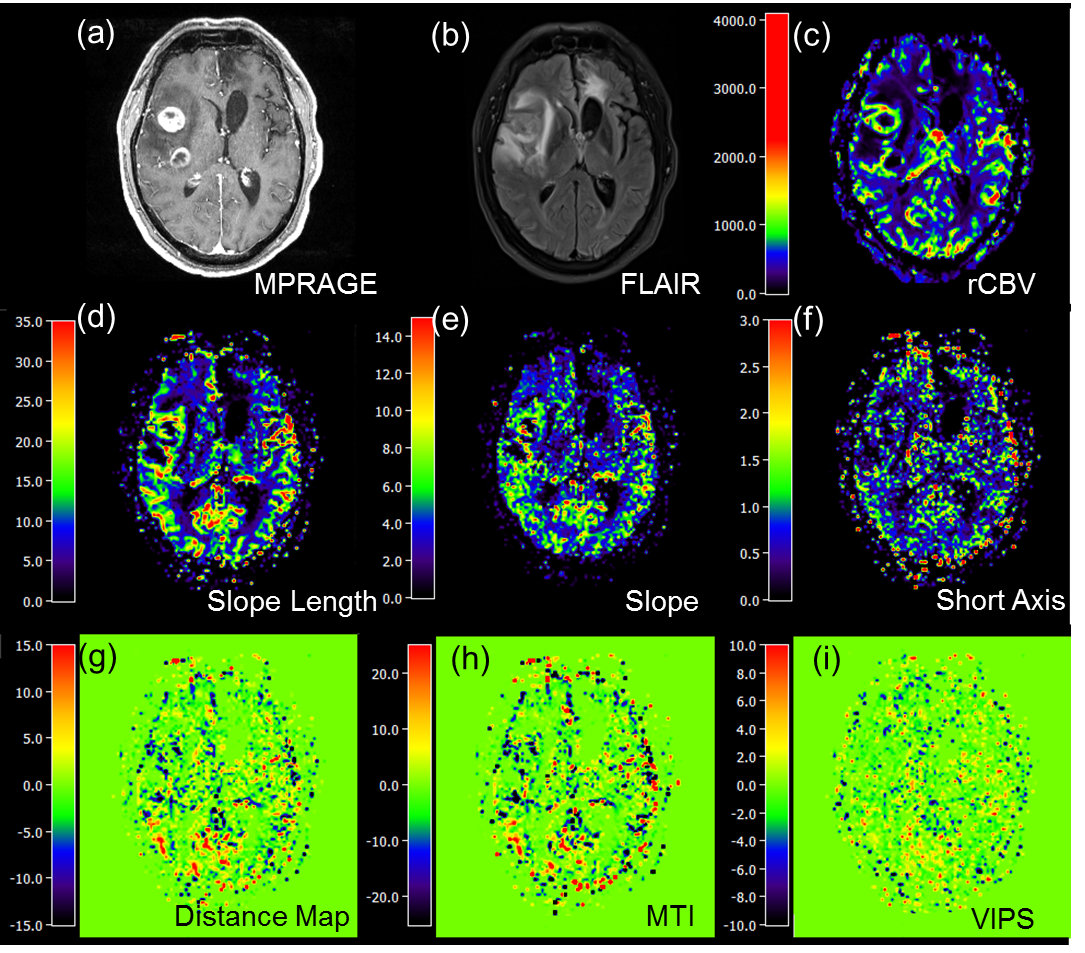
32 patients with gliomas were scanned using a 20-channel head receive RF coil on a 3T Prisma Siemens scanner (Siemens Healthcare, Erlangen, Germany). By using readouts of dual GE/SE 2D EPI, 60 measurements including 10 baseline measurements were obtained in 1.5 minutes. Sequence parameters were as follows: TE (GE/SE)=22/90 ms, dim=120×120×24, MB factor=2, iPAT factor=3, resolution=2×2×4.5 mm3, TR=1.5s. Before VAI analysis, motion correction including realign and reslicing was achieved with SPM (Wellcome Trust Center for Neuroimaging, UCL, London, UK). The truncated relaxation rate time curves were fitted with a gamma-variate function2,5. VAI analysis was performed using in-house developed MATLAB code (MathWorks, Natick, MA). For analysis of the VAI parameters, the mean value and standard deviation at five different regions of interests (ROI) were calculated: (a) tumor, (b) peritumoral non-edematous tissue, (c) peritumoral edema, (d) contralateral normal appearing brain tissue (cNAB), and (e) necrosis. ROIs were manually drawn for each patient based on the features seen in the FLAIR and the contrast-enhanced T1-weighted images, respectively.RESULTS
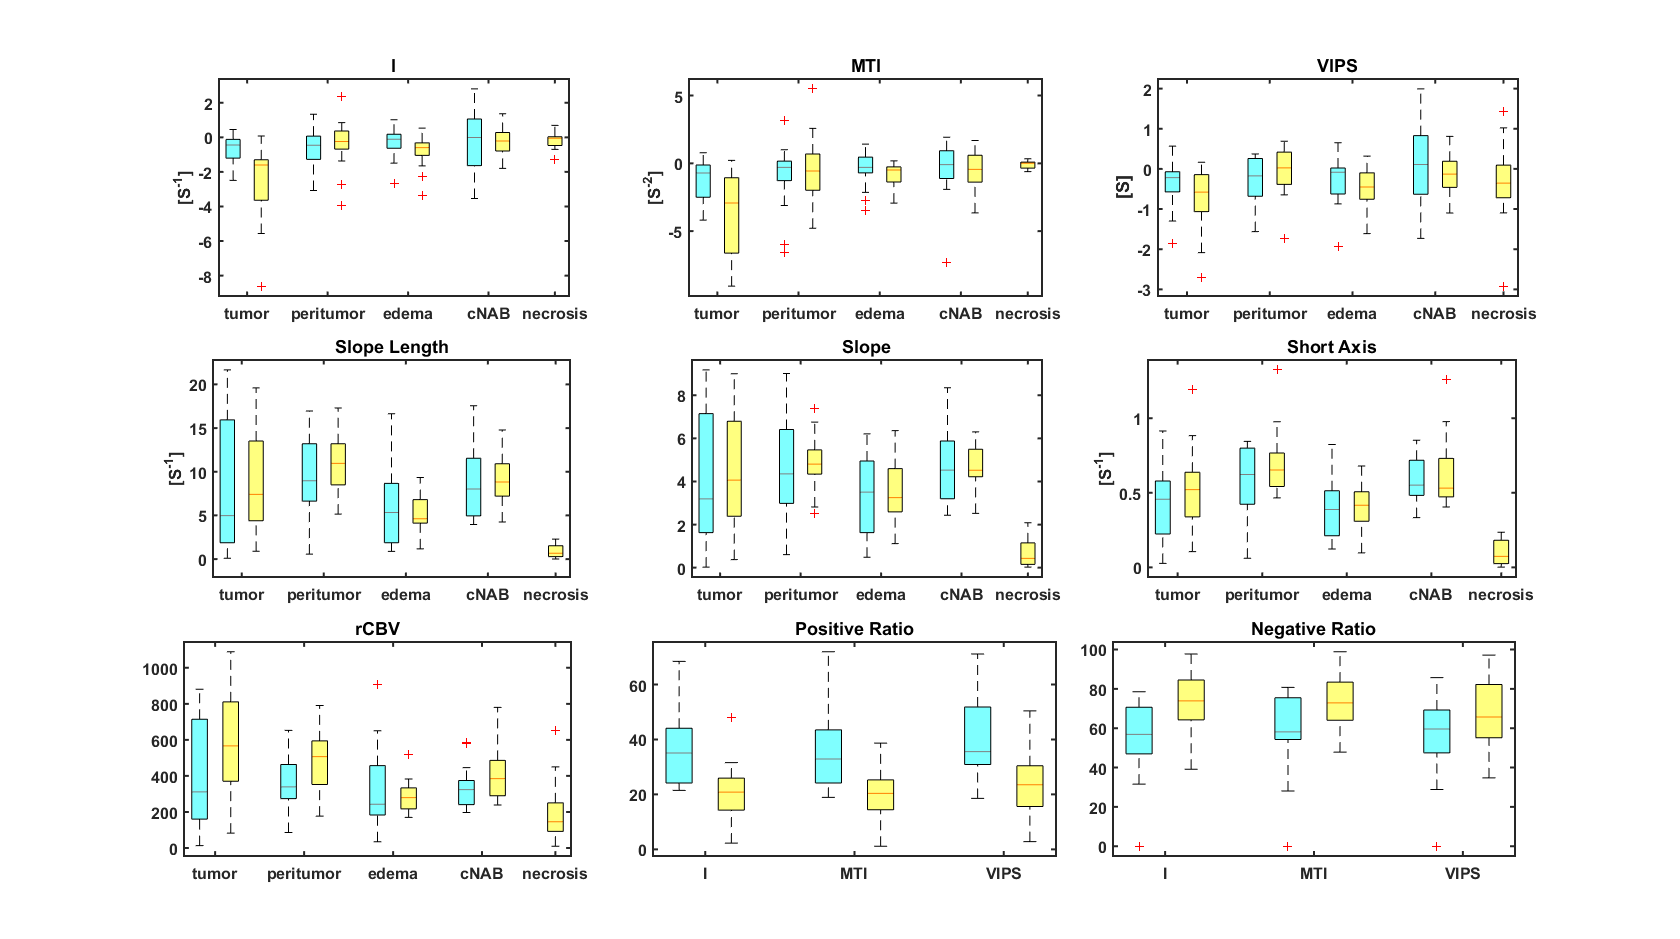
A VHL from a voxel at the region of the middle cerebral artery is represented in Fig. 2. After plotting the relaxation rate curves in a point-by-point time-parametrized plot, we uncover a clockwise loop that is typical for large arterial inflow. Multiple VAI parameters can be calculated from this curve: the maximum distance between ascending and descending branches of the loop (I); the long axis (slope length), short axis and signed area of the vortex curve (microvessel type indicator MTI), the gradient of the long axis (slope), as well as the vascular-induced bolus peak-time shift (VIPS) between the SE- and GE-EPI signal curves, see Fig. 3. To further examine differences in tumor grades among the different VAI parameters, we performed a ROI-based quantitative analysis that revealed that VAI parameters I and MTI to be significantly decreased in the tumor core of HGG patients compared to LGG patients. Within the HGG patient collective (yellow boxes in Fig. 4), these VAI parameters were also lower in the tumor core than in the peritumor, edema and cNAB regions.CONCLUSION
A
high resolution GE/SE EPI sequence for VAI was implemented. By using MB
excitation and blipped-CAIPI techniques, whole
brain coverage GE/SE EPI was reached. By inserting the rephasing gradient after the GE EPI, a
higher in-plane resolution can be easily achieved by exploiting parallel
techniques. The VAI parametric maps derived from this sequence provide
insights into the complexity and heterogeneity of vascular changes in brain
tumor.Acknowledgements
This work was supported by grants from the Deutsche Forschungsgemeinschaft (Contract Grant number: DFG ZI 1295/2-1 and DFG KU 3555/1-1). F. T. Kurz was also supported by a postdoctoral fellowship from the medical faculty of Heidelberg University and the Hoffmann-Klose foundation of Heidelberg University.References
1. Emblem KE, Mouridsen K, Bjornerud A, et al. Vessel architectural imaging identifies cancer patient responders to anti-angiogenic therapy. Nat Med 2013;19(9):1178-1183.
2. Stadlbauer A, et al. Magnetic resonance imaging biomarkers for clinical routine assessment of microvascular architecture in glioma. J Cereb Blood Flow Metab 2016;37(2):632-643.
3. Kiselev VG, Strecker R, Ziyeh S, et al. Vessel size imaging in humans. Magn Reson Med 2005; 53: 553–563.
4. Xu C, Kiselev VG, Möller HE, et al. Dynamic hysteresis between gradient echo and spin echo attenuations in dynamic susceptibility contrast imaging. Magn Reson Med 2013; 69: 981–991.
5. Rausch M, Scheffler K, Rudin M, et al. Analysis of input functions from different arterial branches with gamma variate functions and cluster analysis for quantitative blood volume measurements. Magn Reson Imaging 2000;18(10):1235-43.
Figures