1229
Intracranial flow measurements at 7T gated with Doppler Ultrasound1Lund University Bioimaging Center, Lund University, Lund, Sweden, 2Dept. of Diagnostic and Interventional Radiology and Nuclear Medicine, University Medical Center Hamburg-Eppendorf, Hamburg, Germany, 3nnorth medical Gmbh, Hamburg, Germany, 4Dept. of Diagnostic Radiology, Lund University, Lund, Sweden
Synopsis
Intracranial flow measurements at high field (7T) has the potential to give new information on hemodynamic properties. However, the strong field disturbs ECG gating, possibly compromising image quality. This work investigates possible benefits of using Doppler ultrasound (DUS) cardiac triggering compared to ECG–triggering in throughplane (2D) flow measurements at 7T. 2D flow was acquired using both ECG and DUS triggering in random order in healthy volunteers (n=8). The DUS was found to have a higher trigger sensitivity and fewer false negative and positive triggers. Flow and velocity results did not differ between ECG and DUS triggering.
Introduction
Intracranial blood flow measurements at high field (7T) has potential to provide new information for diagnosis and follow-up of disease. However, cardiac synchronization is known to be more unreliable at 7T1, for example as the magnetohydrodynamic effect resulting from interaction of the flowing blood with the static magnetic field increases at higher field strengths. This can cause the standard cardiac triggering algorithms of MRI scanners, based on an electrocardiogram (ECG) to either fail or detect the wrong peak in the ECG signal. Another option of cardiac triggering, peripheral pulse oximetry (PPU), is often disturbed by gradient switching and patient hand motion.
A technique to achieve cardiac synchronization using a Doppler ultrasound (DUS) device has recently been developed2,3. The device consists of one small ultrasound transducer attached to the subjects’ chest and a signal processing unit using tailored algorithms to transform the signal into triggers for the MRI-system. The DUS gating system has previously been successfully applied to both adult cardiac imaging at 3T and 7T, and for fetal imaging at 1.5T. However, DUS gating for intracranial flow measurements at 7T has not previously been evaluated. Therefore, the aim of this project is to validate the use of the ultrasound triggering device at 7T for the application of flow measurements, with ECG as reference standard.
Methods
All data was acquired on a 7.0T AS Acheiva (Philips, Best, the Netherlands) using a NOVA 2Tx/32Rx head coil (NOVA Medical, Wilmington, MA, USA). Safety was ensured by comparing B1-maps in a phantom with and without the DUS device present.
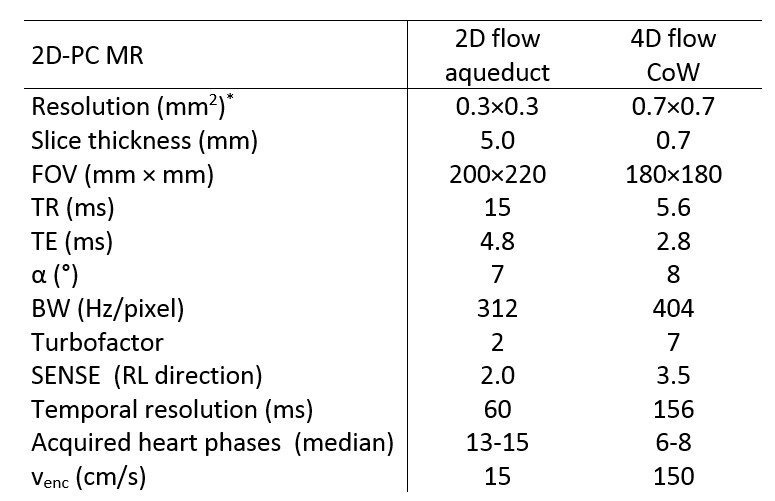
Volunteers (n=8) without cardiovascular disease and with normal heart rates (mean: 60 bpm, range: 54-74 bpm) were scanned for the study. 2D flow measurements of CSF flow in the aqueduct4 and 4D flow measurements over the Circle of Willis (CoW) were performed with both DUS and standard vector-ECG triggering, in randomized order. In both cases, the peripheral pulse oximeter unit (PPU) was recorded as reference signal. The physiology signals, including detected trigger points, were logged. Sequence parameters are presented in Fig. 1. From the physiology log, the RR intervals (length and variability), number of false negative and false positive triggers and trigger sensitivity were extracted. A trigger was regarded as a false positive if it did not correlate with a heart beat. The false negative (missed) triggers were defined as a measured RR-interval being greater than 150% of the mean RR-interval, assuming a heart rate variation in the normal range. The trigger sensitivity was extracted as 100-(false negatives+false positives)/total number of triggers.
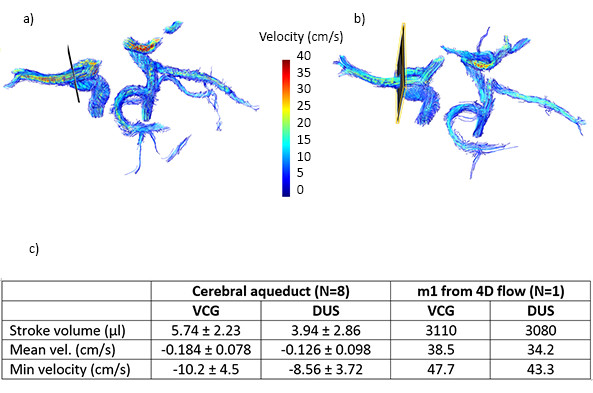
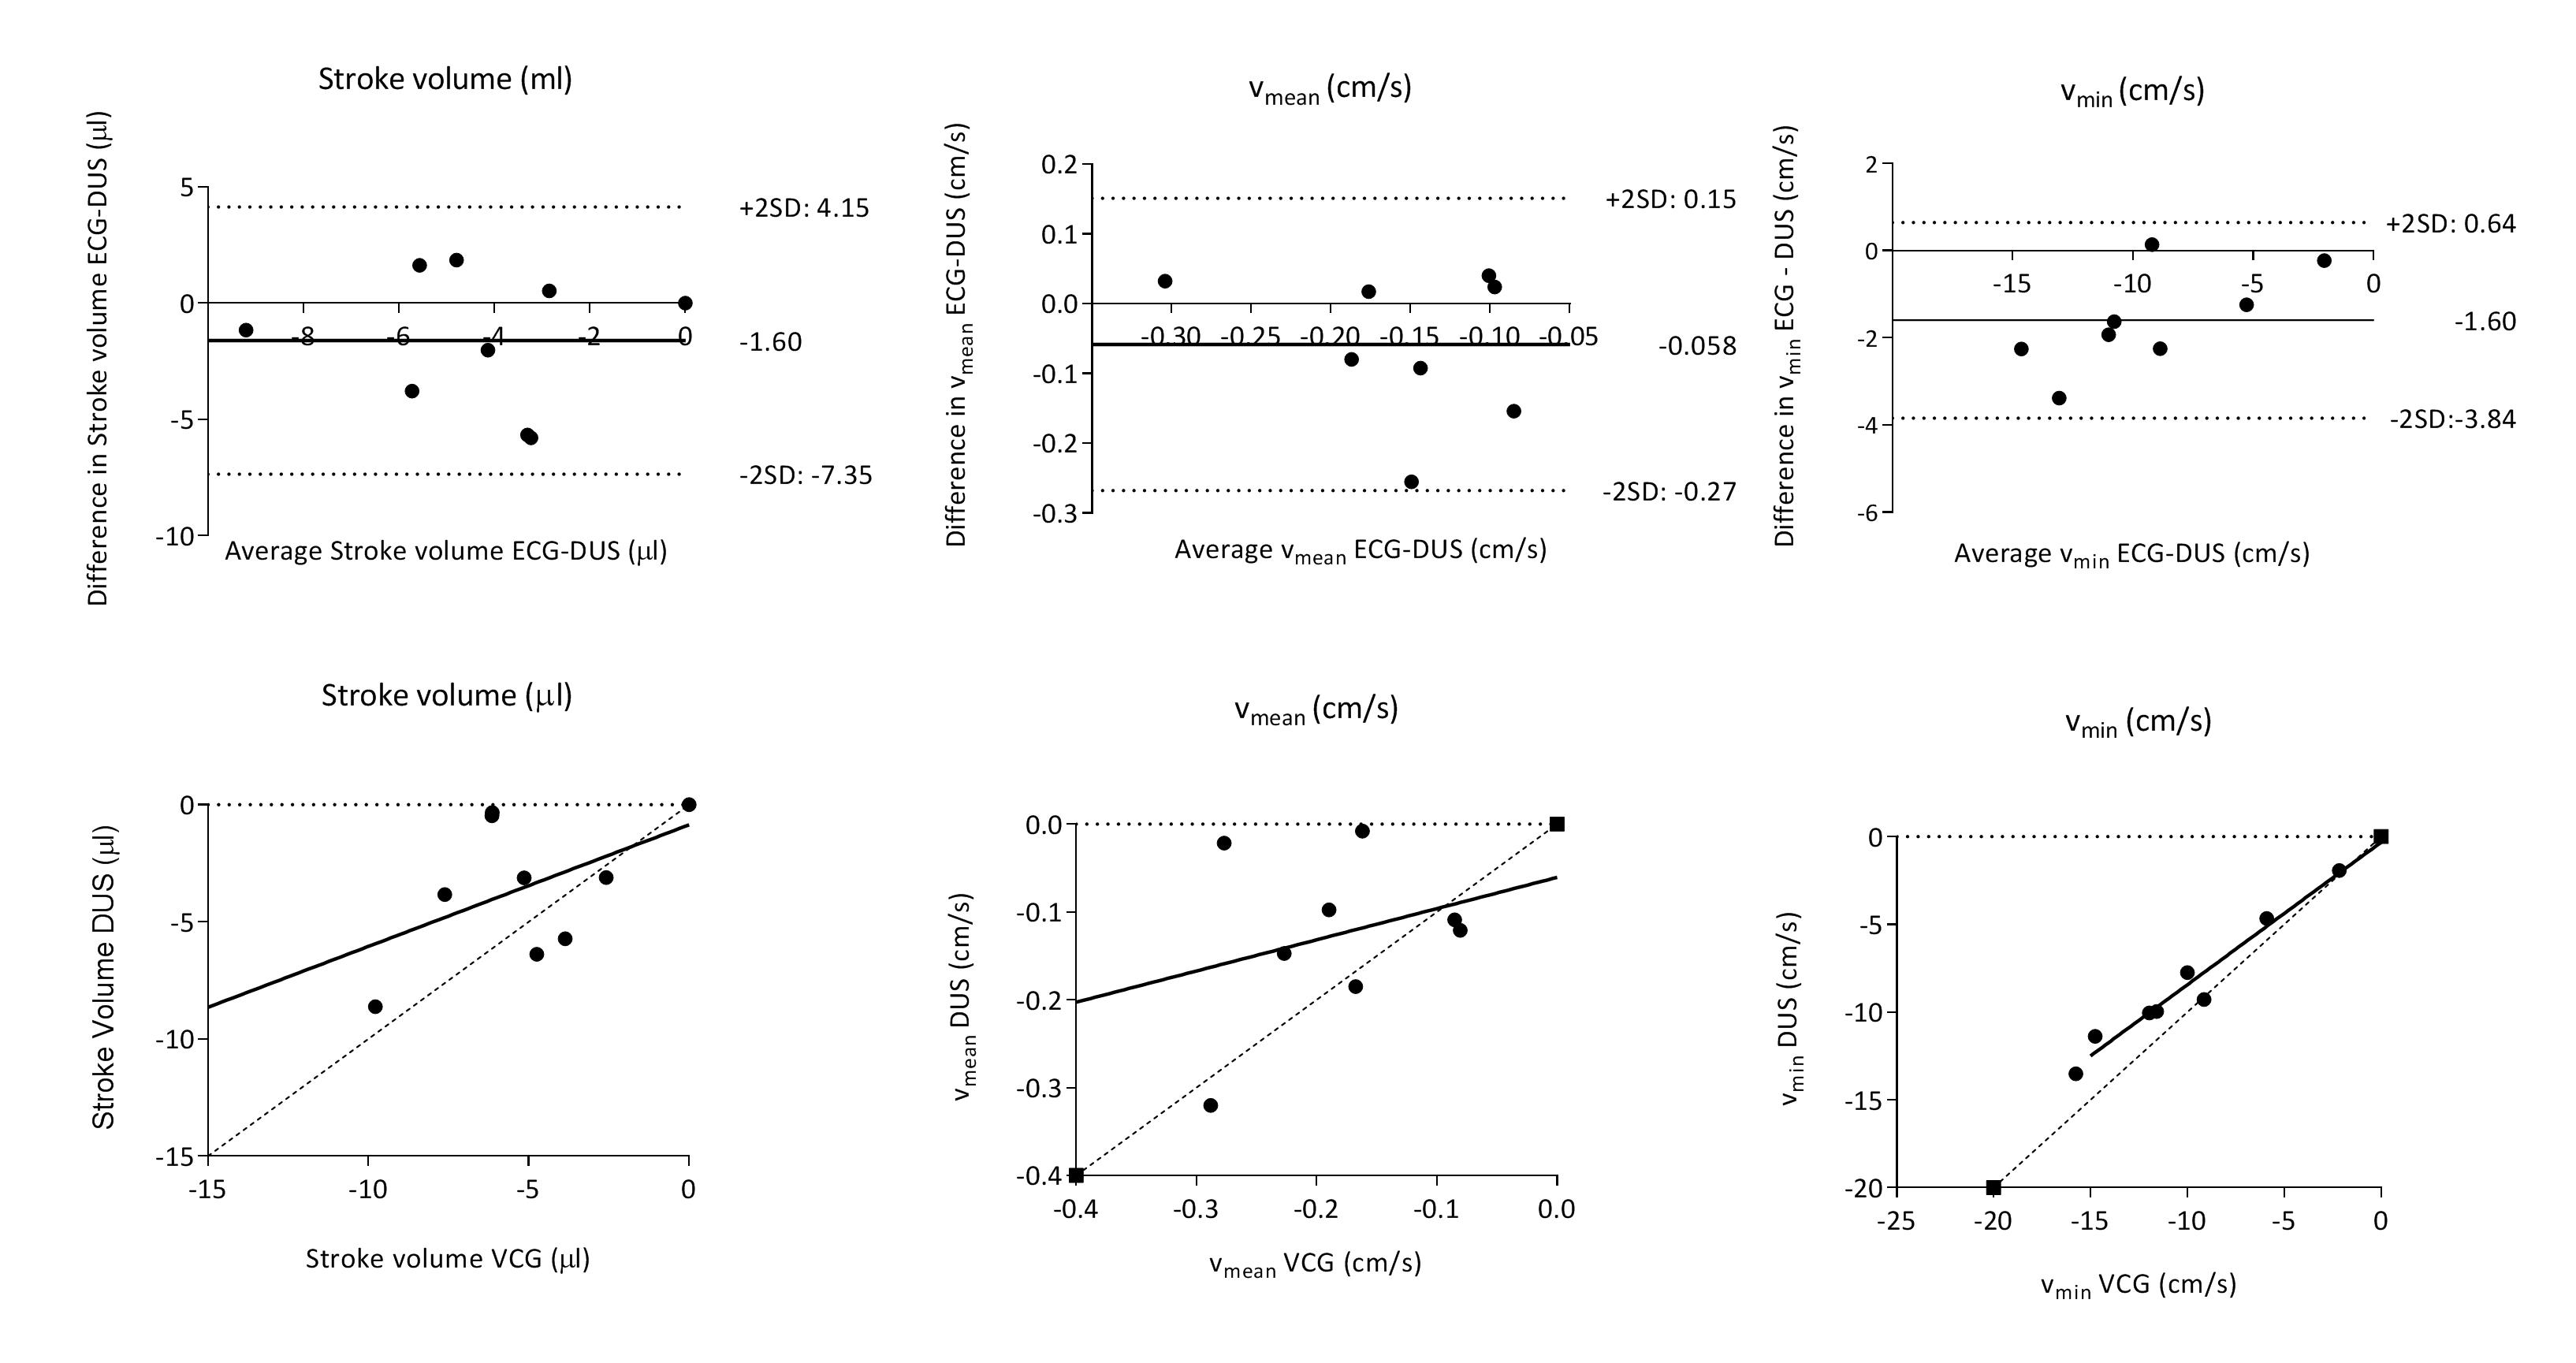
Flow in the cerebral aqueduct was analyzed using custom plugins to Segment v2.1 R58805. Background corrections were performed by a linear fit to static tissue regions. The stroke volume, mean velocity and min velocity were compared for ECG and DUS triggering using Wilcoxons test. In one subject, 4D flow quantification and visualizations were done using GTflow (v3.0.23, Gyrotools, Zurich, Switzerland). Flow values were extracted from analysis planes were placed in the m1 (Fig. 2)
Results and Discussion
Phantom B1 maps showed no influence of the DUS device, and DUS-triggering was successful in all scans. In two subjects, the ECG-signal was unreliable, resulting in several scan aborts. Four 2D flow scans had to be re-aquired, and one 4D flow scan could not be acquired with ECG at all.
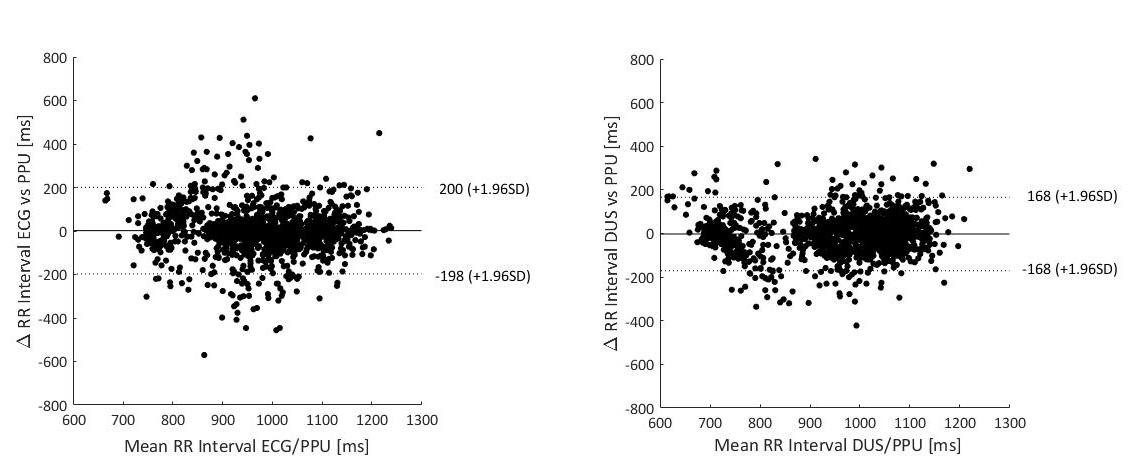
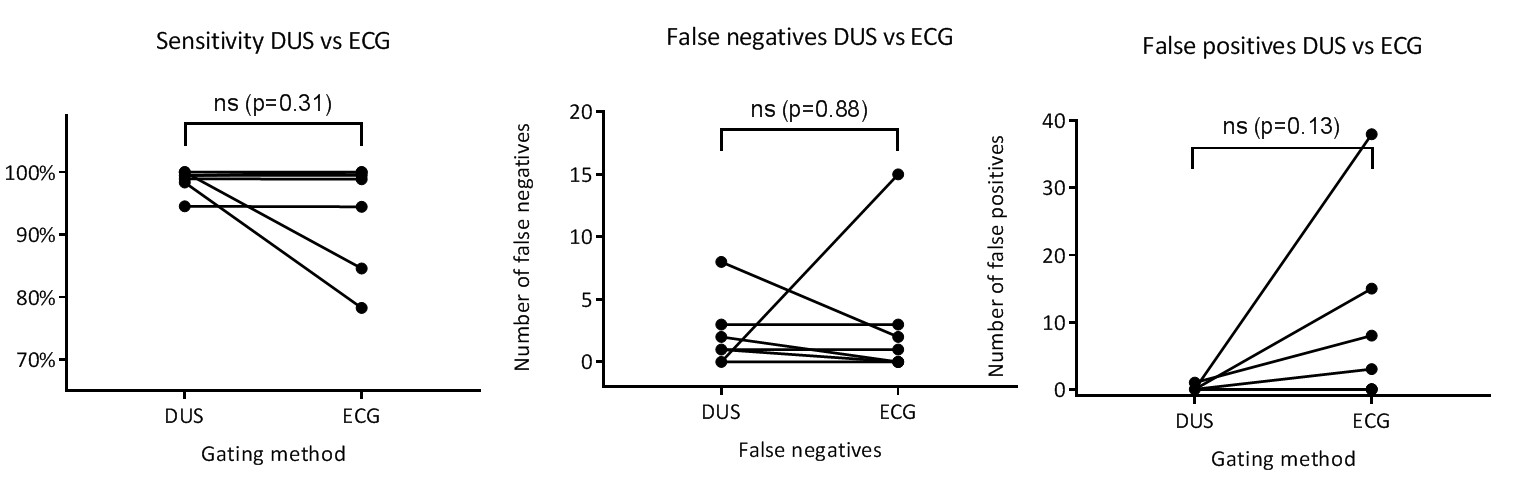
Mean RR-intervals were the same in the two gating methods, but the variability was higher in the ECG-gating case (Fig. 3). The number of false negative and positive triggers were lower for the DUS gating, and the overall gating sensitivity was therefore higher, 98.7±1.7% and 93.7±8.1% for DUS and ECG, respectively (Fig 4).
Flow and velocity results are shown in Fig. 2c. Comparing ECG- and DUS-synchronization, there were no significant differences in flow or velocity parameters (Fig. 5).
The 4D flow quantification in m1 gave net flow/heart beat 3.11 ml and 3.08 ml for ECG and DUS-triggering, respectively (Fig. 2c).
The US-triggered scans showed pulsation artefacts to a higher degree than the ECG-triggered counterparts and in 25% of subjects this caused a blurring of the vessel. This is believed to be caused by electronic disturbances in the experimental DUS-setup and warrants further investigation.
Conclusion
The DUS gating gave fewer false triggers and had a higher trigger sensitivity than ECG-gating. No differences in quantitative flow results were found in this small sample. This makes DUS-triggering a promising technique for neurovascular flow measurements at 7T.Acknowledgements
No acknowledgement found.References
1. Krug JW, Rose G, Stucht D, et al. Limitations of ECG based gating methods in ultra high field cardiac MRI. JCMR 2013;15:S1W19
2. Kording F, Ruprecht C, Schoenagel B, et al, Doppler Ultrasound Triggering for Cardiac Magnetic Resonance Imaging at 7 Tesla, ISMRM 2106, #0494
3. Kording F, Schoennagel B, Lund G, et al. Doppler ultrasound compared with electrocardiogram and pulse oximetry cardiac triggering: A pilot study. MRM 2015;74:1257-1265
4. Markenroth Bloch K, Töger J, Ståhlberg F, Investigation of cerebrospinal fluid flow in the cerebral aqueduct using high-resolution phase contrast measurements at 7T MRI, Epub ahead of print, Acta Radiologica Nov. 2017
5. Heiberg E, Sjögren J, Ugander M et al. Design and validation of Segment - freely available software for cardiovascular image analysis. BMC Med Imaging 2010; 10:1
Figures