1226
Sing-vessel cerebral blood flow (velocity) fMRI with phase-contrast imaging1High-Field Magnetic Resonance, Max Planck Institute for Biological Cybernetics, Tuebingen, Germany, 2University of Tuebingen, Tuebingen, Germany, 3Neurology, Renmin Hospital of Wuhan Universit, Wuhan University, Wuhan, China
Synopsis
Single-vessel fMRI has been developed to map the BOLD signal from individual venules and the CBV signal from individual arterioles penetrating the cortex of anesthetized rats. Here, we applied phase-contrast (PC) imaging to measure the velocity of blood flow from individual penetrating arterioles and venules, which could be characterized as dark and bright dots in an arteriole-venule map with a multi gradient-echo sequence. The neuronal activity-coupled cerebral blood flow (CBF) changes can be directly measured with the PC-based velocity mapping from individual vessels. Thus, we have established single-vessel CBF fMRI mapping with phase-contrast imaging.
Introduction
Cerebral blood flow (CBF) measurement has been applied to evaluate the normal physiology and pathophysiology (e.g. stroke and cancer) in both clinical and pre-clinical MRI studies1, 2, 3. Arterial spin-labeling (ASL)4, 5 and dynamic contrast (DSC) perfusion MRI6 have been routinely used to measure CBF. These methods have the limitation to supply the quantitative information of the flow direction and velocity. Phase-contrast (PC) imaging measures the phase shift in voxels with moving spins so as to quantify the velocity of blood flow in vessels7. Here, we applied PC imaging at very high spatial resolution to measure the velocity of blood flow from individual arterioles and venules penetrating the cortex of anesthetized rats. In addition, we have directly mapped the sensory-evoked velocity changes of CBF from individual vessels. Following the single-vessel BOLD and CBV fMRI methods8, we developed single-vessel cerebral blood flow (velocity) fMRI mapping method with phase-contrast imaging.Methods
fMRI were performed in a-chloralose anesthetized rats. The surgical procedures were described previously9. Briefly, all images were acquired with a 14.1 T/26 cm horizontal bore magnet (Magnex), interfaced to an AVANCE III console (Bruker) and equipped with a 12 cm gradient set, capable of providing 100 G/cm with a rise time of 150 μs (Resonance Research). A transreceiver surface coil with 6 mm diameter was used to acquire fMRI images. To detect the individual arterioles and venules, a 2D Multiple Gradient-Echo (MGE) sequence was used with the following parameters: TR, 50 ms; TE, 2.5, 5, 7.5, 10, 12.5, 15 ms; flip angle, 55°; FOV, 0.96x0.96x0.5 cm3 matrix, 192x192; in-plane resolution, 50x50 μm2; slice thickness,500 μm. For fMRI, the steady state free precession (SSFP) imaging method was applied to map the fMRI signal with the following parameters: TE, 7.8 ms (BOLD) /5.2 ms (CBV), TR, 15.6 ms (BOLD) /10.4167ms (CBV), flip angle 15°; FOV, 0.96x0.96x0.5 cm3; matrix, 96x96 (BOLD), in-plane resolution, 100x100 μm2; slice thickness, 500 μm. CBV-weighted signals were obtained after intravenous administration of 15-20 mg Fe/kg dextran coated iron oxide (Biopal, MA). For the PC imaging, TE, 4.2 ms TR, 15.6 ms; flip angle 30°; FOV, 0.64x0.64x0.5 cm3; matrix, 64x64, in-plane resolution, 100x100 μm2; slice thickness, 500 μm. Electrode was placed on the forepaw to deliver a 1.0 mA pulse sequence (10 s, 0.33 ms duration repeated at 3 Hz). The block design was 10 s stimulation and 50 s inter-stimulus interval. AFNI software was used for image analysis.Results
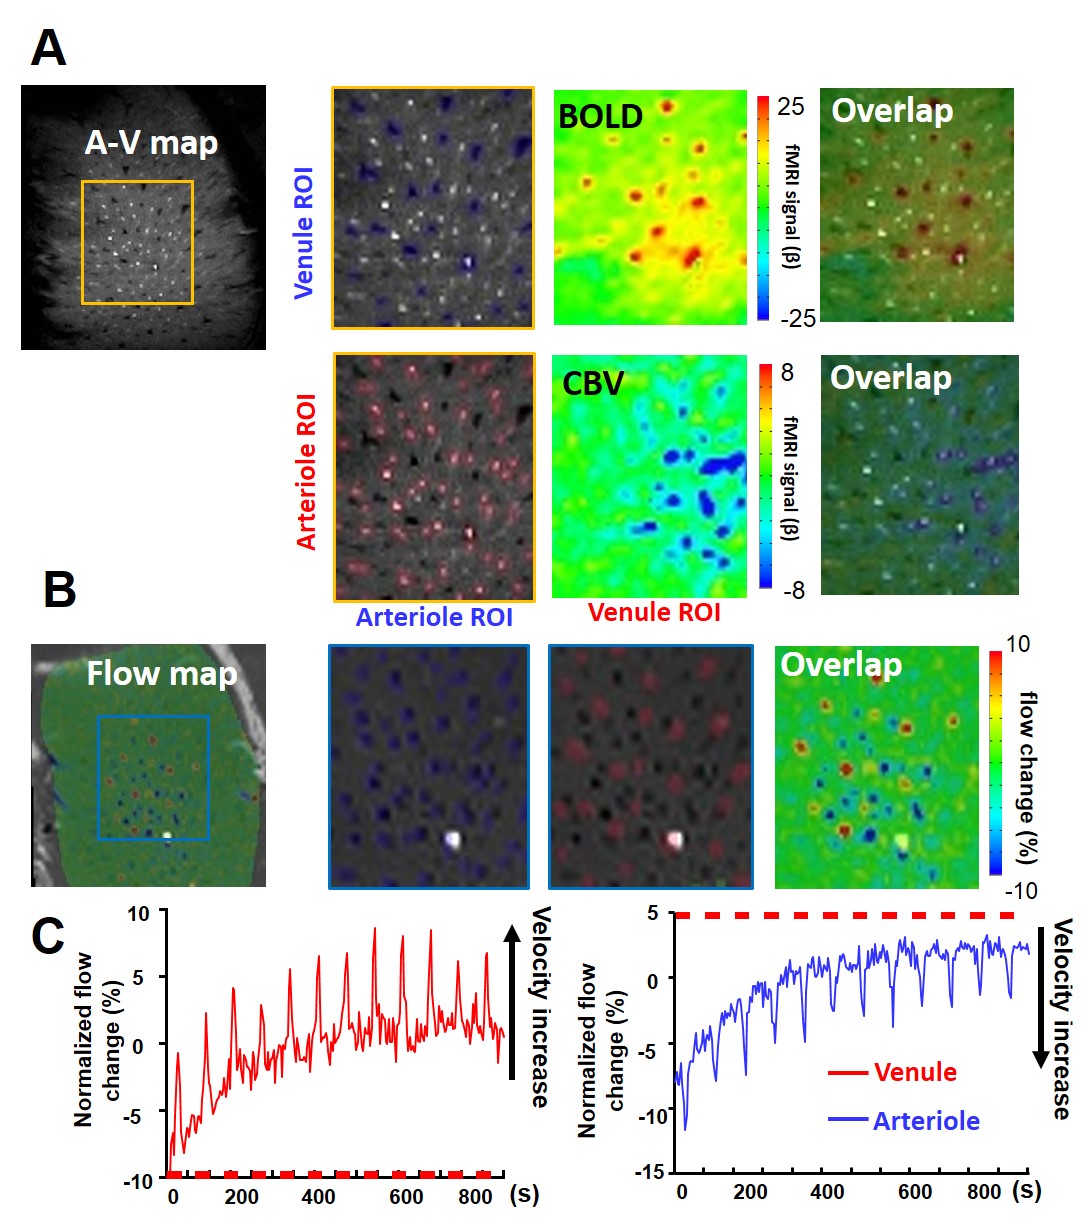
We first specified the individual venules (black dots, blue markers) and arterioles (white dots, red markers), respectively, in the rat forepaw S1 cortex from a 2D A-V map(1) (Fig 1A). The blood vessels penetrating the whole cortex showed opposite blood flow direction (Fig 1, inset). The PC-based flow-velocity map showed negative arteriole velocity (into the cortex, dark dots) and positive venule velocity (out of the cortex, bright dots) as vectors. Fig 1D shows vessel-specific scatter plots of A-V map and flow-velocity map, showing the velocity of blood from both penetrating venules and arterioles less than 3-5 mm/s consistent with previous optical studies on anesthetized rats with alpha-chloralose10. Upon electrical forepaw stimulation, we have shown that the BOLD signal was primarily located at venules and the CBV signal was mainly located at arterioles (Fig 2A). In the same 2D slice, PC-based flow-velocity fMRI detected increased velocity from both arterioles and venules stimulation (Fig 2B, time course), showing arteriole velocity values are more positive (red color) and venule velocity values are more negative (blue color) (Fig 2B). This result clearly demonstrates that CBF, CBV, and BOLD can be mapped from individual penetrating vessels in the rat brain.Conclusion
We have developed single-vessel fMRI methods to map CBV, CBF, and BOLD from individual penetrating vessels. The PC-based single-vessel CBF fMRI measurement allows us to further decipher the underlying neurovascular coupling mechanism based on the qualitatively assessment of the flow dynamic information.Acknowledgements
The financial support of the Max-Planck-Societyare gratefully acknowledged.References
1. Shen Q, Duong TQ. Magnetic Resonance Imaging of Cerebral Blood Flow in Animal Stroke Models. Brain Circ. 2016 2(1):20-27.
2. Budde MD, Gold E, et al. Phase contrast MRI is an early marker of micrometastatic breast cancer development in the rat brain NMR Biomed. 2012 25(5):726-36.
3. Muir ER, Watts LT, et al. Quantitative cerebral blood flow measurements using MRI. Methods Mol Biol. 2014 1135: 205-11.
4. Koretsky AP. Early development of arterial spin labeling to measure regional brain blood flow by MRI.Neuroimage. 2012 62(2):602-7.
5. Williams DS, Detre JA,et al. Magnetic resonance imaging of perfusion using spin inversion of arterial water. Proc Natl Acad Sci U S A. 1992 89(1):212-6.
6. Ostergaard L, Weisskoff RM, et al. High resolution measurement of cerebral blood flow using intravascular tracer bolus passages. Part I: Mathematical approach and statistical analysis. Magn Reson Med. 1996 36(5):715-25.
7. Dumoulin CL, Souza SP et al. Simultaneous acquisition of phase-contrast angiograms and stationary-tissue images with Hadamard encoding of flow-induced phase shifts. J Magn Reson Imaging. 1991 1(4):399-404.
8. Yu X, et al. Sensory and optogenetically driven single‐vessel fMRI. Nature methods 13, 337‐340 (2016).
9. Yu X, Chung S et al.Thalamocortical inputs show post-critical-period plasticity. Neuron. 2012 74(4):731-42.
10. V. J. Srinivasan et al., Depth-resolved microscopy of
cortical hemodynamics with optical coherence tomography. Optics letters 34,
3086-3088 (2009).
Figures
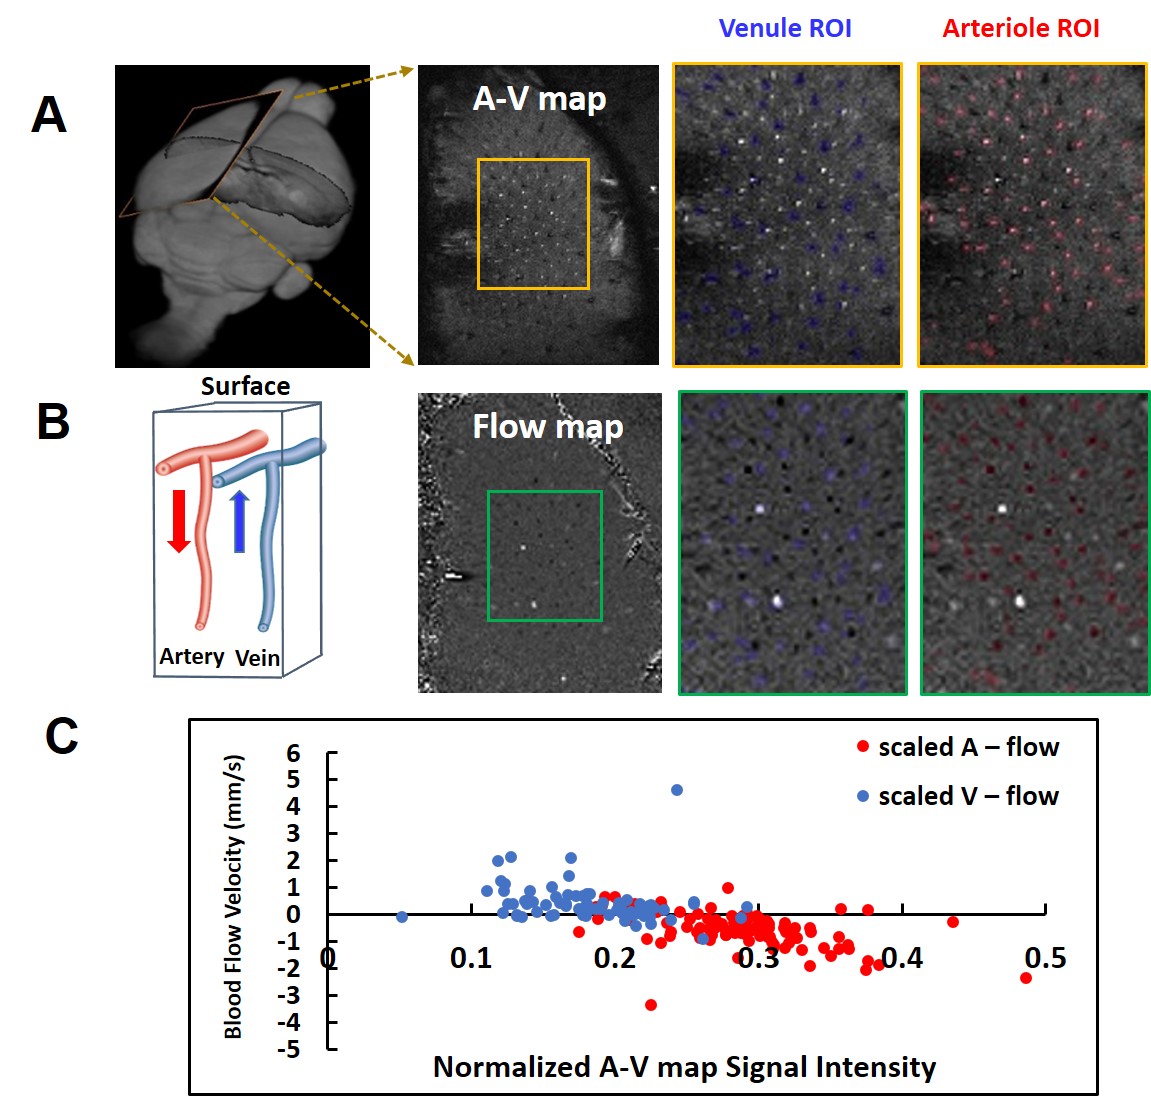
Fig 1. Single-vessel flow velocity measurement. A. The 2D A-V map of FP-S1 shows individual venules (black dots, blue markers) and arterioles (white dots, red markers). B. The vectorized flow velocity map shows the individual venules (white dots, positive velocity) and arterioles (black dots, negative velocity, inset shows the flow direction for arterioles and venules). C. The scatter plot of the flow velocity from individual arteriole and venuels as the function of the normalized signal intensity of each vessel in the A-V map.