1225
New 4D-MRA approach named 4D-APACK by integrating 4D-PACK and AccASL for visualization of long transit time artery: Investigating hemodynamics accuracy and AVM clinical case1Philips Japan, Shinagawa, Tokyo, Japan, 2Department of Clinical Radiology, Graduate School of Medical Sciences, Kyushu University, Fukuoka, Japan, 3Department of Radiology, Tokai University Hospital, Kanagawa, Japan, 4Philips Healthcare, Shinagawa, Tokyo, Japan
Synopsis
A new 4D-MRA approach named 4D-AccASL-PACK (4D-APACK) was implemented and images were acquired in six healthy volunteers and one AVM patient. 4D-APACK consists of 4D-PACK and acceleration-selective arterial spin labeling (AccASL) for obtaining efficiently both dynamic information and ATT independent visualization of very slow flow. 4D-APACK replaces last timepoint data of 4D-PACK with AccASL. To investigate hemodynamics accuracy for 4D-APACK, ATT correlation between 4D-pCASL and 4D-APACK and contamination of sinuses were measured. The vessel visualization of MCA M1 to M4 were compared with 4D-pCASL. We demonstrate that 4D-APACK brings reliable hemodynamic information comparable to 4D-pCASL, while retaining MCA visualization performance.
INTRODUCTION
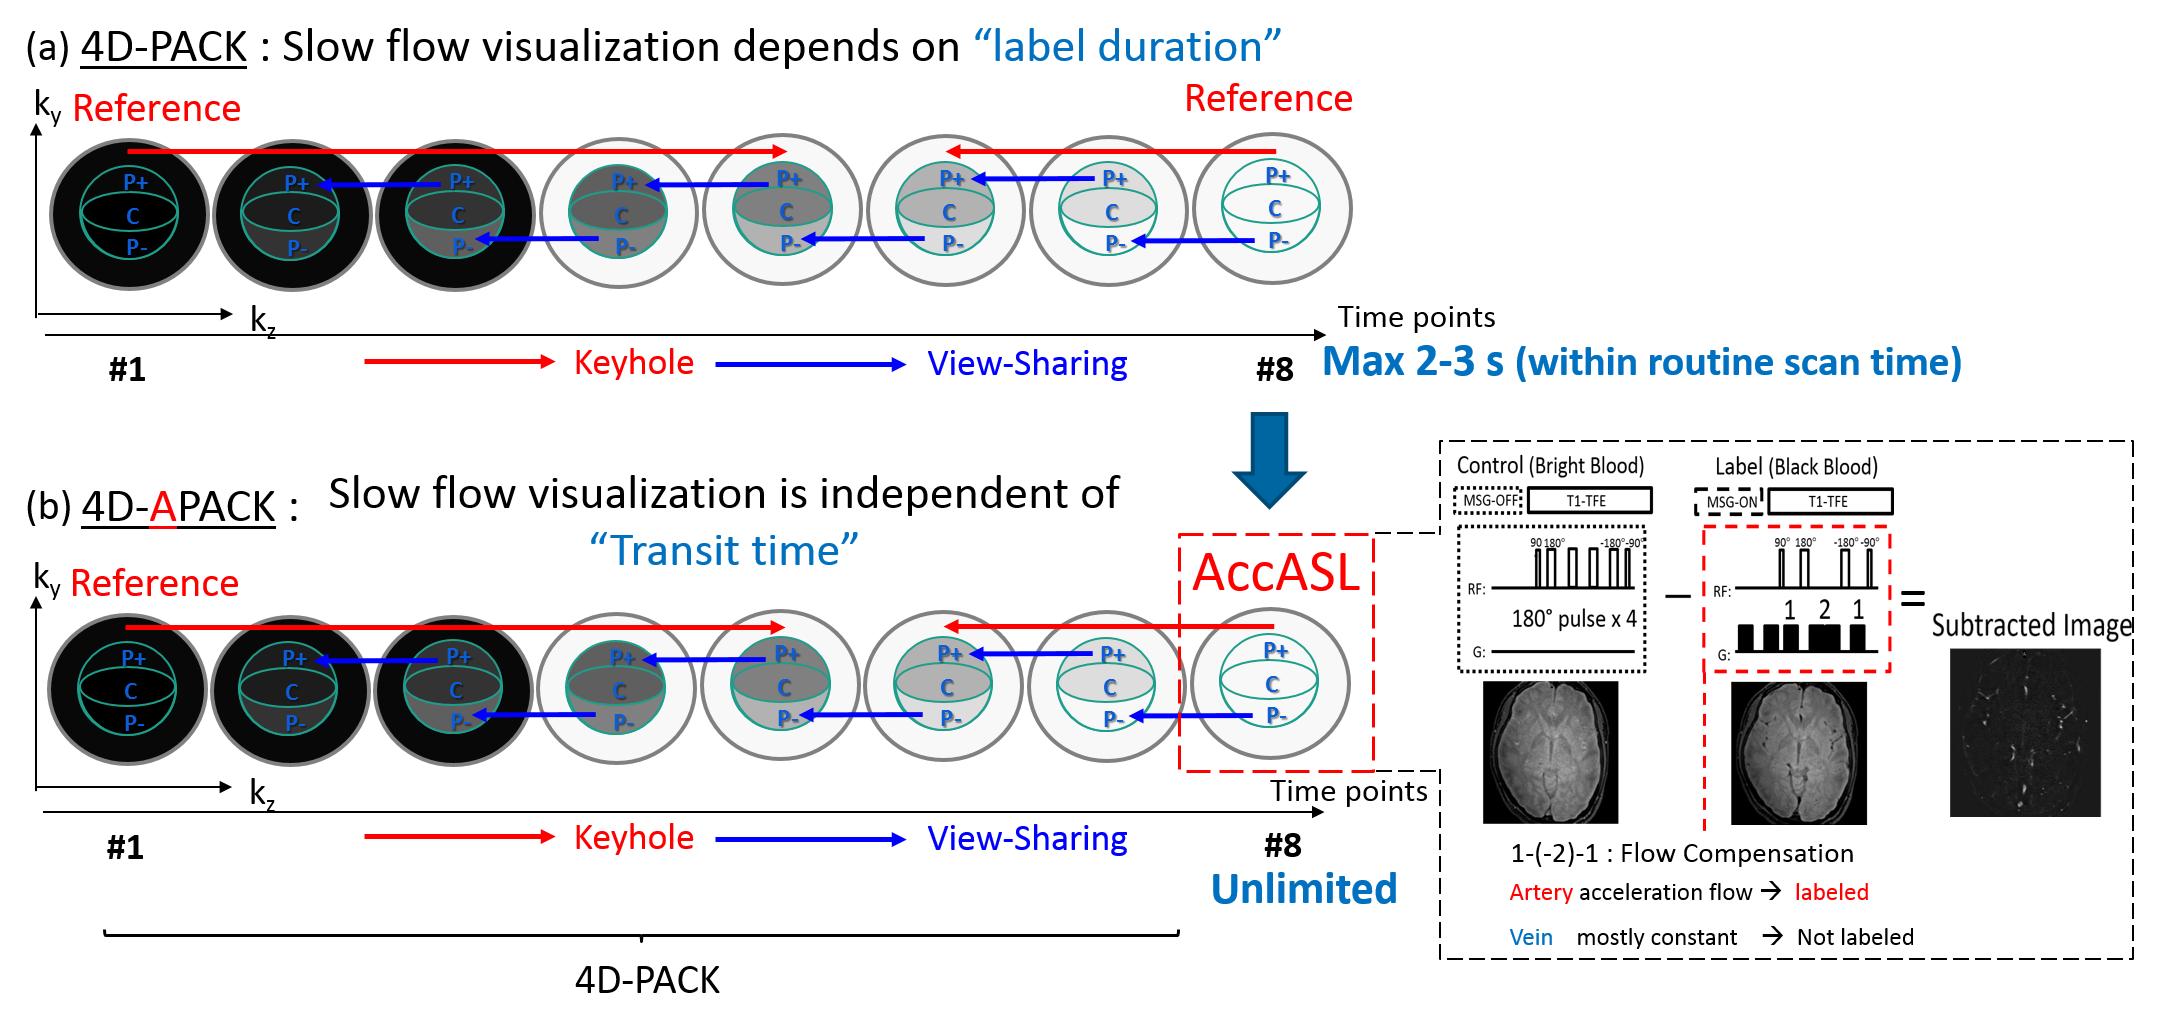
Recently, the 4D-PACK scheme has been developed for 3D dynamic non-contrast magnetic resonance angiography (4D-MRA)1-2. This sequence consists of 4D pseudo-continuous arterial spin labeling (4D-pCASL)3-4, enhanced with Keyhole and view-sharing technique for efficient sampling5-6. As we previously reported, 4D-PACK can provide better flow visualization and reduce scan time2. However, since 4D-PACK visualization depends on spatially selective labeling at carotid arteries, it is difficult for 4D-PACK to visualize very slow flow which takes a long transit time.
On the other hand, employed with pre-pulse of RF pulses and gradients in flow compensation design, acceleration-selective ASL approach (AccASL)7-8 can directly label arteries. Because AccASL visualization is independent of arterial transit time (ATT), AccASL can visualize very slow flow. Therefore, we have developed new 4D-MRA scheme, named 4D-AccASL-PACK (4D-APACK) by combining 4D-PACK and AccASL for obtaining efficiently both dynamic information and ATT independent visualization of very slow flow. The aim of this study is to investigate hemodynamics accuracy and visualization performance in MCA for 4D-APACK comparing to conventional 4D-pCASL.
METHODS
4D-PACK and 4D-APACK scheme: 4D-PACK and 4D-APACK are shown in Figs. 1. To obtain efficiently both dynamic information and visualization of very slow flow, 4D-APACK replaces the last timepoint data of 4D-PACK with AccASL, which can visualize slow flow as it is independent of the ATT. The AccASL data is used for the latter reference and view-sharing data.
Subject and equipment: This sequences were implemented on a 3.0-T MR scanner (Philips, Ingenia R5.17). Six healthy volunteers and one AVM patient were examined after obtaining informed consent as required by hospital review board.
Sequence parameters: 4D-APACK replaces the last timepoint data of 4D-PACK with AccASL and uses them as reference data. For consistent hemodynamics, AccASL data is obtained with the same pCASL label duration as 4D-PACK’s last timepoint. As the AccASL data is copied to previous timepoints data, it may affect hemodynamics accuracy and visualization performance. To investigate that, 4D-APACK and conventional 4D-pCASL were obtained and images were compared in regard to flow dynamic information and flow visualization. Acquisition parameters are summarized in Table 1.
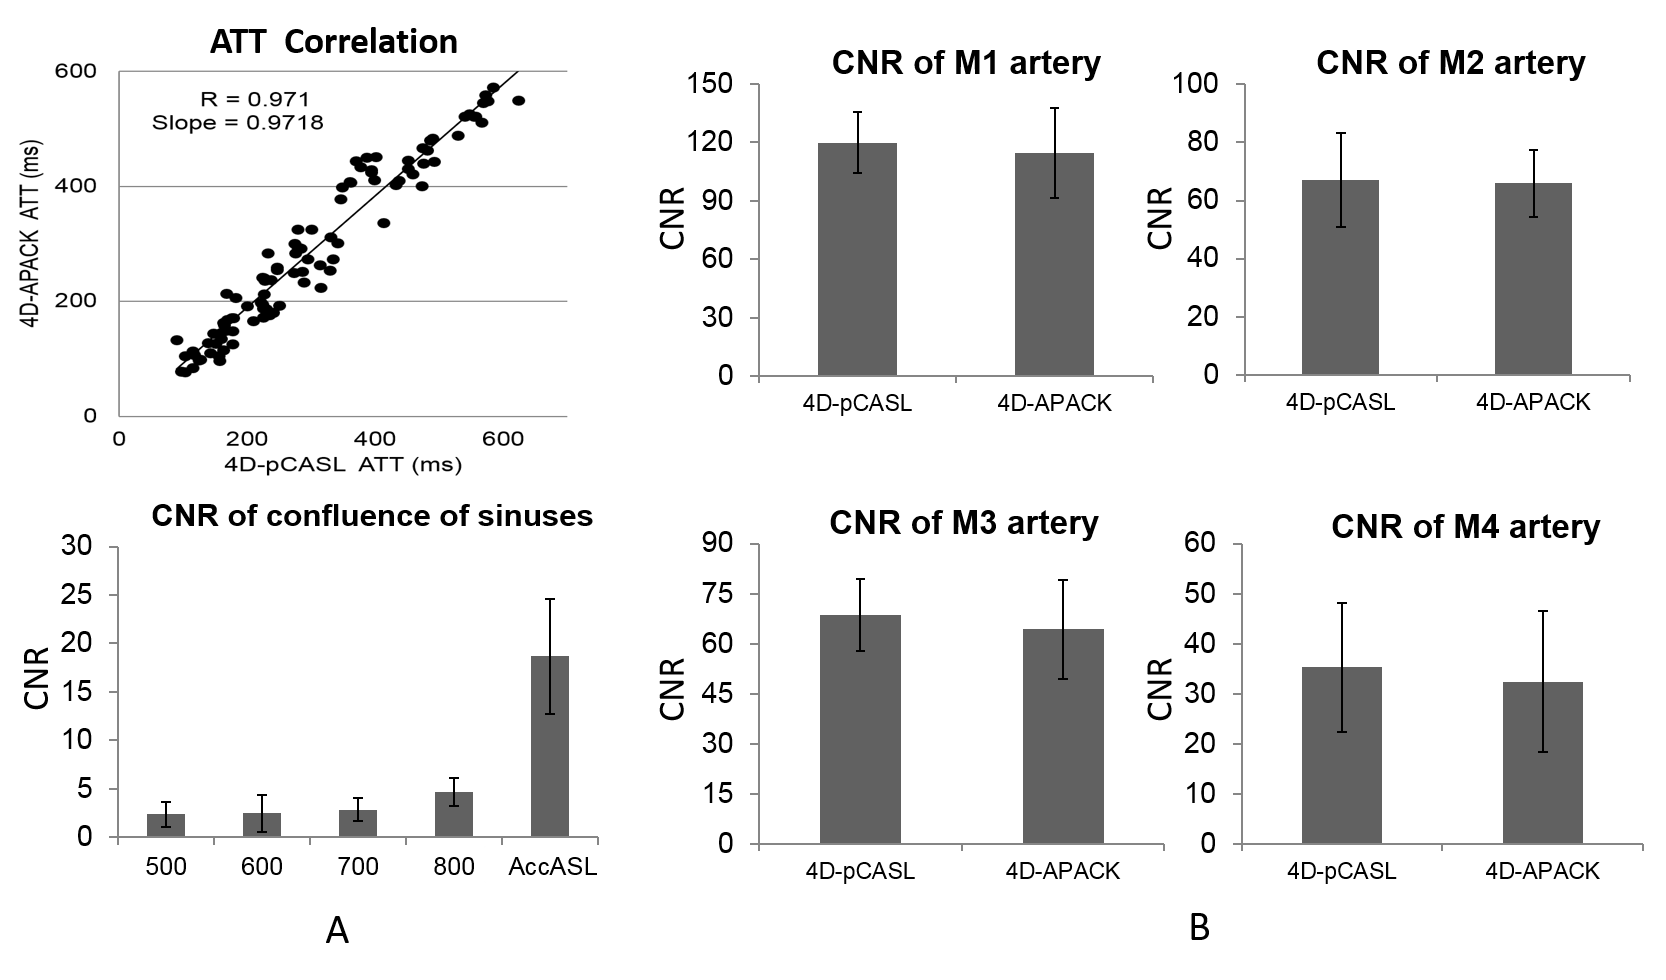
Validation of flow dynamic information in volunteers: ATT was measured in 4D-pCASL and 4D-APACK for validation of flow dynamic accuracy in volunteers. Axial maximum intensity projection (MIP) images were generated and circular region-of-interests (ROIs) were placed on the multiple regions in middle cerebral artery (MCA). The maximum signal within ROI was measured at each timepoint and connected linearly. The ATT was defined as the time points for the signal to reach its half maximum9. We then measured the Pearson’s correlation coefficient and slope of the fitted line. Because confluence of the sinuses (COS) is visualized in AccASL, we assessed the effect of contamination of sinus which may arise from AccASL. The ROIs were placed on COS and white matter (WM), and CNR was calculated as CNR = (bloodmax - WMave)/WMSD. Here bloodmax is the maximum signal intensity in the ROI, and WMave and WMSD is average signal and standard deviation in the WM ROI, respectively.
Assessment of CNR in MCA: For assessment of MCA visualization performance, CNRs in M1-M4 branches for 4D-pCASL and 4D-APACK were measured.
Visualization of flow dynamics in AVM patient: Qualitative assessment of hemodynamics in AVM patient were conducted for 4D-APACK by using 80-mm MIP images.
Statistical analysis: For each analysis, data are presented as means ± standard deviations and paired t-test was used. P values less than 0.05 was considered statistically significant.
RESULTS
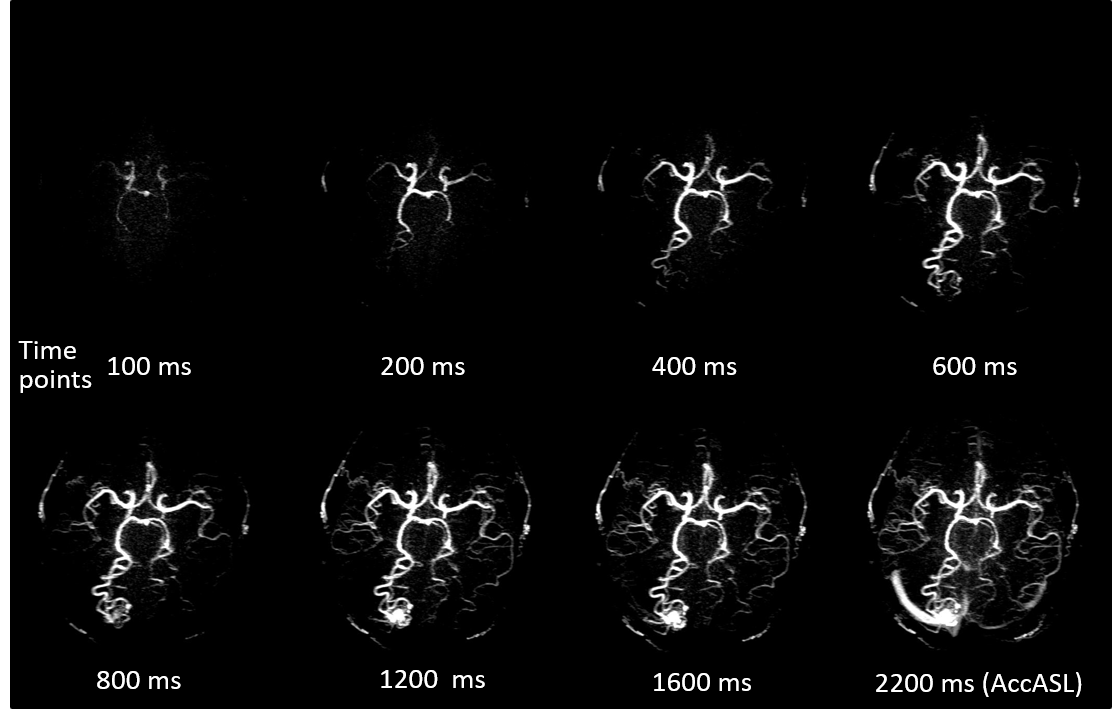
The images obtained by 4D-PACK and 4D-APACK exhibit similar inflow dynamic information as shown in Fig. 2. For validation of hemodynamic accuracy, the ATT correlation coefficients and CNRs of COS at timepoint of 500-800 ms and AccASL (800 ms) are shown in Fig. 3A. The correlation coefficients between 4D-pCASL and 4D-APACK were 0.971 and the slopes of the fitted line was 0.9718.
As for the assessment of MCA visualization for 4D-APACK, CNRs of M1-M4 were not significant different between two sequences as shown in Fig. 3B. The CNR in timepoint of 800 ms for 4D-APACK was at most 1/7 of CNR of M1-M4. Therefore, contamination of COS was not clinically problematic.
Figs. 4 shows the hemodynamics images for 4D-APACK in AVM patient. In addition to hemodynamic information in 4D-APACK, the nidus and feeding artery were visualized by AccASL timepoint. The COS was not observed in dynamic images.
CONCLUSION
We have demonstrated that 4D-APACK brings reliable hemodynamic information comparable to 4D-pCASL. These results indicate that 4D-APACK can provide better visualization of long transit time arteries within clinically acceptable scan time.Acknowledgements
No acknowledgement found.References
1. Togao O et al. 4D MR Angiography with Pseudo-Continuous Arterial Spin Labelling Combined with CENTRA-Keyhole (4D-PACK): Visualization of Distal Cerebral Arteries in Moyamoya Disease. In:Proc 25th Annual Meeting of ISMRM, Honolulu 2017;145.
2. Obara M et al. Non-Contrast Enhanced 4D Intracranial MR Angiography Based on Pseudo-Continuous Arterial Spin Labelling (pcasl) with the Keyhole Technique. In:Proc 24th Annual Meeting of ISMRM, Singapore 2016;4376.
3. Wu H et al. Noncontrast dynamic 3D intracranial MR angiography using pseudo-continuous arterial spin labeling (PCASL) and accelerated 3D radial acquisition. J Magn Reson Imaging. 2014;39:1320-1326.
4. Okell TW et al. Optimization of 4D vessel-selective arterial spin labeling angiography using balanced steady-state free precession and vessel-encoding. NMR Biomed. 2016;29:776-786.
5. van Vaals JJ et al.“Keyhole” method for accelerating imaging of contrast agent uptake. J Magn Reson Imaging. 1993;3:671-675.
6. Hadizadeh DR et al. View-sharing in keyhole imaging: Partially compressed central k-space acquisition in time-resolved MRA at 3.0 T. Eur J Radiol. 2011;80:400-406.
7. Priest AN et al. Improved artery-vein separation with acceleration-dependent preparation for non-contrast enhanced magnetic resonance angiography. Magn Reson Med. 2014;72:699–706.
8. Obara M et al. Acceleration-Selective Arterial Spin Labeling for Intracranial MR Angiography With Improved Visualization of Cortical Arteries and Suppression of Cortical Veins. Magn Reson Med. 2017;77:1996-2004.
9. Riederer SJ et al. Time-of-Arrival Mapping at Three-dimensional Time-resolved Contrast-enhanced MR Angiography. Radiology. 2009;253:532-542.
Figures