1224
In-vivo correlations between hemodynamics and wall inflammation in patients with intracranial aneurysms: comparing 4D Flow MRI and vessel wall enhancement.1Neuro-Radiology, Centre Hospitalier Sainte-Anne, Paris, France, 2department of medical physics, University of Wisconsin, Madison, WI, United States, 3department of Radiology, University of Wisconsin, Madison, WI, United States
Synopsis
Recent studies point out hemodynamics and wall inflammation as individual risk factors for aneurysm evolution. We investigated on 28 aneurysms in-vivo correlations between hemodynamics and wall inflammation by comparing 4D Flow parameters and quantitative aneurysm wall enhancement. Viscous energy loss and kinetic energy were correlated to maximum values of enhancement with high correlation coefficients (p<0.0001; correlation coefficient 0.79 and p<0.0001; correlation coefficient 0.85, respectively). By showing that flow instability and spatial flow complexity are highly correlated with aneurysm wall enhancement, this study highlights the existence of a link between inflammation process depicted through vessel wall enhancement and hemodynamic patterns.
INTRODUCTION
The incidence of intracranial aneurysms in the general population is 2-6% and ruptures are associated with significant mortality and neurological sequellae.1 However, optimal management of unruptured aneurysms is poorly defined.2 Recent studies point out hemodynamics and wall inflammation as individual risk factors for aneurysm evolution.3–6 We therefore decided to combine flow parameters given by 4D Flow MRI and arterial wall enhancement on vessel wall MRI, to investigate the in-vivo correlations between hemodynamics and wall inflammation in patients with intracranial aneurysms.
METHODS
After institutional review board approval, we recruited 25 patients with asymptomatic unruptured > 5mm aneurysms. Imaging protocol The MR imaging protocol included a synergistic combination of 4D flow (PCVIPR), vessel wall imaging (3D T1 FSE post gadolinium), and 3D Time-of-Flight (TOF) angiography on a clinical 3T system (Discovery MR 750; GE Healthcare, Waukesha, WI) with a 16-channel head and neck array. 3D T1 FSE was acquired with the following parameters: imaging volume, 23×23×16 cm3; repetition time/echo time, 600/11.5 ms; matrix, 288×288×160 interpolated to 512×512×320; spatial resolution: 0.9×0.9×1 mm3)6 post-gadolinium (10 mL of gadoteric acid; Dotarem, Guerbet, France). The total scan time was 4 minutes 16 s. 4D Flow MRI was acquired with a radially undersampled sequence (PCVIPR7,8) with the following parameters: velocity encoding, 80 cm/sec; imaging volume, 22x22x16 cm3; repetition time /echo time = 6.6/2.8ms; receiver bandwidth, ±83.3 kHz; isotropic spatial resolution, 0.86 mm; imaging time, 5 minutes.
Image analysis
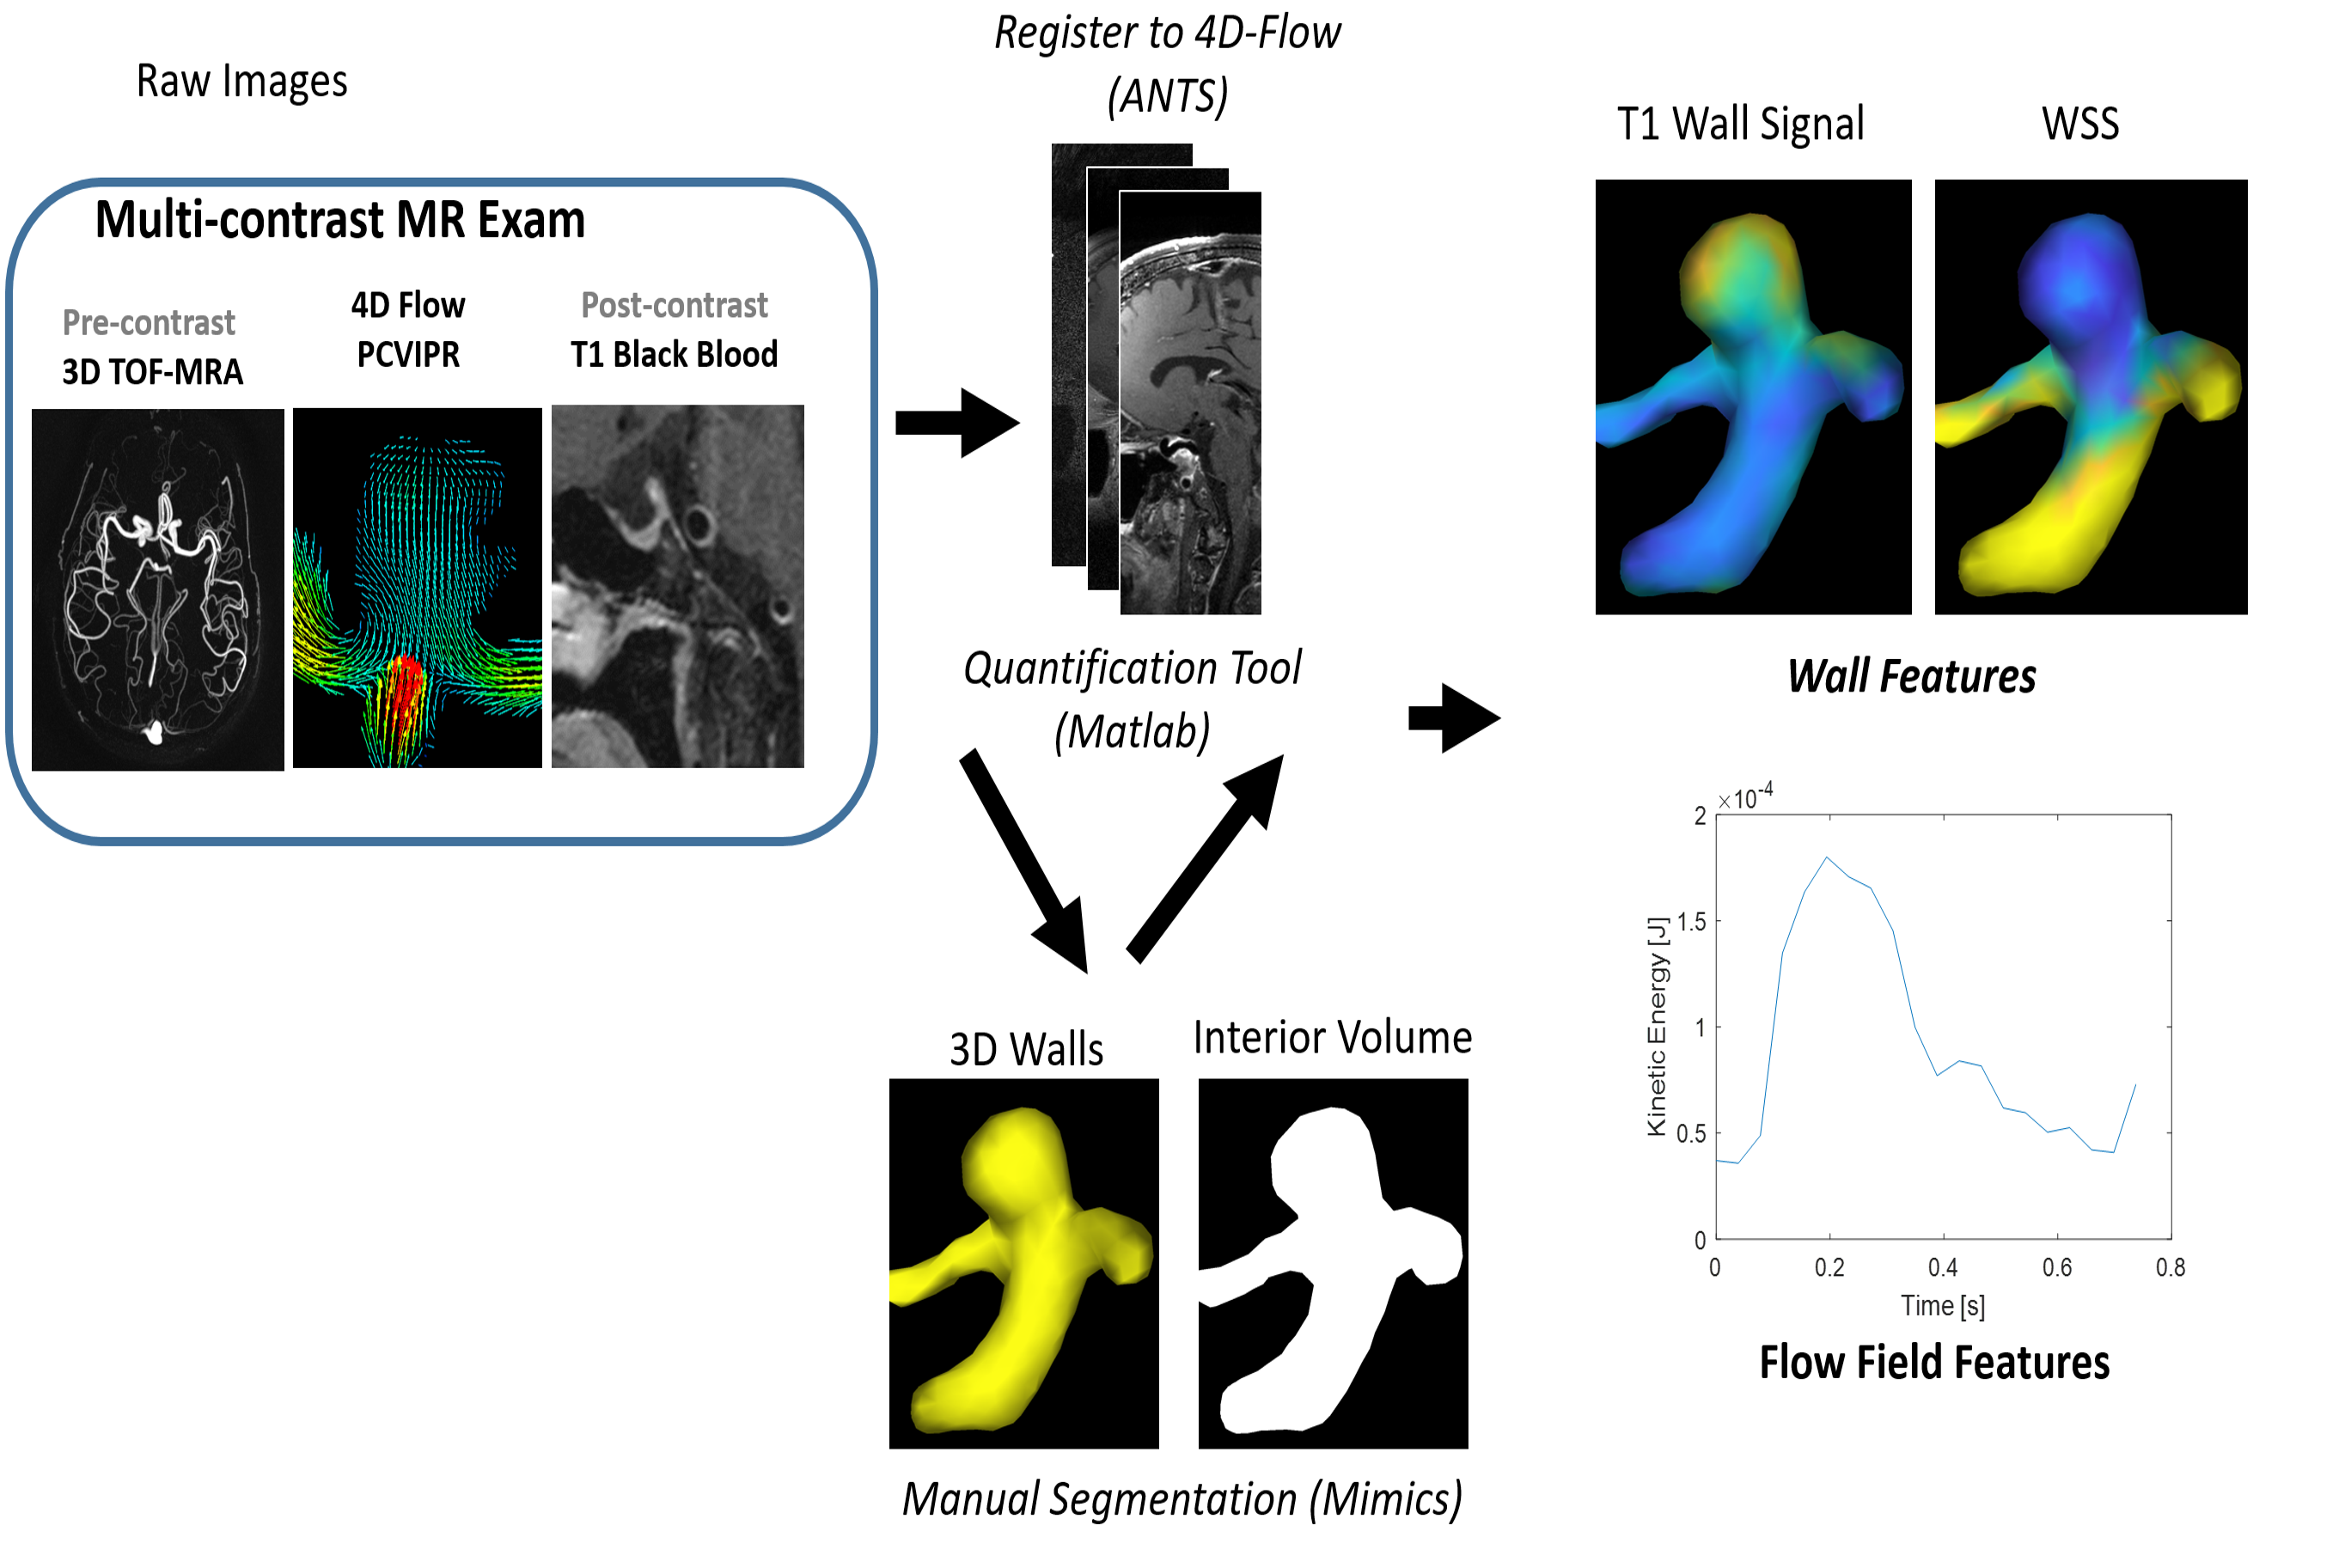
The image analysis flow chart is shown in Figure 1. 3D T1 FSE and 3D TOF images were first registered to the 4D flow dataset, using a rigid registration and mutual information metric with the PC-magnitude images using ANTS.9 Segmentation: Hemodynamic quantification is heavily dependent on the accuracy of segmentation routines needed to define boundaries. As such, geometry was derived using manual segmentation software (Mimics 17, Materialise, Leuven, Belgium). Based on its superior depiction of the vessel lumen, 3D TOF images were used for this segmentation.
4D Flow: 4D MR flow data were preprocessed to remove effects from gradient non-linearity, background phase offsets, and cast into a divergence-free flow field for noise reduction. Subsequent data analysis used custom routines developed to measure parameters of interest (Matlab, Natwick, MA, USA) and software packages for visualization of dynamic velocity fields and other quantitative variables (Ensight, CEI, Apex, NC). This included both wall measures (wall shear stress) and flow field features (kinetic energy10 and viscous energy loss11).
Vessel Wall imaging: The segmented 3D TOF mask of each aneurysm was a 3D surface mesh detailing the location of the vessel wall, and was utilized to measure the T1 signal intensity just outside the vessel lumen. To reduce signal intensity variability between scans, the signal intensity of the aneurysm wall enhancement was normalized to signal from ROIs drawn in the corpus callosum. Statistical analysis: We tested the existence of a correlation between quantitative flow measurements and quantitative analysis of aneurysm wall enhancement using a Pearson test. The correlation between aneurysm size and enhancement was also tested.
RESULTS
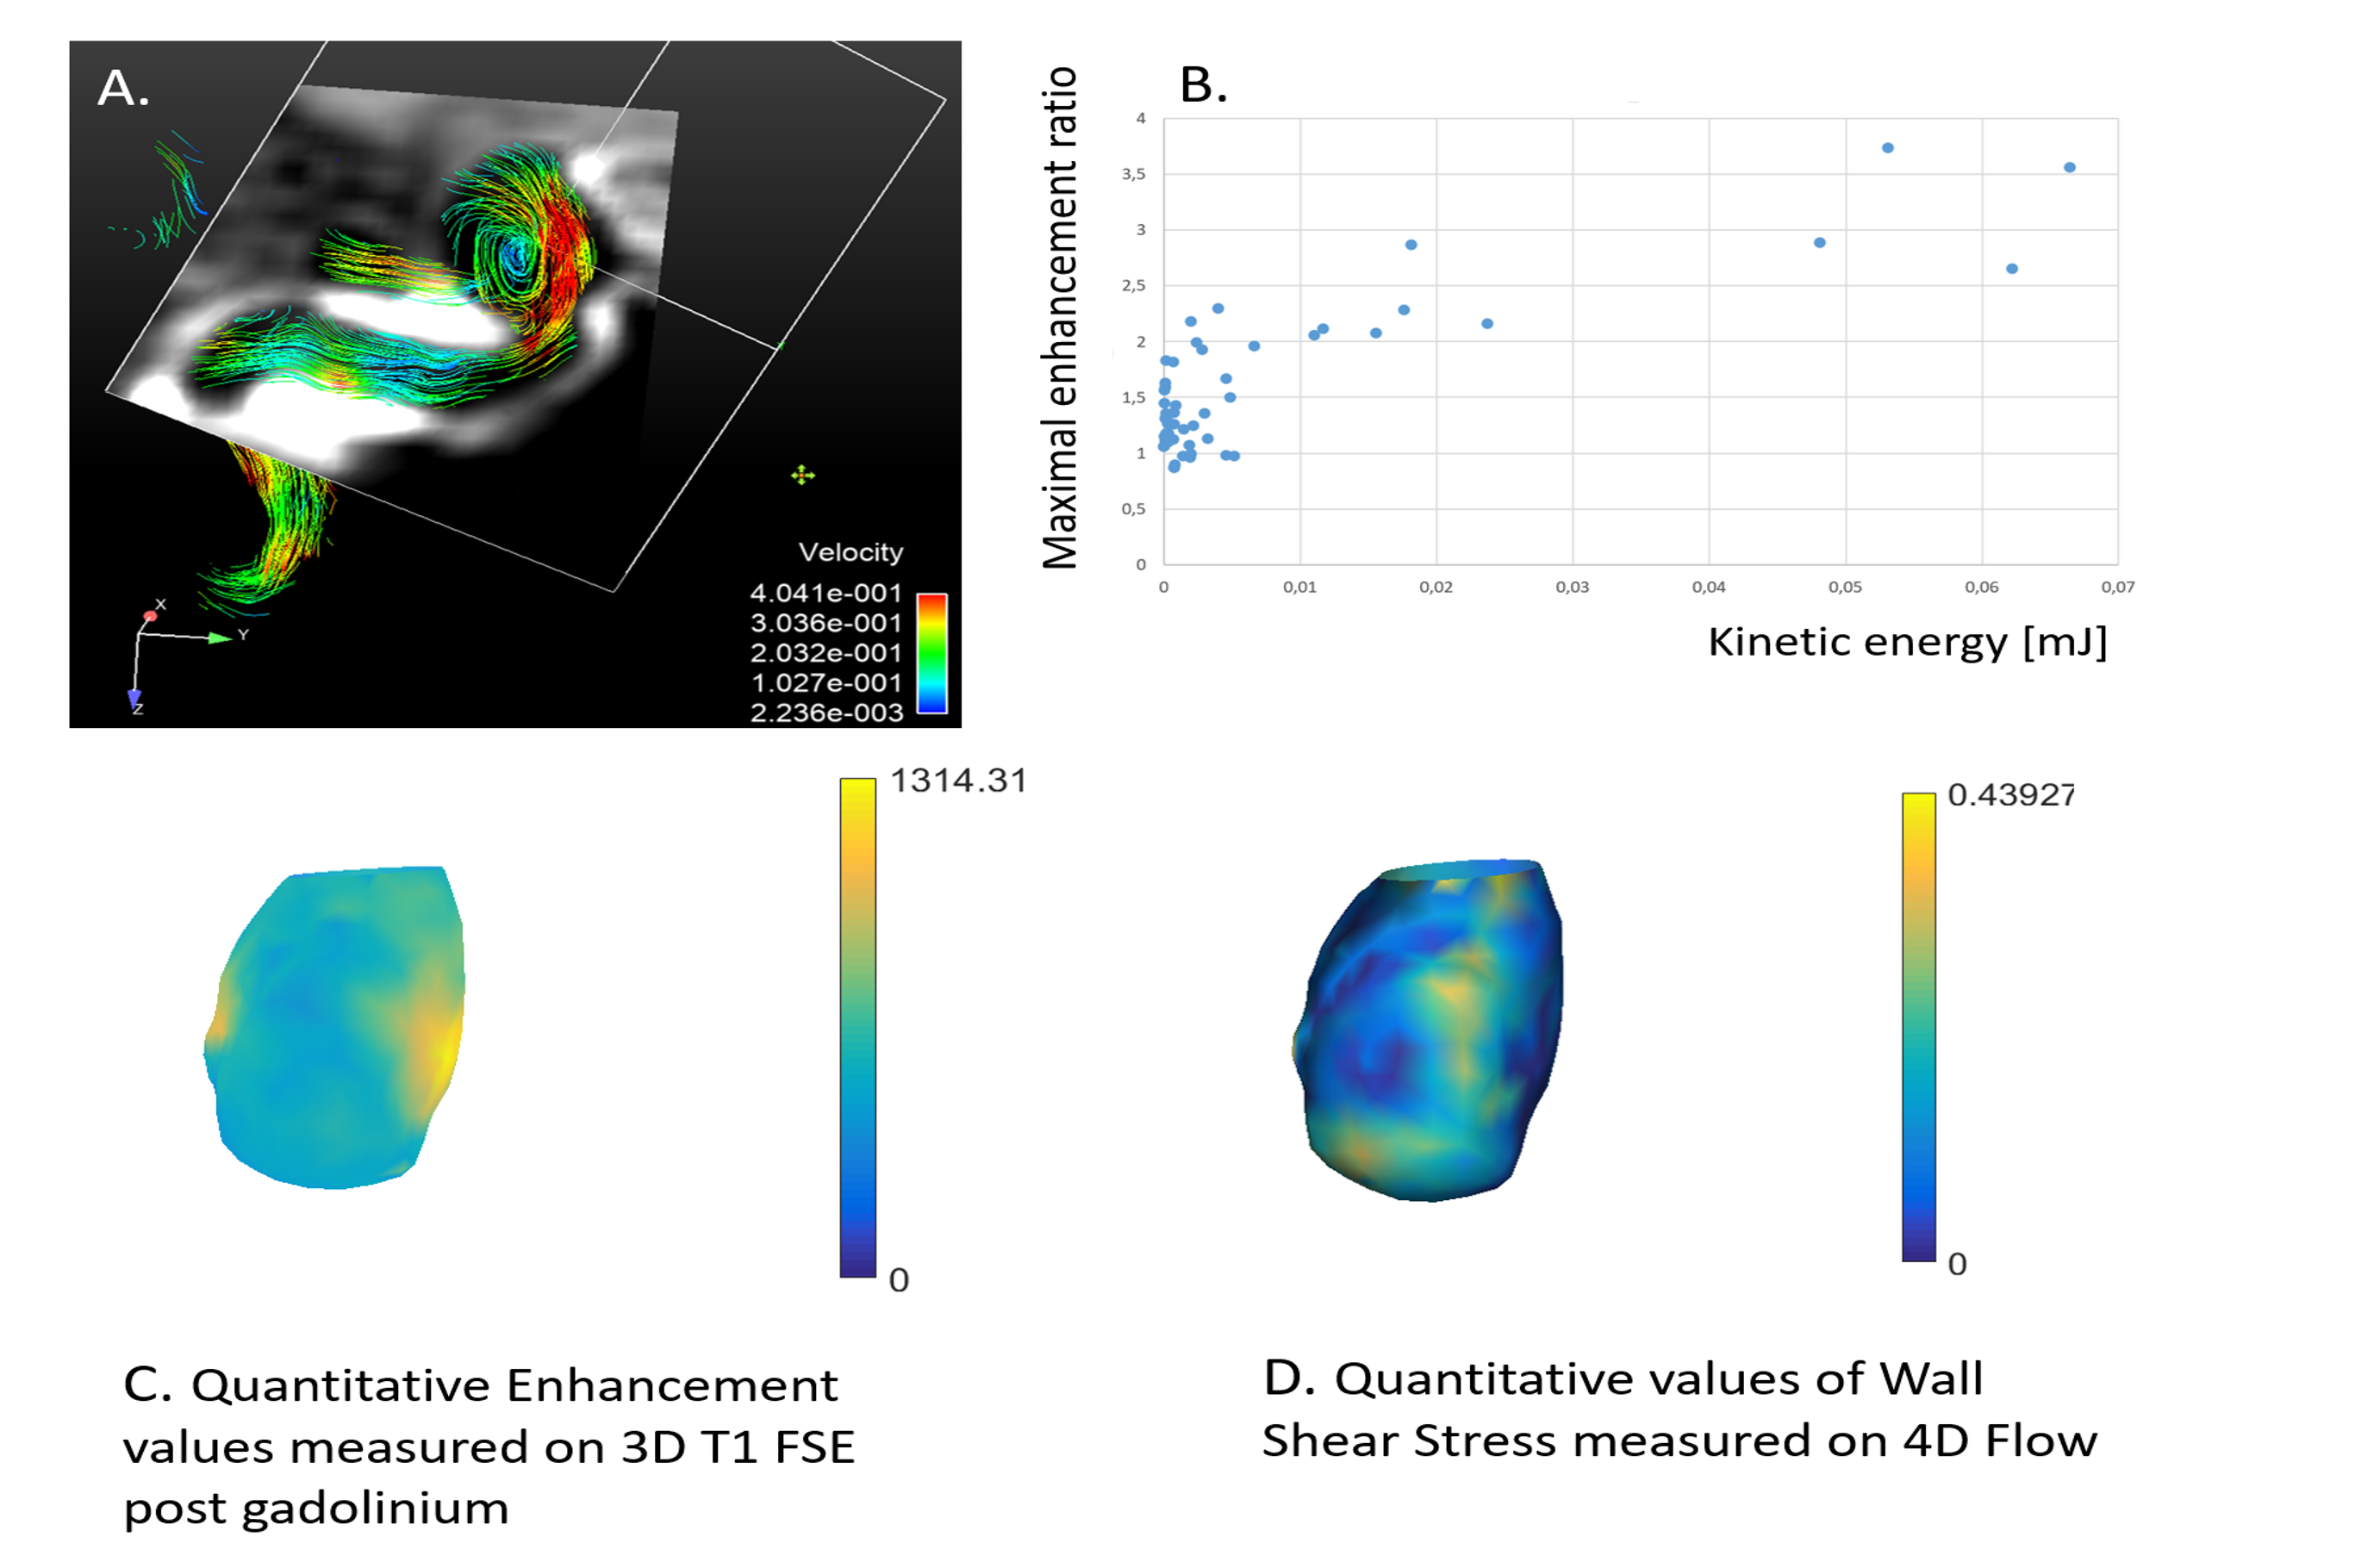
Because of motion artifacts, 1 patient was excluded from the analysis. Characteristics of the 28 included aneurysms are summarized in Table 1. No significant correlation was found between values of enhancement (both mean and maximum values of enhancement) and average WSS; nor with average velocity measured inside the aneurysm. There was no correlation between size (neck-to-dome length) of the aneurysm and 4D flow parameters. Viscous energy loss and kinetic energy were correlated to maximum values of enhancement with high correlation coefficients (p<0.0001; correlation coefficient 0.79 and p<0.0001; correlation coefficient 0.85, respectively).
DISCUSSION
Viscous energy loss and kinetic energy are two parameters reflecting the flow disorganization patterns inside the aneurysm pouch. They highly correlate with the maximum value of wall enhancement. By showing that flow instability and spatial flow complexity are highly correlated with aneurysm wall enhancement, this study highlights the existence of a link between vessel wall enhancement (presumably an inflammation process) and hemodynamic patterns. It corroborates the thought that through mechanical transduction, hemodynamics can alter cell regulation, genetics and inflammatory processes.12
Table 1:
Aneurysms characteristics:
Size, median(IQR), mm 8,5 (6-10)
Location - MCA, number (percentage) 14 (50%)
Location - ACA, number (percentage) 7 (25%)
Location - ICA, number (percentage) 5 (17,8%)
Location - BA, number (percentage) 2 (7,2%)
Average Velocity (mm/s), median (IQR) 35,5 (16,3-60,7)
Maximum enhancement value, median (IQR) 936 (777-1292)
Average WSS (N/m2), median (IQR) 0,4 (0,3-0,54)
Acknowledgements
No acknowledgement found.References
1. Wiebers DO, Whisnant JP, Huston J, et al. Unruptured intracranial aneurysms: natural history, clinical outcome, and risks of surgical and endovascular treatment. Lancet Lond Engl. 2003;362(9378):103-110.
2. Raymond J, Guillemin F, Proust F, et al. Unruptured Intracranial Aneurysms. A Critical Review of the International Study of Unruptured Intracranial Aneurysms (ISUIA) and of Appropriate Methods to Address the Clinical Problem. Interv Neuroradiol J Peritherapeutic Neuroradiol Surg Proced Relat Neurosci. 2008;14(1):85-96. doi:10.1177/159101990801400111.
3. Cebral J, Ollikainen E, Chung BJ, et al. Flow Conditions in the Intracranial Aneurysm Lumen Are Associated with Inflammation and Degenerative Changes of the Aneurysm Wall. AJNR Am J Neuroradiol. 2017;38(1):119-126. doi:10.3174/ajnr.A4951.
4. Chung BJ, Doddasomayajula R, Mut F, et al. Angioarchitectures and Hemodynamic Characteristics of Posterior Communicating Artery Aneurysms and Their Association with Rupture Status. AJNR Am J Neuroradiol. August 2017. doi:10.3174/ajnr.A5358.
5. Hasan D, Chalouhi N, Jabbour P, et al. Early Change in Ferumoxytol-Enhanced Magnetic Resonance Imaging Signal Suggests Unstable Human Cerebral Aneurysm. A Pilot Study. Stroke J Cereb Circ. 2012;43(12):3258-3265. doi:10.1161/STROKEAHA.112.673400.
6. Edjlali M, Gentric J-C, Régent-Rodriguez C, et al. Does aneurysmal wall enhancement on vessel wall MRI help to distinguish stable from unstable intracranial aneurysms? Stroke. 2014;45(12):3704–3706.
7. Gu T, Korosec FR, Block WF, et al. PC VIPR: a high-speed 3D phase-contrast method for flow quantification and high-resolution angiography. AJNR Am J Neuroradiol. 2005;26(4):743-749.
8. Edjlali M, Roca P, Rabrait C, et al. MR selective flow-tracking cartography: a postprocessing procedure applied to four-dimensional flow MR imaging for complete characterization of cranial dural arteriovenous fistulas. Radiology. 2014;270(1):261-268. doi:10.1148/radiol.13130507.
9. Avants BB, Tustison NJ, Song G, Cook PA, Klein A, Gee JC. A reproducible evaluation of ANTs similarity metric performance in brain image registration. NeuroImage. 2011;54(3):2033-2044. doi:10.1016/j.neuroimage.2010.09.025.
10. Giese D, Weiss K, Baeßler B, et al. In vitro evaluation of flow patterns and turbulent kinetic energy in trans-catheter aortic valve prostheses. Magma N Y N. September 2017. doi:10.1007/s10334-017-0651-y.
11. Barker AJ, van Ooij P, Bandi K, et al. Viscous energy loss in the presence of abnormal aortic flow. Magn Reson Med. 2014;72(3):620-628. doi:10.1002/mrm.24962.
12. Hosaka K, Hoh BL. Inflammation and cerebral aneurysms. Transl. Stroke. 2014:190–8.
Figures