1220
Longitudinal structural and functional brain network alterations in a mouse model of neuropathic pain1RG Translational Imaging, Central Institute of Mental Health, Medical Faculty Mannheim, University of Heidelberg, Mannheim, Germany, 2Neuroimaging, Central Institute of Mental Health, Medical Faculty Mannheim, University of Heidelberg, Mannheim, Germany, 3RG Behavioral Genetics, Central Institute of Mental Health, Medical Faculty Mannheim, University of Heidelberg, Mannheim, Germany, 4Psychopharmacology, Central Institute of Mental Health, Medical Faculty Mannheim, University of Heidelberg, Mannheim, Germany, 5Psychiatry and Psychotherapy, Central Institute of Mental Health, Medical Faculty Mannheim, University of Heidelberg, Mannheim, Germany
Synopsis
We combined multimodal (rsfMRI,M MRS, VBM) neuroimaging to longitudinally monitor changes in brain metabolism, structure and connectivity using the spared nerve injury (SNI) mouse model of chronic neuropathic pain. Voxel-based morphometry demonstrated volume decrease in all brain sites assessed. Global and local network changes after SNI disappeared over time, except the nucleus accumbens, prefrontal cortex and hippocampus. Connectivity changes were accompanied by enhanced glutamate levels in the hippocampus. We suggest that hippocampal hyperexcitability may alter synaptic plasticity within the nucleus accumbens, circadian motor activity and emotionality during pain chronification.
Introduction
Chronic pain state affects multiple brain functions, including motivational processing, and has a high comorbidity with mood disorders1,2. Here we used multimodal neuroimaging to longitudinally monitor changes in brain metabolism, structure and connectivity in the spared nerve injury (SNI) mouse model of chronic neuropathic pain. Neuroimaging studies have demonstrated a reorganization of brain structures associated with chronic pain 3-7, and two longitudinal multimodal neuroimaging studies in humans and rats revealed reduced grey matter density in the Nucleus Accumbens (NAc) and a greater functional connectivity of NAc and Prefrontal Cortex (PFC), respectively, predictive of pain chronification8,9.Methods
MR data were acquired in a 9.4 T horizontal bore animal scanner equipped with a two element cryogenic mouse surface coil. Twenty C57BL/6N mice (10 SNI vs 10 SHAM injury) were measured at different time points: T1, baseline measurement; T2, one- and T3 twelve weeks after SNI surgery.
MRS: Two voxel from the PFC and right hippocampus were acquired using a short echo-time (10ms) PRESS-sequence under isoflurane anesthesia. The absolute metabolite concentrations (LCModel) were analyzed with a repeated measurements general linear model.
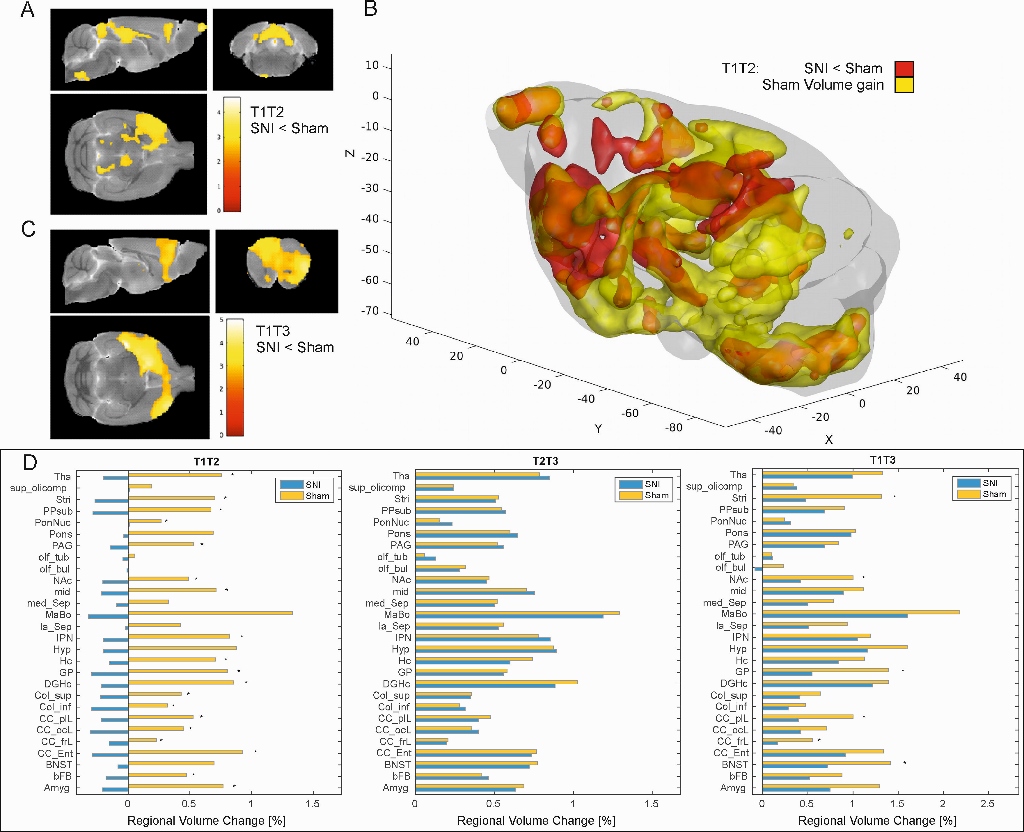
VBM: High-resolution 3D-T2-weighted structural images were acquired. Within subject pairwise longitudinal nonlinear registration was performed (SPM12) by comparing the three time points against each other. Jacobian images were generated depicting the individual volume change between the time points. Additionally the volumes were split into 28 anatomical regions. Values in the volume difference images were extracted for each region and percent volume changes were calculated for the given time period and compared in two-sample t-tests.
rsfMRI: Time-series were acquired with echo-planar imaging (EPI-FID) under medetomidine anaesthesia. Mean time-courses were extracted for each subject from a subset of 17 pain-related anatomical regions. The brain networks for each time point were constructed by computing the Pearson correlation coefficient between the time series extracted from each pair of regions of interest. Weighted networks were created by thresholding these correlation matrices over a range of densities10. Standard network parameter computation was implemented in MATLAB using the Brain Connectivity Toolbox11.
Results
MRS: Most metabolites increased in concentration over time, while lactate levels decreased (F(5,17)=70; p<0.001). We also found a significant group_x_time interaction for glutamate in the hippocampus (F(5,17)=3.9, p=0.032). While glutamate was constantly increasing in the control animals, the SNI group had lower glutamate levels after one week (T1) and higher levels after twelve weeks (T3; Fig. 1C). On the other hand we found changes in GABA metabolites (Fig. 1E-F), especially the ratio of glutamine/GABA showed a significant group_x_time interaction in the PFC (F(5,17)=4.68, p=0.047).
VBM: In control animals, there was a progressive increase in brain volume over time (Fig. 2b). There was an overall decrease in volume in the SNI group between T1->T2 (p<0.01). When comparing T2->T3, no group differences were observed. In T1->T3, significant differences in the bed nucleus of the stria terminalis (BNST), the PFC cluster, the NAc and striatum were observed (Fig. 2d).
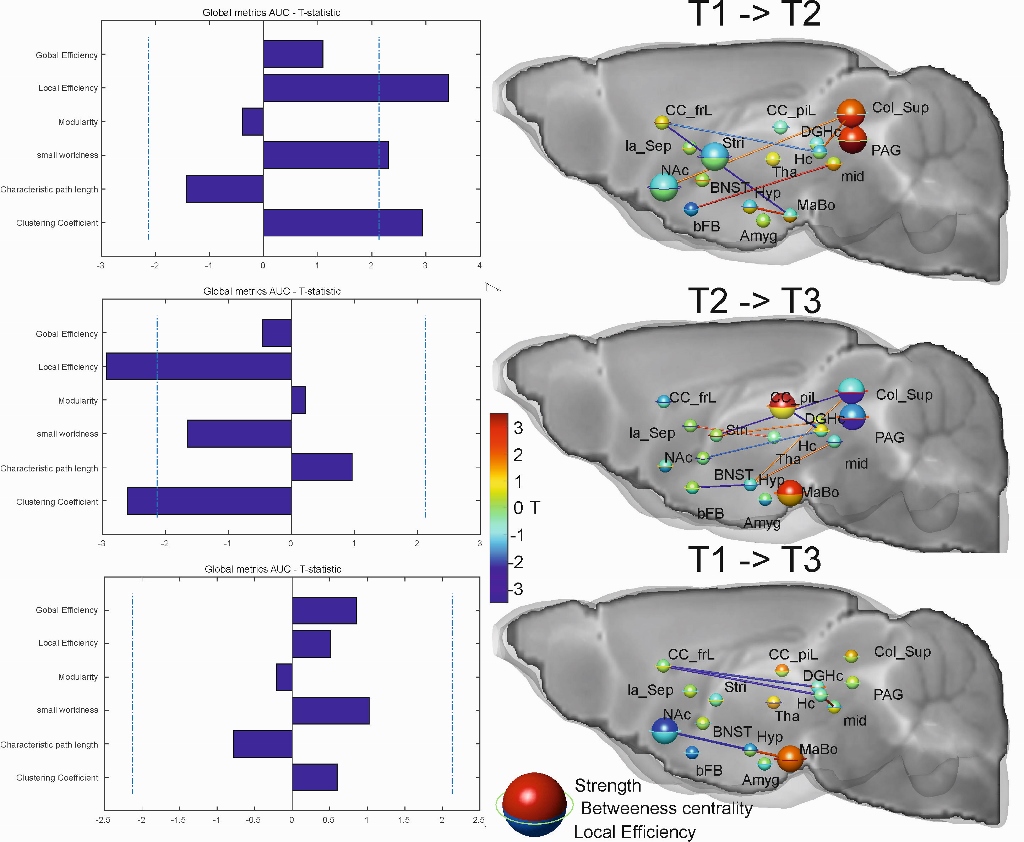
rsfMRI: Strong alterations of the global network characteristics were found (T1->T2, Fig. 3). Local efficiency, clustering coefficient and small world index were increased significantly in the SNI group compared to controls. This increase was reflected locally, especially for the colliculus superior and the periaqueductal gray. Due to the reversed effect during the later time (T2->T3) the global network parameters at T3 did not show any more significant changes compared to the pre-surgery condition (T1). What remained were the early decline of the NAc which had a significantly lowered strength (p=0.014) and the later emerging role the mammillary bodies (MaBo) which had increased strength (p=0.02) and a trend for increase local efficiency (p=0.052). It is notable that the connections between the two regions assessed by MRS, the frontal lobe and hippocampus, showed a significant lower connectivity between the pre-surgery condition and both T2 (p=0.046) and T3 (p=0.006).
Discussion
This longitudinal study shows that induced neuropathic pain may have an acute phase where regions involved in pain networks are strongly affected with many but not all changes disappearing over time.In the first week after surgery the global network topology changed to a more integrated information processing state. Between week one and week twelve the global changes in functional network topology were – similar to the structural changes – reversed. What remained in the chronic pain state were the changes to the NAc, MaBo as a local hub and lower connectivity between frontal and the hippocampal areas. These results suggest that the time-course associated with these network changes and phenotypic alterations may mirror the chronification of neuropathic pain. Partial differences of these results in comparison to two previous studies on a rat model might be explained with the different species/region/time selection and anaesthesia6,7.
Acknowledgements
We would like to thank Felix Hörner for his excellent technical assistance. This study was supported by the Deutsche Forschungsgemeinschaft (DFG) SFB1158/B04.References
1. Attal N, Lanteri-Minet M, Laurent B, Fermanian J, Bouhassira D. The specific disease burden of neuropathic pain: results of a French nationwide survey. Pain. 2011;152(12):2836-43.
2. Langley PC, Van Litsenburg C, Cappelleri JC, Carroll D. The burden associated with neuropathic pain in Western Europe. Journal of medical economics. 2013;16(1):85-95.
3. Baliki MN, Chialvo DR, Geha PY, et al. Chronic pain and the emotional brain: specific brain activity associated with spontaneous fluctuations of intensity of chronic back pain. J Neurosci. 2006;26(47):12165-73.
4. Alomar S, Bakhaidar M. Neuroimaging of neuropathic pain: review of current status and future directions. Neurosurgical review. 2016.
5. Seminowicz DA, Laferriere AL, Millecamps M, Yu JS, Coderre TJ, Bushnell MC. MRI structural brain changes associated with sensory and emotional function in a rat model of long-term neuropathic pain. Neuroimage. 2009;47(3):1007-14.
6. Baliki MN, Chang PC, Baria AT, Centeno MV, Apkarian AV. Resting-sate functional reorganization of the rat limbic system following neuropathic injury. Scientific reports. 2014;4:6186.
7. Hubbard CS, Khan SA, Xu S, Cha M, Masri R, Seminowicz DA. Behavioral, metabolic and functional brain changes in a rat model of chronic neuropathic pain: a longitudinal MRI study. Neuroimage. 2015;107:333-44.
8. Baliki MN, Petre B, Torbey S, et al. Corticostriatal functional connectivity predicts transition to chronic back pain. Nat Neurosci. 2012;15(8):1117-9.
9. Chang PC, Pollema-Mays SL, Centeno MV, et al. Role of nucleus accumbens in neuropathic pain: linked multi-scale evidence in the rat transitioning to neuropathic pain. Pain. 2014;155(6):1128-39.
10. Becker R, Braun U, Schwarz AJ, et al. Species-conserved reconfigurations of brain network topology induced by ketamine. Translational psychiatry. 2016;6:e786.
11. Rubinov M, Sporns O. Complex network measures of brain connectivity: uses and interpretations. Neuroimage. 2010;52(3):1059-69.
Figures
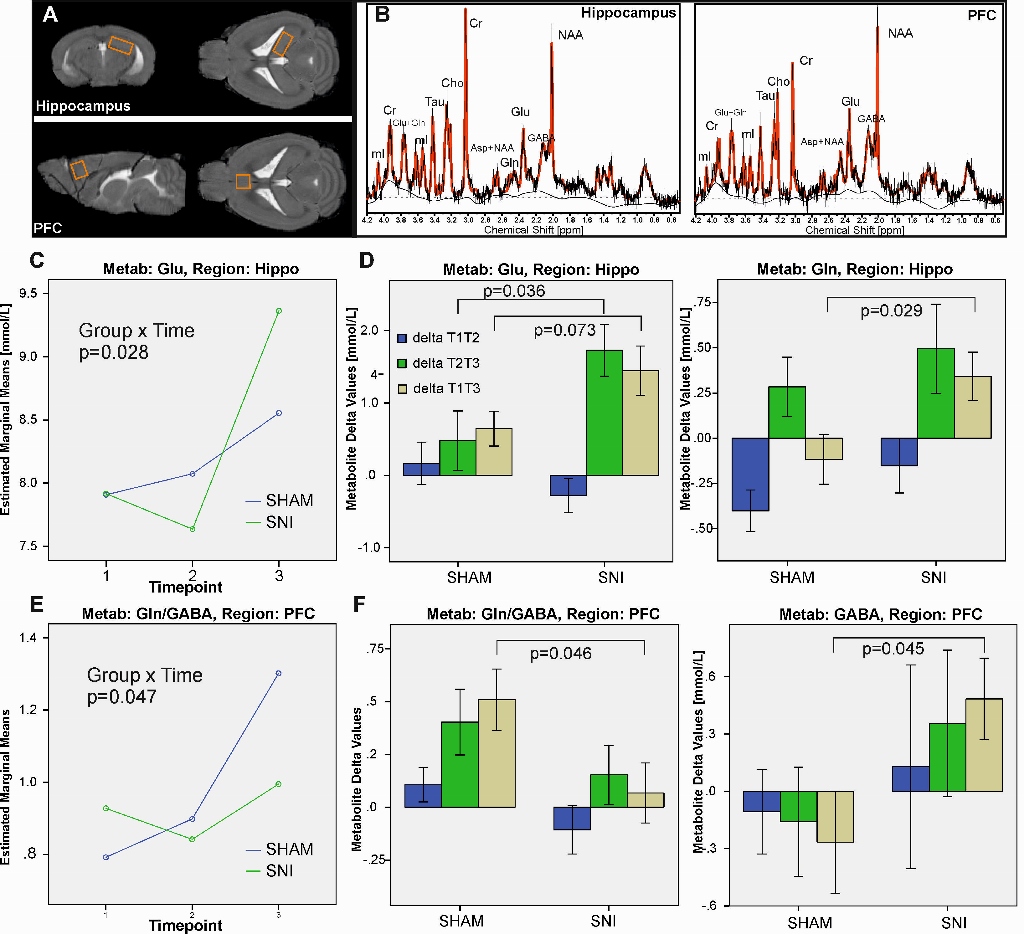
Longitudinal assessment of brain metabolites in the hippocampus and PFC alterations in a mouse model of neuropathic pain: (A) MRS voxel localization for the hippocampus and the prefrontal cortex (PFC). (B) Typical spectra acquired from these regions. (C) Estimated marginal means from the repeated measurements ANOVA for Glu in the hippocampus. (D) Barplots of the individual changes (deltas) of the metabolite concentrations between T1-T2, T2-T3 as well as T1-T3. (E) Estimated marginal means from the repeated measurements ANOVA for the ratio of Gln/GABA in the PFC. (F) Barplots of the individual changes of the Gln/GABA ratio and GABA between T1-T2, T2-T3 as well as T1-T3.